
Rationale and Objectives
Mild cognitive impairment (MCI) is associated with an increased risk of developing dementia. This study aims to determine whether current standard magnetic resonance imaging (MRI) is providing markers that can distinguish between subjects with amnestic MCI (aMCI), nonamnestic MCI (naMCI), and healthy controls (HCs).
Materials and Methods
A subset of 126 MCI subjects and 126 age-, gender-, and education-appropriate HCs (mean age, 70.9 years) were recruited from 4157 participants in the longitudinal community-based Heinz Nixdorf Recall Study. The burden of white matter hyperintensities (WMHs), cerebral microbleeds, and brain atrophy was evaluated on transversal MR images from a single 1.5-T MR scanner by two blinded neuroradiologists. Logistic regression and receiver-operating characteristic analysis were used for statistical analysis.
Results
Occipital WMH burden was significantly increased in aMCI, but not in naMCI relative to HCs ( P = .01). The combined MCI group showed brain atrophy relative to HCs ( P = .01) pronounced at caudate nuclei ( P = .01) and temporal horn level ( P = .004) of aMCI patients and increased at the frontal and occipital horns of naMCI patients compared to either aMCI or HCs. Microbleeds were equally distributed in the MCI and control group, but more frequent in aMCI (22 of 84) compared to naMCI subjects (3 of 23).
Conclusions
In his cohort, increased occipital WMHs and cortical and subcortical brain atrophies at temporal horn and caudate nuclei level distinguished aMCI from naMCI subjects and controls. Volumetric indices appear of interest and should be assessed under reproducible conditions to gain diagnostic accuracy.
Mild cognitive impairment (MCI) describes a transitional state between cognitive changes of normal aging and dementia, especially Alzheimer disease (AD) . Hence, MCI is a risk factor for dementia with an estimated conversion rate of 10%–15% per year, compared to 1%–2% in the cognitively normal, elderly population . This prodromal AD state is diagnosed in the clinical setting by neurologic and neuropsychological assessment . Nonamnestic forms of MCI (naMCI) have shown findings related to vascular disease, whereas amnestic MCI (aMCI) subjects demonstrated demographic, genetic, and magnetic resonance imaging (MRI) characteristics similar to AD pathology . Despite a controversial definition of MCI as a diagnostic entity, because it does not constitute a homogeneous clinical syndrome, it is an ideal target for prevention and future therapies of dementia . An early diagnosis and differentiation of MCI subtypes may have a major impact on the selection of suitable prospective therapies in future. MRI examinations are not routinely included in clinical work-up of MCI, although brain tissue and brain volumetric changes may help to predict conversion from MCI to dementia . Cerebral microbleeds (CMBs) are often in focus of MR studies dealing with neurodegenerative diseases and dementia, but their predictive value in MCI or AD-converters remains unclear . Medial temporal lobe atrophy has been shown to be an important predictor for conversion from MCI to AD . The volume of the hippocampus, the entorhinal cortex, and amygdala is known to decline in early stages of AD . We hypothesized that the degrees of brain atrophy and the burden of white matter hyperintensities (WMHs) and CMBs on transversal 1.5-T MR images correlate with the clinical diagnosis of MCI. Thus, we compared MR signs in subjects with MCI (divided into amnestic and nonamnestic subtypes because of the different underlying etiology) with age-, gender-, and education-matched controls on transversal fluid-attenuated inversion recovery (FLAIR) and T2*-weighted images in a large German population-based study. This study aims to determine whether current standard MRI is providing markers that can distinguish between subjects with aMCI, naMCI, and HCs in a single study.
Materials and methods
Study Population and Sampling Procedure
The Heinz Nixdorf Recall (HNR; Risk Factors, Evaluation of Coronary Calcium and Lifestyle) study is a population-based prospective cohort study with 4814 subjects (age range, 45–75 years) randomly selected from mandatory lists of residence in the Ruhr area in Germany . The major aim of the HNR study was to evaluate the predictive value of coronary artery calcification using electron-beam computed tomography for myocardial infarction and cardiac death in comparison to cardiovascular risk factors. Study methods have been described elsewhere in detail .
Get Radiology Tree app to read full this article<
Diagnostic Classifications and Covariates
Get Radiology Tree app to read full this article<
MR Imaging Techniques and Examination Protocols
Get Radiology Tree app to read full this article<
MR Image Assessment
Get Radiology Tree app to read full this article<
Get Radiology Tree app to read full this article<
Get Radiology Tree app to read full this article<
Statistical Methods
Get Radiology Tree app to read full this article<
Results
Descriptive Statistics
Get Radiology Tree app to read full this article<
Table 1
Characteristics of Subjects with MCI and Controls and Stratified by the Two MCI Subgroups
Parameter MCI Total ( n = 126) Controls ( n = 126)P Value, MCI Versus Controls MCI, Amnestic ( n = 93) MCI, Nonamnestic ( n = 33)P Value, aMCI Versus naMCI Age, y, mean ± SD 70.9 ± 6.4 70.8 ± 6.4 Matched 72.3 ± 5.6 66.9 ± 7.0<.0001 Gender (%) Male 74 (59) 74 (59) 58 (62) 16 (48) Female 52 (41) 52 (41) Matched 35 (38) 17 (52) .17 Education (%) ≤10 y 28 (22) 21 (17) 17 (18) 11 (33) 11–13 y 80 (64) 75 (60) 62 (67) 18 (55) ≥14 y 18 (14) 30 (24) Matched 14 (15) 4 (12) .22 Marital status (%) Single 2 (2) 7 (6) 2 (2) 0 (0) Married 87 (70) 91 (72) 63 (68) 24 (75) Divorced or in separation 10 (8) 8 (6) 6 (7) 4 (139) Widowed 25 (20) 20 (16) Matched 21 (23) 4 (13) .30 CHD (%) Yes 18 (14) 17 (13) 12 (13) 5 (15) No 108 (86) 109 (87) .86 81 (87) 28 (85) .75 Hypertension (JNC7) None 76 (60) 75 (60) ∗ 53 (57) 22 (69) Stage 1 or 2 50 (40) 50 (40) >.99 40 (43) 10 (31) .24
aMCI, amnestic MCI; CHD, coronary heart disease; JNC7, hypertension defined according to “The Seventh Report of the Joint National Committee on Prevention, Detection, Evaluation, and Treatment of High Blood Pressure”; MCI, mild cognitive impairment; naMCI, nonamnestic MCI; SD, standard deviation.
Data are presented as mean age (±standard deviation) and number (percentage) of study participants.
Significant P values are presented in bold.
Get Radiology Tree app to read full this article<
Get Radiology Tree app to read full this article<
White Matter Hyperintensities
Get Radiology Tree app to read full this article<
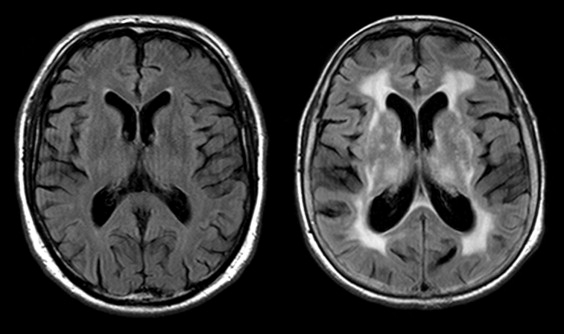
Table 2
Periventricular WMHs in MCI Subjects (Total and Stratified by Subgroups) and Matched Controls Subdivided in 3 Periventricular Regions and 4 Size Classes
Periventricular WMHs MCI Total ( n = 126) Controls ( n = 126)P Value Amnestic MCI ( n = 93) Nonamnestic MCI ( n = 33)P Value, aMCI Versus naMCI
(Adj.)P Value, aMCI Versus Controls_P_ Value, naMCI Versus Controls Frontal None/pencil thin 95 (75) 95 (75) 70 (76) 25 (76) Smooth halo 27 (22) 26 (21) 19 (20) 8 (24) Confluent 4 (3) 5 (4) .97 4 (4) 0 (0) .20 .99 .68 Lateral None/pencil thin 91 (72) 96 (76) 65 (70) 26 (79) Smooth halo 31 (25) 28 (22) 24 (26) 7 (21) Confluent 4 (3) 2 (2) .74 4 (4) 0 (0) .29 .81 .72 Occipital None/pencil thin 24 (19) 28 (22) 20 (22) 4 (12) Smooth halo 17 (14) 9 (7) 14 (15) 3 (9) Confluent 13 (10) 4 (3).02 11 (12) 2 (6) .55.01 .90
Adj, age adjusted; aMCI, amnestic MCI; MCI, mild cognitive impairment; naMCI, nonamnestic MCI; WMH, white matter hyperintensity.
Data are presented as number of study participants (percentage). Significant P values are presented in bold.
Get Radiology Tree app to read full this article<
Get Radiology Tree app to read full this article<
Cortical and Subcortical Brain Atrophy
Get Radiology Tree app to read full this article<
Table 3
Brain Atrophy on Axial FLAIR Images Estimated on a Four-Point Scale
Brain Atrophy Estimation MCI Total ( n = 126) Matched Controls ( n = 126)P Value Amnestic MCI ( n = 93) Nonamnestic MCI ( n = 33)P Value, aMCI Versus naMCI (Adj.)P Value, aMCI Versus Controls_P_ Value, naMCI Versus Controls None 46 (36) 59 (47) 27 (29) 19 (58) Low 39 (31) 43 (34) 32 (34) 7 (21) Moderate 30 (24) 22 (17) 25 (27) 5 (15) Severe 11 (9) 2 (2).01 9 (10) 2 (6) .79.03 .33
Adj, age adjusted; aMCI, amnestic MCI; FLAIR, fluid-attenuated inversion recovery; MCI, mild cognitive impairment; naMCI, nonamnestic MCI.
Data are presented as number (percentage) of study participants. Significant P values are presented in bold.
Get Radiology Tree app to read full this article<
Get Radiology Tree app to read full this article<
Table 4
Ventricle and Brain Diameter, Ventricle-to-Brain Ratio at Three Levels, and rWTH to Assess Subcortical Brain Atrophy in aMCI, naMCI, and Matched Controls
Subcortical Brain Atrophy, mm, Mean ± SD MCI Total ( n = 126) Matched Controls ( n = 126)P Value Amnestic MCI ( n = 93) Nonamnestic MCI ( n = 33)P Value, aMCI Versus naMCI (Adj.)P Value, aMCI Versus Controls_P_ Value, naMCI Versus Controls Frontal horn level Ventricle 36.35 ± 5.71 37.98 ± 7.49.03 37.26 ± 4.89 33.79 ± 7.04.03 .17.04 Brain 106.07 ± 10.56 107.53 ± 8.20 .19 107.38 ± 4.34 102.39 ± 19.04.01 .74 .09 Ventricle/brain ratio 0.34 ± 0.05 0.37 ± 0.23 .09 0.35 ± 0.04 0.32 ± 0.07 .11 .23 .07 Occipital horn level Ventricle 61.32 ± 8.35 63.41 ± 6.18.02 62.54 ± 6.41 57.88 ± 11.74.01 .20.02 Brain 125.88 ± 12.78 128.36 ± 6.09.02 127.20 ± 5.72 122.15 ± 22.90.01 .14 .07 Ventricle/brain ratio 0.48 ± 0.06 0.49 ± 0.04 .07 0.49 ± 0.05 0.46 ± 0.09.049 .53.04 Caudate nuclei level Ventricle 18.38 ± 4.57 17.83 ± 3.82 .24 19.16 ± 4.34 16.18 ± 4.54 .09 .14 .88 Brain 109.79 ± 6.59 112.51 ± 6.42.0001 109.81 ± 6.67 109.76 ± 6.43 .33<.0001 .64 Ventricle/brain ratio 0.17 ± 0.04 0.16 ± 0.03.01 0.17 ± 0.04 0.15 ± 0.03 .30.01 .64 rWTH Right 4.33 ± 1.72 3.75 ± 1.20.004 4.44 ± 1.88 4.01 ± 1.10 .56.01 .30 Left 4.18 ± 1.73 3.60 ± 1.25.005 4.33 ± 1.90 3.76 ± 1.14 .85.01 .17
Adj, age adjusted; aMCI, amnestic MCI; MCI, mild cognitive impairment; naMCI, nonamnestic MCI; rWTH, radial width of the temporal horn; SD, standard deviation.
Data are presented as mean values in millimeter (±standard deviation). Significant P values are presented in bold.
Get Radiology Tree app to read full this article<
Get Radiology Tree app to read full this article<
Get Radiology Tree app to read full this article<
Cerebral Microbleeds
Get Radiology Tree app to read full this article<
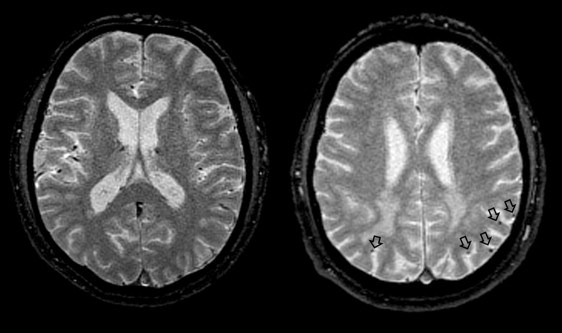
Table 5
Cerebral Microbleeds in MCI Subjects and Matched Controls and Stratified for the MCI Subgroups
Cerebral Microbleeds n (%) MCI n = 108 Controls n = 125P Value, MCI Versus Controls aMCI n = 83 naMCI n = 24P Value, aMCI Versus naMCI Cortex Frontal 3 (3) 5 (4) .71 2 (2) 1 (4) .77 Parietal 6 (6) 6 (5) .76 6 (7) 0 (0).41 Temporal 3 (3) 2 (2) .66 3 (4) 0 (0).65 Occipital 1 (1) 3 (2) .34 1 (1) 0 (0)>.99 White matter Frontal 3 (3) 5 (4) .48 3 (4) 0 (0)>.99 Parietal 2 (2) 3 (2) .66 2 (3) 0 (0)>.99 Temporal 4 (4) 2 (2) .42 3 (4) 1 (4).38 Occipital 2 (2) 1 (1) .57 2 (2) 0 (0).69 Basal ganglia 7 (6) 3 (2) .22 6 (7) 1 (4).23 Thalamus 3 (3) 1 (1) .34 3 (4) 0 (0).42 Brainstem 3 (3) 0 (0) .99 3 (4) 0 (0).12 Cerebellum 4 (4) 9 (7) .37 3 (4) 1 (4).65
aMCI, amnestic MCI; MCI, mild cognitive impairment; naMCI, nonamnestic MCI.
Data are presented as number of microbleeds (percentage). Significant P values are presented in bold. No T2*-weighted images were available in 18 MCI (9 aMCI/9 naMCI) subjects and in 2 control subjects.
Get Radiology Tree app to read full this article<
Discussion
Get Radiology Tree app to read full this article<
Get Radiology Tree app to read full this article<
Get Radiology Tree app to read full this article<
Get Radiology Tree app to read full this article<
Get Radiology Tree app to read full this article<
Limitations
Get Radiology Tree app to read full this article<
Conclusions
Get Radiology Tree app to read full this article<
Acknowledgments
Get Radiology Tree app to read full this article<
References
1. Petersen R.C., Smith G.E., Waring S.C., et. al.: Mild cognitive impairment: clinical characterization and outcome. Arch Neurol 1999; 56: pp. 303-308.
2. Winblad B., Palmer K., Kivipelto M., et. al.: Mild cognitive impairment–beyond controversies, towards a consensus: report of the International Working Group on Mild Cognitive Impairment. J Intern Med 2004; 256: pp. 240-246.
3. Petersen R.C.: Mild cognitive impairment as a diagnostic entity. J Intern Med 2004; 256: pp. 183-194.
4. Petersen R.C., Doody R., Kurz A., et. al.: Current concepts in mild cognitive impairment. Arch Neurol 2001; 58: pp. 1985-1992.
5. He J., Farias S., Martinez O., et. al.: Differences in brain volume, hippocampal volume, cerebrovascular risk factors, and apolipoprotein E4 among mild cognitive impairment subtypes. Arch Neurol 2009; 66: pp. 1393-1399.
6. Albert M.S., DeKosky S.T., Dickson D., et. al.: The diagnosis of mild cognitive impairment due to Alzheimer’s disease: recommendations from the National Institute on Aging-Alzheimer’s Association workgroups on diagnostic guidelines for Alzheimer’s disease. Alzheimers Dement 2011; 7: pp. 270-279.
7. Heister D., Brewer J.B., Magda S., et. al.: Predicting MCI outcome with clinically available MRI and CSF biomarkers. Neurology 2011; 77: pp. 1619-1628.
8. Lin A.L., Laird A.R., Fox P.T., et. al.: Multimodal MRI neuroimaging biomarkers for cognitive normal adults, amnestic mild cognitive impairment, and Alzheimer’s disease. Neurol Res Int 2012; 2012: pp. 907409.
9. Schneider J.A.: Brain microbleeds and cognitive function. Stroke 2007; 38: pp. 1730-1731.
10. Brundel M., Heringa S.M., de Bresser J., et. al.: High prevalence of cerebral microbleeds at 7Tesla MRI in patients with early Alzheimer’s Disease. J Alzheimers Dis 2012;
11. Ayaz M., Boikov A.S., Haacke E.M., et. al.: Imaging cerebral microbleeds using susceptibility weighted imaging: one step toward detecting vascular dementia. J Magn Reson Imaging 2010; 31: pp. 142-148.
12. Cordonnier C., van der Flier W.M., Sluimer J.D., et. al.: Prevalence and severity of microbleeds in a memory clinic setting. Neurology 2006; 66: pp. 1356-1360.
13. Kirsch W., McAuley G., Holshouser B., et. al.: Serial susceptibility weighted MRI measures brain iron and microbleeds in dementia. J Alzheimers Dis 2009; 17: pp. 599-609.
14. Korf E.S., Wahlund L.O., Visser P.J., et. al.: Medial temporal lobe atrophy on MRI predicts dementia in patients with mild cognitive impairment. Neurology 2004; 63: pp. 94-100.
15. Chupin M., Gerardin E., Cuingnet R., et. al.: Fully automatic hippocampus segmentation and classification in Alzheimer’s disease and mild cognitive impairment applied on data from ADNI. Hippocampus 2009; 19: pp. 579-587.
16. Laakso M.P., Soininen H., Partanen K., et. al.: Volumes of hippocampus, amygdala and frontal lobes in the MRI-based diagnosis of early Alzheimer’s disease: correlation with memory functions. J Neural Transm Park Dis Dement Sect 1995; 9: pp. 73-86.
17. Schmermund A., Mohlenkamp S., Stang A., et. al.: Assessment of clinically silent atherosclerotic disease and established and novel risk factors for predicting myocardial infarction and cardiac death in healthy middle-aged subjects: rationale and design of the Heinz Nixdorf RECALL Study. Risk Factors, Evaluation of Coronary Calcium and Lifestyle. Am Heart J 2002; 144: pp. 212-218.
18. Dlugaj M., Weimar C., Wege N., et. al.: Prevalence of mild cognitive impairment and its subtypes in the Heinz Nixdorf Recall study cohort. Dement Geriatr Cogn Disord 2010; 30: pp. 362-373.
19. UNESCO: International standard classification of education (ISCED).1997.
20. de Groot J.C., de Leeuw F.E., Oudkerk M., et. al.: Cerebral white matter lesions and cognitive function: the Rotterdam Scan Study. Ann Neurol 2000; 47: pp. 145-151.
21. Mantyla R., Erkinjuntti T., Salonen O., et. al.: Variable agreement between visual rating scales for white matter hyperintensities on MRI. Comparison of 13 rating scales in a poststroke cohort. Stroke 1997; 28: pp. 1614-1623.
22. Frisoni G.B., Geroldi C., Beltramello A., et. al.: Radial width of the temporal horn: a sensitive measure in Alzheimer disease. AJNR Am J Neuroradiol 2002; 23: pp. 35-47.
23. Duara R., Loewenstein D.A., Potter E., et. al.: Medial temporal lobe atrophy on MRI scans and the diagnosis of Alzheimer disease. Neurology 2008; 71: pp. 1986-1992.
24. Aksu Y., Miller D.J., Kesidis G., et. al.: An MRI-derived definition of MCI-to-AD conversion for long-term, automatic prognosis of MCI patients. PLoS One 2011; 6: pp. e25074.
25. Spulber G., Niskanen E., MacDonald S., et. al.: Whole brain atrophy rate predicts progression from MCI to Alzheimer’s disease. Neurobiol Aging 2010; 31: pp. 1601-1605.
26. Wolz R., Julkunen V., Koikkalainen J., et. al.: Multi-method analysis of MRI images in early diagnostics of Alzheimer’s Disease. PLoS One 2011; 6: pp. e25446.
27. Appel J., Potter E., Bhatia N., et. al.: Association of white matter hyperintensity measurements on brain MR imaging with cognitive status, medial temporal atrophy, and cardiovascular risk factors. AJNR Am J Neuroradiol 2009; 30: pp. 1870-1876.
28. Du A.T., Schuff N., Chao L.L., et. al.: White matter lesions are associated with cortical atrophy more than entorhinal and hippocampal atrophy. Neurobiol Aging 2005; 26: pp. 553-559.
29. Silbert L.C., Dodge H.H., Perkins L.G., et. al.: Trajectory of white matter hyperintensity burden preceding mild cognitive impairment. Neurology 2012; 79: pp. 741-747.
30. Jacobs H.I., Visser P.J., Van Boxtel M.P., et. al.: Association between white matter hyperintensities and executive decline in mild cognitive impairment is network dependent. Neurobiol Aging 2012; 33: pp. 201. e1-8
31. Mortamais M., Reynes C., Brickman A.M., et. al.: Spatial distribution of cerebral white matter lesions predicts progression to mild cognitive impairment and dementia. PLoS One 2013; 8: pp. e56972.
32. Okonkwo O.C., Alosco M.L., Jerskey B.A., et. al.: Cerebral atrophy, apolipoprotein E varepsilon4, and rate of decline in everyday function among patients with amnestic mild cognitive impairment. Alzheimers Dement 2010; 6: pp. 404-411.
33. Misra C., Fan Y., Davatzikos C.: Baseline and longitudinal patterns of brain atrophy in MCI patients, and their use in prediction of short-term conversion to AD: results from ADNI. Neuroimage 2009; 44: pp. 1415-1422.
34. Leow A.D., Yanovsky I., Parikshak N., et. al.: Alzheimer’s disease neuroimaging initiative: a one-year follow up study using tensor-based morphometry correlating degenerative rates, biomarkers and cognition. Neuroimage 2009; 45: pp. 645-655.
35. Tapiola T., Pennanen C., Tapiola M., et. al.: MRI of hippocampus and entorhinal cortex in mild cognitive impairment: a follow-up study. Neurobiol Aging 2008; 29: pp. 31-38.
36. Eckerstrom C., Andreasson U., Olsson E., et. al.: Combination of hippocampal volume and cerebrospinal fluid biomarkers improves predictive value in mild cognitive impairment. Dement Geriatr Cogn Disord 2010; 29: pp. 294-300.
37. Mueller S.G., Schuff N., Yaffe K., et. al.: Hippocampal atrophy patterns in mild cognitive impairment and Alzheimer’s disease. Hum Brain Mapp 2010; 31: pp. 1339-1347.
38. Gao F.Q., Black S.E., Leibovitch F.S., et. al.: Linear width of the medial temporal lobe can discriminate Alzheimer’s disease from normal aging: the Sunnybrook dementia study. Neurobiol Aging 2004; 25: pp. 441-448.
39. Uotani C., Sugimori K., Kobayashi K.: Association of minimal thickness of the medial temporal lobe with hippocampal volume, maximal and minimal hippocampal length: volumetric approach with horizontal magnetic resonance imaging scans for evaluation of a diagnostic marker for neuroimaging of Alzheimer’s disease. Psychiatry Clin Neurosci 2006; 60: pp. 319-326.
40. Gabryelewicz T., Pawlowska-Detko A., Misko J., et. al.: Prediction of deterioration of mild cognitive impairment with CT and SPECT. Med Sci Monit 2007; 13: pp. 31-37.
41. Prins N.D., van Dijk E.J., den Heijer T., et. al.: Cerebral white matter lesions and the risk of dementia. Arch Neurol 2004; 61: pp. 1531-1534.
42. Boutet C., Chupin M., Colliot O., et. al.: Is radiological evaluation as good as computer-based volumetry to assess hippocampal atrophy in Alzheimer’s disease?. Neuroradiology 2012; 54: pp. 1321-1330.
43. Eckerstrom C., Olsson E., Bjerke M., et. al.: A combination of neuropsychological, neuroimaging, and cerebrospinal fluid markers predicts conversion from mild cognitive impairment to dementia. J Alzheimers Dis 2013; 36: pp. 421-431.