
Rationale and Objectives
The purpose of this ex vivo study was to investigate artifacts in a cone-beam breast computed tomography (CBBCT) caused by breast tissue markers.
Materials and Methods
Breast phantoms with self-made tissue pork mincemeat were created. Twenty-nine different, commercially available markers with varying marker size, composition, and shape were evaluated. A dedicated CBBCT evaluation of all phantoms was performed with 49 kVp, 50 and 100 mA, and marker orientation parallel and orthogonal to the scan direction. The resultant images were evaluated in sagittal, axial, and coronal view with a slice thickness of 0.5 mm. Additionally, measurements of all markers in the same directions were done with full-field digital mammography.
Results
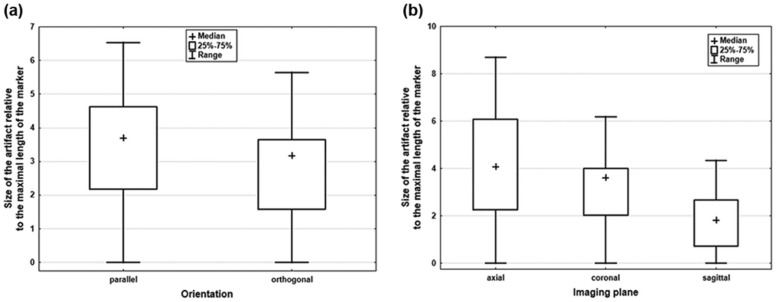
All markers were visible in full-field digital mammography without any artifacts. However, all markers caused artifacts on a CBBCT. Artifacts were measured as the length of the resulting streakings. Median length of artifacts was 7.2 mm with a wide range from 0 to 48.3 mm (interquartile range 4.3–11.4 mm) dependent on composition, size, shape, weight, and orientation of the markers. The largest artifacts occurred in axial view with a median size of 12.6 mm, with a range from 0 to 48.3 mm, resulting in a relative artifact length (quotient artifact in mm/real physical length of the marker itself) of 4.1 (interquartile range 2.3–6.1, range 0–8.7).
Conclusions
Artifacts caused by markers can significantly influence image quality in a CBBCT, thus limiting primary diagnostics and follow-up in breast cancer. The size of the artifacts depends on the marker characteristics, orientation, and the image plane of reconstruction.
Introduction
The dedicated cone-beam breast computed tomography (CBBCT) designed by Koning Corporation (West Henrietta, NY) is the first commercially available breast CT scanner. First studies reported that CBBCT can significantly improve the detection of breast masses and microcalcifications . This is owing to its high spatial and contrast resolution, and the potential of reconstruction of three-dimensional (3D) information from a series of two-dimensional images .
The CBBCT system is a new and promising diagnostic technique for breast imaging and CT-guided interventions. The CT-guided system is an add-on device for the diagnostic CBBCT. All lesions requiring an image-guided biopsy not visible on magnetic resonance imaging (MRI) or ultrasonography can be biopsied under CT guidance instead of stereotactic biopsy.
Get Radiology Tree app to read full this article<
Get Radiology Tree app to read full this article<
Get Radiology Tree app to read full this article<
Materials and Methods
Breast Tissue Markers and Breast Phantom
Get Radiology Tree app to read full this article<
Get Radiology Tree app to read full this article<
Get Radiology Tree app to read full this article<
Get Radiology Tree app to read full this article<
Assessment of Samples
Get Radiology Tree app to read full this article<
Get Radiology Tree app to read full this article<
Get Radiology Tree app to read full this article<
Get Radiology Tree app to read full this article<
Assessment of Artifacts
Get Radiology Tree app to read full this article<
Get Radiology Tree app to read full this article<
Get Radiology Tree app to read full this article<
Statistical Analysis
Get Radiology Tree app to read full this article<
Results
Study Collective
Get Radiology Tree app to read full this article<
Get Radiology Tree app to read full this article<
Effect of Marker Composition
Get Radiology Tree app to read full this article<
TABLE 1
Detail Information of the Manufacturers of the Different Breast Tissue Markers
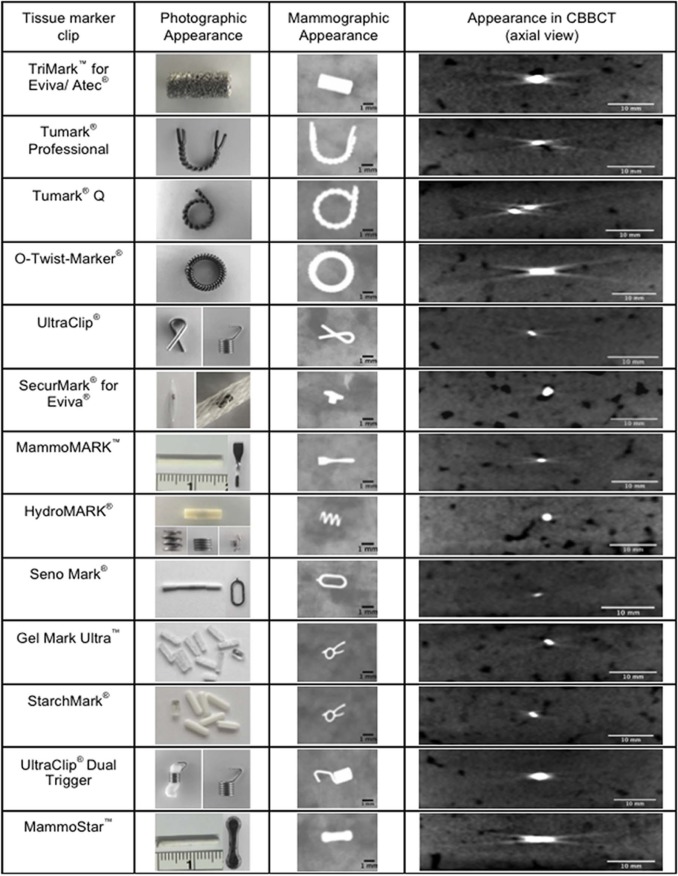
Marker Group Size Distributing Company Bioresorbable Embedding Material Material Composition Shape Metallic marker TriMark for Eviva/ATEC 9G Hologic — Titanium Cork Tumark Professional 18G Somatex — Nitinol “U” shaped Tumark Q 18G Somatex — Nitinol “Q” shaped O-Twist-Marker 18G BIP — Nitinol Ring UltraClip 17G Bard — Titanium
BioDur 108
(nickel free) Ribbon
Coil Combined (metallic marker with non-metallic coating) SecurMark for Eviva 9G Hologic Glycoprene suture-like netting Titanium Top hat
Mini cork MammoMARK 8G Mammotome Bioresorbable collagen pad Titanium Bowtie 10G 11G 14G HydroMARK 8G Mammotome PEG based hydrogel pellets Stainless steel and titanium Open coil
Butterfly
Barrel 9G 11G 12G 13G 15G SenoMark 11G Bard 3 PGA pads Titanium
316L stainless steel “O” shaped
M-form 14G Gel Mark Ultra 11G Bard 10 PLA/PGA pellets and one radiopaque marker 316L stainless steel Omega StarchMark 10G Bard 6 polysaccharide pellets and 1 PLA/PGA with radiopaque marker 316L stainless steel Omega UltraClip Dual Trigger 17G Bard non-absorbable polyvinyl acetate polymer BioDur 108 (nickel free) Coil Non-metallic marker MammoSTAR 10G Mammotome Beta glucan Carbon-coated zirconium oxide Barbell 11G 14G
PEG, polyethylenglycol; PGA, polyglycolic acid; PLA, polylactic acid.
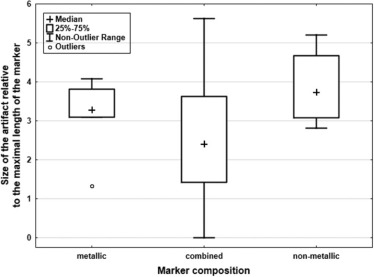
The markers were divided into metallic markers, combined markers, and non-metallic markers.
Get Radiology Tree app to read full this article<
Get Radiology Tree app to read full this article<
Get Radiology Tree app to read full this article<
Effect of Marker Orientation and Dosage
Get Radiology Tree app to read full this article<
Get Radiology Tree app to read full this article<
Get Radiology Tree app to read full this article<
TABLE 2
Comparative Analysis of the Different Artifact Sizes Relative to the Length of All the Breast Tissue Markers in the Imaging Planes (Axial, Coronal, and Sagittal) and the Marker Orientation (Orthogonal and Parallel)
Imaging Planes Marker Orientation Artifact Size (mm) Median IQR Range_P_ Value Axial Orthogonal 5.1 2.9–8.6 0–8.7 <.01 Parallel 3.4 1.8–4.7 0–6.2 Coronal Orthogonal 4.0 2.6–4.6 0–6.6 .03 Parallel 3.2 2.0–4.0 0–5.8 Sagittal Orthogonal 2.0 0.9–3.1 0–4.4 .01 Parallel 1.6 0–2.2 0–4.5
IQR, interquartile range.
Get Radiology Tree app to read full this article<
Get Radiology Tree app to read full this article<
Get Radiology Tree app to read full this article<
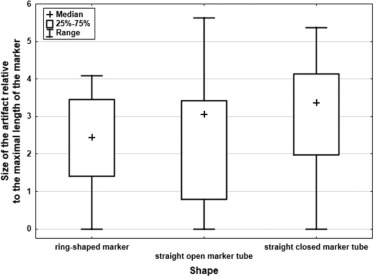
Effect of Marker Size, Shape, and Weight
Get Radiology Tree app to read full this article<
Get Radiology Tree app to read full this article<
Get Radiology Tree app to read full this article<
Get Radiology Tree app to read full this article<
Get Radiology Tree app to read full this article<
Discussion
Get Radiology Tree app to read full this article<
Get Radiology Tree app to read full this article<
Get Radiology Tree app to read full this article<
Get Radiology Tree app to read full this article<
Get Radiology Tree app to read full this article<
Get Radiology Tree app to read full this article<
Get Radiology Tree app to read full this article<
Acknowledgment
Get Radiology Tree app to read full this article<
References
1. O’Connell A.M., Kawakyu-O’Connor D.: Dedicated cone-beam breast computed tomography and diagnostic mammography: comparison of radiation dose, patient comfort, and qualitative review of imaging findings in BI-RADS 4 and 5 lesions. J Clin Imaging Sci 2012; 2:
2. O’Connell A., Conover D.L., Zhang Y., et. al.: Cone-beam CT for breast imaging: radiation dose, breast coverage, and image quality. AJR Am J Roentgenol 2010; 195: pp. 496-509.
3. He N., Wu Y.P., Kong Y., et. al.: The utility of breast cone-beam computed tomography, ultrasound, and digital mammography for detecting malignant breast tumors: a prospective study with 212 patients. Eur J Radiol 2016; 85: pp. 392-403.
4. Seifert P., Conover D., Zhang Y., et. al.: Evaluation of malignant breast lesions in the diagnostic setting with cone beam breast computed tomography (Breast CT): feasibility study. Breast J 2014; 20: pp. 364-374.
5. Prionas N.D., Lindfors K.K., Ray S., et. al.: Contrast-enhanced dedicated breast CT: initial clinical experience. Radiology 2010; 256: pp. 714-723.
6. Aminololama-Shakeri S., Abbey C.K., Gazi P., et. al.: Differentiation of ductal carcinoma in-situ from benign micro-calcifications by dedicated breast computed tomography. Eur J Radiol 2016; 85: pp. 297-303.
7. Zhao B., Zhang X., Cai W., et. al.: Cone beam breast CT with multiplanar and three dimensional visualization in differentiating breast masses compared with mammography. Eur J Radiol 2015; 84: pp. 48-53.
8. Lindfors K.K., Boone J.M., Nelson T.R., et. al.: Dedicated breast CT: initial clinical experience. Radiology 2008; 246: pp. 725-733.
9. Lindfors K.K., Boone J.M., Newell M.S., et. al.: Dedicated breast computed tomography: the optimal cross-sectional imaging solution?. Radiol Clin North Am 2010; 48: pp. 1043-1054.
10. McBain C.A., Henry A.M., Sykes J., et. al.: X-ray volumetric imaging in image-guided radiotherapy: the new standard in on-treatment imaging. Int J Radiat Oncol Biol Phys 2006; 64: pp. 625-634.
11. Oelfke U., Tucking T., Nill S., et. al.: Linac-integrated kV-cone beam CT: technical features and first applications. Med Dosim 2006; 31: pp. 62-70.
12. Oldham M., Letourneau D., Watt L., et. al.: Cone-beam-CT guided radiation therapy: a model for on-line application. Radiother Oncol 2005; 75: pp. 271-278.
13. Joseph P.M., Ruth C.: A method for simultaneous correction of spectrum hardening artifacts in CT images containing both bone and iodine. Med Phys 1997; 24: pp. 1629-1634.
14. Kalender W.A., Hebel R., Ebersberger J.: Reduction of CT artifacts caused by metallic implants. Radiology 1987; 164: pp. 576-577.
15. Burbank F., Forcier N.: Tissue marking clip for stereotactic breast biopsy: initial placement accuracy, long-term stability, and usefulness as a guide for wire localization. Radiology 1997; 205: pp. 407-415.
16. Liberman L., Dershaw D.D., Morris E.A., et. al.: Clip placement after stereotactic vacuum-assisted breast biopsy. Radiology 1997; 205: pp. 417-422.
17. Schulze R., Heil U., Gross D., et. al.: Artefacts in CBCT: a review. Dentomaxillofac Radiol 2011; 40: pp. 265-273.
18. Genson C.C., Blane C.E., Helvie M.A., et. al.: Effects on breast MRI of artifacts caused by metallic tissue marker clips. AJR Am J Roentgenol 2007; 188: pp. 372-376.
19. Bendel L.P., Shellock F.G., Steckel M.: The effect of mechanical deformation on magnetic properties and MRI artifacts of type 304 and type 316L stainless steel. J Magn Reson Imaging 1997; 7: pp. 1170-1173.
20. Shellock F.G., Kanal E.: Aneurysm clips: evaluation of MR imaging artifacts at 1.5 T. Radiology 1998; 209: pp. 563-566.
21. Ghate S.V., Baker J.A., Hawkins A.D., et. al.: Titanium vs carbon coated ceramic breast tissue marker clips: 3T MR susceptibility artifact and local signal disturbance. Acad Radiol 2011; 18: pp. 770-773.
22. Bechara B., McMahan C.A., Geha H., et. al.: Evaluation of a cone beam CT artefact reduction algorithm. Dentomaxillofac Radiol 2012; 41: pp. 422-428.
23. Bechara B.B., Moore W.S., McMahan C.A., et. al.: Metal artefact reduction with cone beam CT: an in vitro study. Dentomaxillofac Radiol 2012; 41: pp. 248-253.
24. Stidd D.A., Theessen H., Deng Y., et. al.: Evaluation of a metal artifacts reduction algorithm applied to postinterventional flat panel detector CT imaging. AJNR Am J Neuroradiol 2014; 35: pp. 2164-2169.
25. Zhang Y., Zhang L., Zhu X.R., et. al.: Reducing metal artifacts in cone-beam CT images by preprocessing projection data. Int J Radiat Oncol Biol Phys 2007; 67: pp. 924-932.