
Rationale and Objectives
To define systematic volumetric thresholds to identify and grade splenomegaly and retrospectively evaluate the performance of radiologists to assess splenomegaly in computed tomography (CT) image data.
Materials and Methods
A clinical tool was developed to segment spleens from 172 contrast-enhanced clinical CT studies. There were 45 normal and 127 splenomegaly cases confirmed by radiological reports. Spleen volumes were compared to manual measurements using overlap/error. Volumetric thresholds for mild/massive splenomegaly were defined at 1/2.5 standard deviations above the average splenic volume of the healthy population. The thresholds were validated against consensus reports. The performance of radiologists in assessing splenomegaly was retrospectively evaluated.
Results
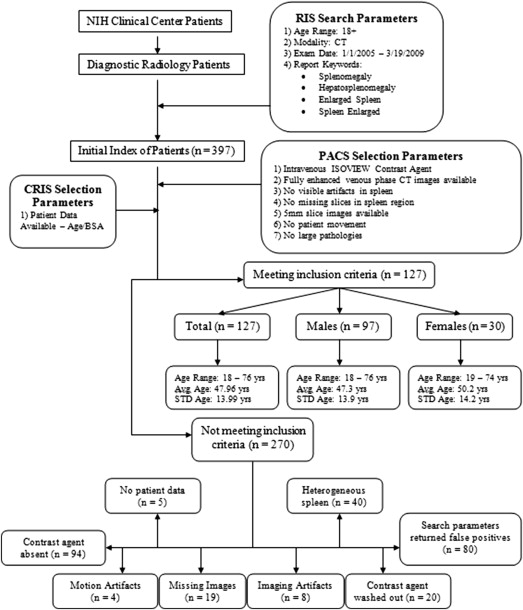
The automated segmentation of spleens was robust with volume overlap/error of 95.2/3.3%. There were no significant differences ( P > .2) between manual and automated segmentations for either normal/splenomegaly subgroups. Comparable correlations between interobserver and manual-automated measurements were found ( r = 0.99 for all). The average volume of normal spleens was 236.89 ± 77.58 mL. For splenomegaly, average volume was 1004.75 ± 644.27 mL. Volumetric thresholds of 314.47/430.84 mL were used to define mild/massive splenomegaly (±18.86 mL, 95% CI). Radiologists disagreed in 23.25% ( n = 40) of the diagnosed cases. The area under the receiver operating characteristic curve of the volumetric criterion for splenomegaly detection was 0.96. Using the volumetric thresholds as the reference standard, the sensitivity of radiologists in detecting all/mild/massive splenomegaly was 95.0/66.6/99.0% at 78.0% specificity, respectively.
Conclusion
Thresholds for the identification and grading of splenomegaly from automatic volumetric spleen assessment were introduced. The volumetric thresholds match well with clinical interpretations for splenomegaly and may improve splenomegaly detection compared with splenic cephalocaudal height measurements or visual inspection commonly used in current clinical practice.
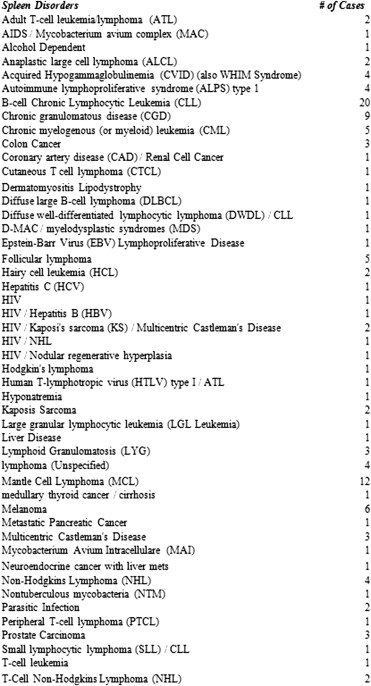
The enlargement of the spleen, or splenomegaly, is the most common condition associated with diseases of the spleen . Splenomegaly is a nonspecific finding that is diagnostically challenging to assess because the manifestation is nearly always secondary to another primary disorder, and diseases associated with the spleen are numerous . Pozo et al grouped them into six categories: infection, hematological, congestive, inflammatory, neoplastic, and infiltrative miscellaneous diseases . Hematological disorders were found to be the most common (up to 66%), with lymphoma being the most prevalent disease within the category.
The assessment of spleen size, defined by its volume, is of importance in the diagnosis of and determination of the severity of many of these diseases and in the selection and monitoring of therapies. Moreover, given the spleen’s irregular shape, volume is the best summary indicator of spleen changes over time. It is common clinical practice for physicians to estimate splenic size and assess for an enlarged spleen using palpation . In palpation, the spleen is considered normal in size when it is not palpable below the left costal edge ; if the spleen is palpable, it is enlarged. But 16% of palpable spleens were found to be of normal size on radiological assessments .
Get Radiology Tree app to read full this article<
Get Radiology Tree app to read full this article<
Get Radiology Tree app to read full this article<
Materials and methods
Study Patients
Get Radiology Tree app to read full this article<
Get Radiology Tree app to read full this article<
Get Radiology Tree app to read full this article<
Get Radiology Tree app to read full this article<
Get Radiology Tree app to read full this article<
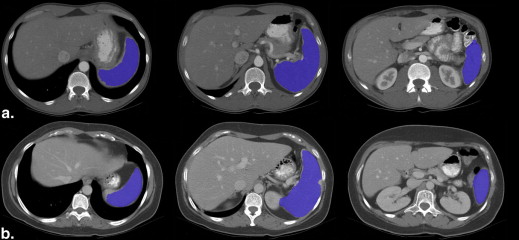
Segmentation
Get Radiology Tree app to read full this article<
Definition of Splenomegaly and Volumetric Thresholds
Get Radiology Tree app to read full this article<
Get Radiology Tree app to read full this article<
Performance of Radiologists Relative to the Splenomegaly Thresholds
Get Radiology Tree app to read full this article<
Statistical Analysis
Get Radiology Tree app to read full this article<
Get Radiology Tree app to read full this article<
Get Radiology Tree app to read full this article<
Results
Automatic Segmentation
Get Radiology Tree app to read full this article<
Get Radiology Tree app to read full this article<
![Figure 1, Bland-Altman height agreement plots between (a) two observers, (b) automated method (computer-aided diagnosis [CAD]) and observer 1, (c) CAD and observer 2. The mean error is shown in solid line and the 95% limits of agreement (±1.96 standard deviation [SD]) in dashed lines.](https://storage.googleapis.com/dl.dentistrykey.com/clinical/AssessingSplenomegaly/0_1s20S1076633213000330.jpg)
Get Radiology Tree app to read full this article<
Consensus Report
Get Radiology Tree app to read full this article<
Table 1
Average Spleen Volumes and Heights
Cases Mean ± SD Normal volume: n = 44 236.89 ± 77.58 mL Normal volume/BSA: n = 44 124.75 ± 39.66 mL Normal height: n = 44 9.20 ± 1.46 cm Enlarged volume: n = 88 1004.75 ± 644.27 mL Enlarged volume/BSA: n = 88 526.53 ± 320.84 mL Enlarged height: n = 88 17.31 ± 3.5 cm
BSA, body surface area.
Average volumes and cephalocaudal heights for normal and enlarged spleens. BSA was used a normalization factor.
Get Radiology Tree app to read full this article<
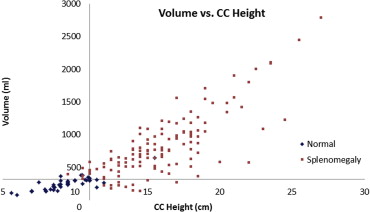
Relationships between Splenic Volume and Patient Size
Get Radiology Tree app to read full this article<
Table 2
Correlation between Spleen Size and Patient’s BSA/Age
Cases/Correlations Factor Correlation ( P Value) Normal volume: n = 44/patient BSA 0.28 (.02) Normal volume: n = 44/patient age 0.00 (.99) Enlarged volume: n = 88/patient BSA 0.32 (.002) Enlarged volume: n = 88/patient age 0.10 (.32) Normal CC height: n = 44/patient BSA 0.35 (.004) Normal CC height: n = 44/patient age −0.14 (.26) Enlarged CC height: n = 88/patient BSA 0.27 (.008) Enlarged CC height: n = 88/patient age 0.01 (.90)
BSA, the body surface area; CC, cephalocaudal.
Correlation coefficients ( r ) and associated P values are presented between volumes/CC height measurements and patient’s BSA and age or normal and enlarged spleens.
Get Radiology Tree app to read full this article<
Volumetric Thresholds for Splenomegaly
Get Radiology Tree app to read full this article<
Performance of Radiologists to Detect Splenomegaly
Get Radiology Tree app to read full this article<
Table 3
Receiver Operating Characteristic Curve Analysis
Criterion ( n = 172) Sensitivity/Specificity Mild Splenomegaly ( n = 15) Massive Splenomegaly ( n = 107) All Splenomegaly ( n = 122) Radiologists 66.66 ∗ /78.00 99.06/78.00 95.08 ∗ /78.00 CC height ≥11 cm 53.33/68.00 99.06/68.00 93.44/68.00 CC height ≥12 cm 33.33/76.00 96.26/76.00 88.52/76.00
CC, cephalocaudal.
Sensitivity and specificity of radiologists and CC height criteria to detect splenomegaly were computed using the volumetric thresholds for splenomegaly as reference standard. CC height ≥11/12 cm refers to a threshold of 11/12 cm in CC height to detect splenomegaly.
Get Radiology Tree app to read full this article<
Table 4
Previous Reports on Spleen Size
Reference Type of Data Gender Number of Cases Mean/Maximum Volume (mL) Mean/Maximum Height (cm) Imaging Modality Kaneko et al Normal M 80 119 ± 40/— — CT Spielmann et al Normal M 82 — 11/— US Chowdhury et al Normal M 87 75.2 ± 3.7/200 — Cadaver Kaneko et al. Normal F 70 108 ± 39/- — CT Spielmann et al Normal F 47 — 10/— US Chowdhury et al Normal F 33 60.5 ± 4.9/150 — Cadaver Henderson et al Normal M/F 11 219 ± 76/— — CT Schulz et al Normal M/F 38 169/— 11.1/— CT Prassopoulos et al Normal M/F 140 214.6/314.5 — CT Bezerra et al Normal M/F 249 — —/9.76 CT O’Reilly et al Normal M/F 170 — —/12 CT Srisajjakul et al Normal M/F 426 124.1 ± 51.8/430.8 8.5 ± 1.4/13.9 CT Mazonakis et al Normal M/F 16 204.8/289.8 — MRI Frank et al Normal M/F 793 — —/11 (95%) US Picardi et al Normal M/F 10 240/380 10/11.5 US Hoefs et al Normal M/F 11 201 ± 77/335 — SPECT Larson et al Normal M/F 26 — 10 ± 1.5/12.9 Photoscan Henderson et al Diseased M/F 12 660 ± 336/— — CT Filicori et al Diseased M/F 88 1124.6 ± 1200.1/— — CT Hammon et al Diseased M/F 15 268.2 ± 114.6/— — CT Zhang et al. Diseased M/F 14 1716/3585 — US Picardi et al Posttreatment M/F 13 470/1200 — US
CT, computed tomography; F, female; M, male; MRI, magnetic resonance imaging; SPECT, single photon emission CT; US, ultrasound.
Get Radiology Tree app to read full this article<
Relationship between Splenic Volume and Height
Get Radiology Tree app to read full this article<
Get Radiology Tree app to read full this article<
Get Radiology Tree app to read full this article<
Get Radiology Tree app to read full this article<
Discussion
Get Radiology Tree app to read full this article<
Get Radiology Tree app to read full this article<
Get Radiology Tree app to read full this article<
Get Radiology Tree app to read full this article<
Get Radiology Tree app to read full this article<
Get Radiology Tree app to read full this article<
Get Radiology Tree app to read full this article<
Get Radiology Tree app to read full this article<
Get Radiology Tree app to read full this article<
Get Radiology Tree app to read full this article<
Acknowledgments
Get Radiology Tree app to read full this article<
Appendix
Get Radiology Tree app to read full this article<
Get Radiology Tree app to read full this article<
References
1. Robertson F., Leander P., Ekberg O.: Radiology of the spleen. Eur Radiol 2001; 11:: pp. 80-95.
2. O’Reilly R.A.: Splenomegaly in 2,505 patients at a large university medical center from 1913 to 1995. 1963 to 1995: 449 patients. West J Med 1998; 169: pp. 88-97.
3. Elsayes K.M., Narra V.R., Mukundan G., et. al.: MR imaging of the spleen: spectrum of abnormalities. Radiographics 2005; 25: pp. 967-982.
4. Hermann R.E., De Haven K.E., Hawk W.A.: Splenectomy for the diagnosis of splenomegaly. Ann Surg 1968; 168: pp. 896-900.
5. O’Reilly R.A.: Splenomegaly at a United States County Hospital: diagnostic evaluation of 170 patients. Am J Med Sci 1996; 312: pp. 160-165.
6. Peddu P., Shah M., Sidhu P.S.: Splenic abnormalities: a comparative review of ultrasound, microbubble-enhanced ultrasound and computed tomography. Clin Radiol 2004; 59: pp. 777-792.
7. Pozo A.L., Godfrey E.M., Bowles K.M.: Splenomegaly: investigation, diagnosis and management. Blood Rev 2009; 23: pp. 105-111.
8. Swaroop J., O’Reilly R.A.: Splenomegaly at a university hospital compared to a nearby county hospital in 317 patients. Acta Haematol 1999; 102: pp. 83-88.
9. Schloesser L.L.: The diagnostic significance of splenomegaly. Am J Med Sci 1963; 245: pp. 84-90.
10. Maia M.D., Lopes E.P., Ferraz A.A., et. al.: Evaluation of splenomegaly in the hepatosplenic form of mansonic schistosomiasis. Acta Trop 2007; 101: pp. 183-186.
11. Arkles L.B., Gill G.D., Molan M.P.: A palpable spleen is not necessarily enlarged or pathological. Med J Aust 1986; 145: pp. 15-17.
12. Grover S.A., Barkun A.N., Sackett D.L.: The rational clinical examination. Does this patient have splenomegaly?. JAMA 1993; 270: pp. 2218-2221.
13. Koga T., Morikawa Y.: Ultrasonographic determination of the splenic size and its clinical usefulness in various liver diseases. Radiology 1975; 115: pp. 157-161.
14. Bezerra A.S., D’Ippolito G., Faintuch S., et. al.: Determination of splenomegaly by CT: is there a place for a single measurement?. AJR Am J Roentgenol 2005; 184: pp. 1510-1513.
15. Larson S.M., Tuell S.H., Moores K.D., Nelp W.B.: Dimensions of the normal adult spleen scan and prediction of spleen weight. J Nucl Med 1971; 12: pp. 123-126.
16. Schulz H.G., Christou A., Gursky S., Rother P.: [Computerized tomography studies of normal morphology and volumetry of parenchymatous epigastric organs in humans]. Anat Anz 1986; 162: pp. 1-12.
17. Frank K., Linhart P., Kortsik C., Wohlenberg H.: [Sonographic determination of spleen size: normal dimensions in adults with a healthy spleen]. Ultraschall Med 1986; 7: pp. 134-137.
18. Spielmann A.L., DeLong D.M., Kliewer M.A.: Sonographic evaluation of spleen size in tall healthy athletes. AJR Am J Roentgenol 2005; 184: pp. 45-49.
19. Rosenberg H.K., Markowitz R.I., Kolberg H., et. al.: Normal splenic size in infants and children: sonographic measurements. AJR Am J Roentgenol 1991; 157: pp. 119-121.
20. Kaneko J., Sugawara Y., Matsui Y., et. al.: Normal splenic volume in adults by computed tomography. Hepatogastroenterology 2002; 49: pp. 1726-1727.
21. Hoefs J.C., Wang F.W., Lilien D., et. al.: A novel, simple method of functional spleen volume calculation by liver-spleen scan. J Nucl Med 1999; 40: pp. 1745-1755.
22. Prassopoulos P., Daskalogiannaki M., Raissaki M., et. al.: Determination of normal splenic volume on computed tomography in relation to age, gender and body habitus. Eur Radiol 1997; 7: pp. 246-248.
23. Henderson J.M., Heymsfield S.B., Horowitz J., Kutner M.H.: Measurement of liver and spleen volume by computed tomography. Assessment of reproducibility and changes found following a selective distal splenorenal shunt. Radiology 1981; 141: pp. 525-527.
24. Meier J.M., Alavi A., Iruvuri S., et. al.: Assessment of age-related changes in abdominal organ structure and function with computed tomography and positron emission tomography. Semin Nucl Med 2007; 37: pp. 154-172.
25. Cools L., Osteaux M., Divano L., Jeanmart L.: Prediction of splenic volume by a simple CT measurement: a statistical study. J Comput Assist Tomogr 1983; 7: pp. 426-430.
26. Yetter E.M., Acosta K.B., Olson M.C., Blundell K.: Estimating splenic volume: sonographic measurements correlated with helical CT determination. AJR Am J Roentgenol 2003; 181: pp. 1615-1620.
27. Linguraru M.G., Sandberg J.K., Li Z., Shah F., Summers R.M.: Automated segmentation and quantification of liver and spleen from CT Images using normalized probabilistic atlases and enhancement estimation. Med Phys 2010; 37: pp. 771-783.
28. Lamb P.M., Lund A., Kanagasabay R.R.: Spleen size: how well do linear ultrasound measurements correlate with three-dimensional CT volume assessments?. Br J Radiol 2002; 75: pp. 573-577.
29. Farraher S.W., Jara H., Chang K.J., et. al.: Liver and spleen volumetry with quantitative MR imaging and dual-space clustering segmentation. Radiology 2005; 237: pp. 322-328.
30. Linguraru M.G., Sandberg J.K., Jones E.C., et. al.: Assessing hepatomegaly: automated volumetric analysis of the liver. Acad Radiol 2012; 19: pp. 588-598.
31. Goshima S., Kanematsu M., Nishibori H., et. al.: Multi-detector row CT of the kidney: optimizing scan delays for bolus tracking techniques of arterial, corticomedullary, and nephrographic phases. Eur J Radiol 2007; 63: pp. 420-426.
32. Bland J.M., Altman D.G.: Statistical methods for assessing agreement between two methods of clinical measurement. Lancet 1986; 1: pp. 307-310.
33. DeLand F.H.: Normal spleen size. Radiology 1970; 97: pp. 589-592.
34. Geraghty E.M., Boone J.M., McGahan J.P., Jain K.: Normal organ volume assessment from abdominal CT. Abdom Imaging 2004; 29: pp. 482-490.
35. Neiman R.S., Orazi A.: Disorders of the spleen.2nd ed.1999.SaundersPhiladelphia, London
36. Sekiyama K., Yoshiba M., Inoue K., Sugata F.: Prognostic value of hepatic volumetry in fulminant hepatic failure. Dig Dis Sci 1994; 39: pp. 240-244.
37. Mazonakis M., Damilakis J., Maris T., et. al.: Comparison of two volumetric techniques for estimating liver volume using magnetic resonance imaging. J Magn Reson Imaging 2002; 15: pp. 557-563.
38. Picardi M., De Rosa G., Selleri C., et. al.: Spleen enlargement following recombinant human granulocyte colony-stimulating factor administration for peripheral blood stem cell mobilization. Hematologica 2003; 88: pp. 794-800.
39. Zhang B., Lewis S.M.: Use of radionuclide scanning to estimate size of spleen in vivo. J Clin Pathol 1987; 40: pp. 508-511.
40. Link T.M., Koppers B.B., Licht T., et. al.: In vitro and in vivo spiral CT to determine bone mineral density: initial experience in patients at risk for osteoporosis. Radiology 2004; 231: pp. 805-811.
41. Engelke K., Adams J.E., Armbrecht G., et. al.: Clinical use of quantitative computed tomography and peripheral quantitative computed tomography in the management of osteoporosis in adults: the 2007 ISCD Official Positions. J Clin Densitom Assess Skel Health 2008; 11: pp. 123-162.
42. Filicori F., Stock C., Schweitzer A.D., et. al.: Three-dimensional CT volumetry predicts outcome of laparoscopic splenectomy for splenomegaly: retrospective clinical study. World J Surg 2013; 37: pp. 52-58.
43. Chowdhury A.I., Sultana S.Z., Mannan S.: Morphometric study of splenic volume in Bangladeshi cadaver. Mymensingh Med J 2012; 21: pp. 445-449.
44. Hammon M., Dankerl P., Kramer M., et. al.: [Automated detection and volumetric segmentation of the spleen in CT scans]. Rofo 2012; 184: pp. 734-739.
45. Srisajjakul S., Prapaisilp P., Laorratkul N.: Normal splenic volume assessment on CT in 426 adults. Siriraj Med J 2012; 64: pp. 43-46.