
Rationale and Objectives
To investigate whether quantitative kinetic analysis of lesions and background parenchyma in breast magnetic resonance imaging can elucidate differences between BRCA carriers and sporadic controls with high risk for breast cancer.
Materials and Methods
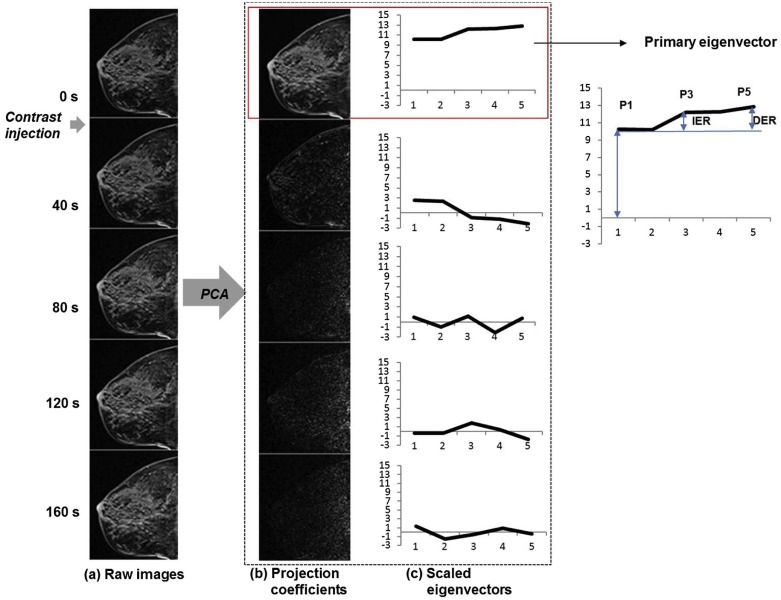
Fifty-nine BRCA and 59 control cases (49 benign, 10 malignant) were examined in this study. Principal component analysis was applied for quantitative analysis of dynamic signal in background parenchyma (B) and lesion (L) in terms of initial enhancement ratio (IER) and delayed enhancement ratio (DER).
Results
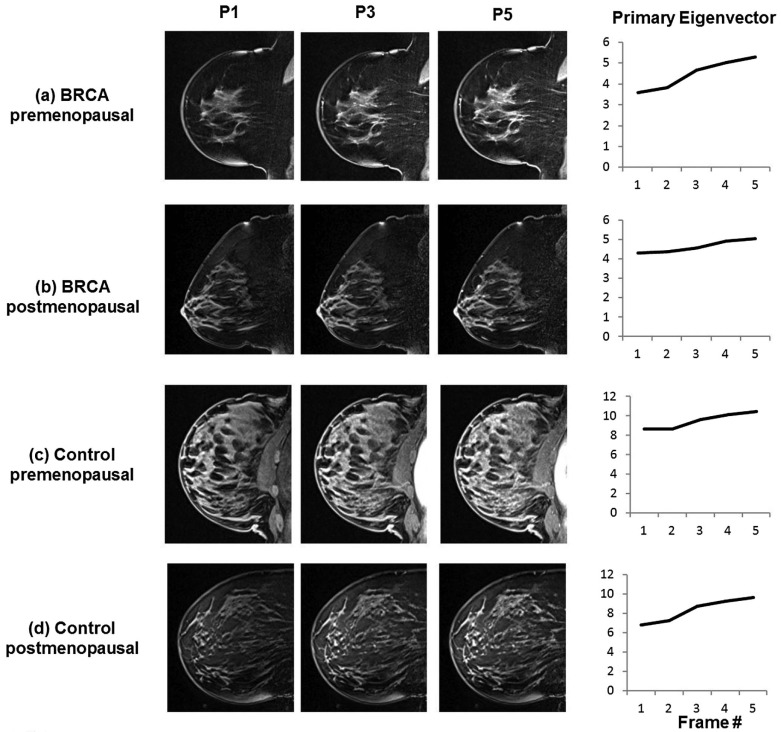
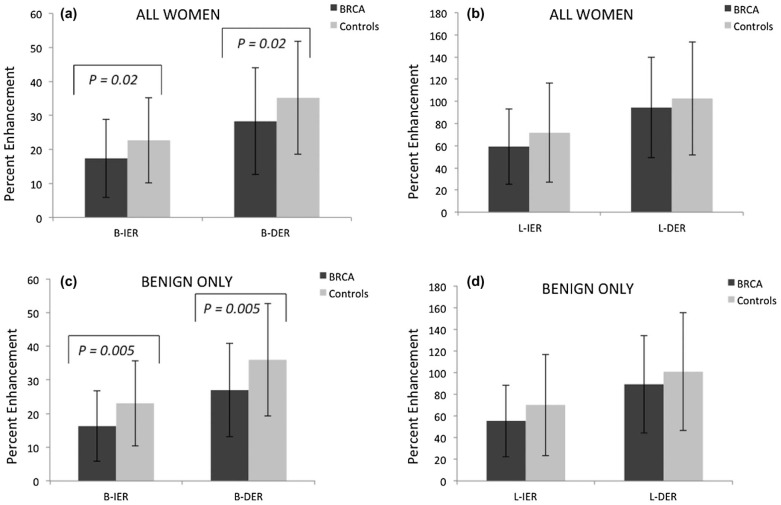
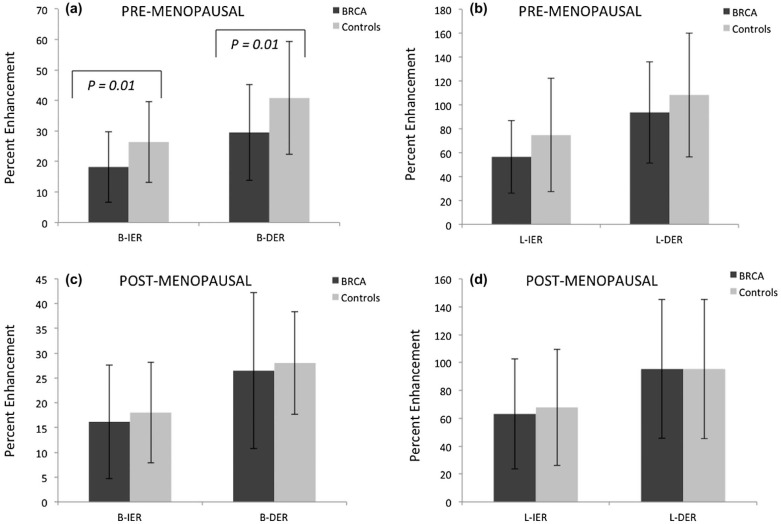
Control B-IER, B-DER, L-IER, and L-DER were higher than BRCA cases in all women and in women with benign lesions; statistically significant differences in B-IER and B-DER (all women: P = 0.02 and P = 0.02, respectively; benign only: P = 0.005 and P = 0.005, respectively). In the control cohort, B-IER and B-DER were higher in the premenopausal women than in the postmenopausal women ( P = 0.013 and 0.003, respectively), but not in the BRCA cohort; this led to significant differences in B-IER and B-DER between the control and the BRCA groups in the premenopausal women ( P = 0.01 and 0.01, respectively) but not in the postmenopausal women.
Conclusion
Results suggest possible differences in the vascular properties of background parenchyma between BRCA carriers and noncarriers and its association with menopausal status.
Introduction
BRCA 1 and BRCA 2 genes are involved in maintaining genome integrity by engaging in DNA repair and cell cycle checkpoint control, and are known as tumor suppressor genes . BRCA gene mutations are relatively common, affecting about 1 in 400 in the general population . Lifetime breast cancer risk in female BRCA mutation carriers is approximately 85% in BRCA 1 mutation carriers and about 45% in BRCA 2 mutation carriers . These women develop aggressive interval tumors that are often high grade, triple-negative breast cancers . Therefore, the American Cancer Society recommends annual screening breast magnetic resonance imaging (MRI), beginning at age 30, in all BRCA mutation carriers .
Recent studies have shown that the background parenchymal enhancement (BPE) from dynamic contrast-enhanced MRI (DCE-MRI) correlates with breast cancer risk . BPE refers to the enhancement of the normal-appearing fibroglandular tissue and is assessed on the contrast-enhanced image at the first time point after contrast agent injection . BPE reflects the vascularity of the breast parenchymal tissue and is sensitive to hormonal changes . BPE has been shown to vary with the menstrual cycle, increase with hormone replacement therapy, and decrease with menopause, antiestrogen therapies, and bilateral salpingo-oophorectomy . To date, no study has investigated possible differences between BPE of BRCA mutation carriers and nonmutation carriers and the effect of menopausal status on the BPE of these cohorts. Assessment of BPE kinetic properties of BRCA mutation carriers in comparison to nonmutation carriers may help better understand the role of BRCA in breast physiology and improve diagnostic accuracy of MRI in this population with an increased risk of familial breast cancer.
Get Radiology Tree app to read full this article<
Materials and Methods
Patient Data
Get Radiology Tree app to read full this article<
Get Radiology Tree app to read full this article<
TABLE 1
Patient Characteristics
BRCA Cases Control Cases Malignant Benign Malignant Benign No. of patients 10 49 10 49 Age (years) 53.1 ± 10.03 40.33 ± 10.93 55.2 ± 10.63 41.94 ± 10.46 Estrogen receptor status Positive 4 (40%) N/A 10 (100%) N/A Negative 6 (60%) N/A 0 N/A Progesterone receptor status Positive 4 (40%) N/A 10 (100%) N/A Negative 6 (60%) N/A 0 N/A Premenopausal 2 (20%) 32 (65.3%) 5 (50%) 28 (57.1%) Menopausal 8 (80%) 17 (34.7%) 5 (50%) 21 (42.9%)
Get Radiology Tree app to read full this article<
Get Radiology Tree app to read full this article<
MRI Data Acquisition
Get Radiology Tree app to read full this article<
Analysis of BPE Pattern
Get Radiology Tree app to read full this article<
Get Radiology Tree app to read full this article<
Get Radiology Tree app to read full this article<
Get Radiology Tree app to read full this article<
Get Radiology Tree app to read full this article<
Get Radiology Tree app to read full this article<
Analysis of Breast Lesions
Get Radiology Tree app to read full this article<
Get Radiology Tree app to read full this article<
Statistical Analysis
Get Radiology Tree app to read full this article<
Get Radiology Tree app to read full this article<
Get Radiology Tree app to read full this article<
Get Radiology Tree app to read full this article<
Results
Get Radiology Tree app to read full this article<
TABLE 2
Radiographic Characteristics
BRCA Cases Control Cases Malignant Benign_P_ Value Malignant Benign_P_ Value No. of patients 10 49 10 49 BPE 0.33 0.39 None 3 (30%) 5 (10.2%) 2 (20%) 4 (8.2%) Mild 4 (40%) 20 (40.8%) 4 (40%) 18 (36.7%) Moderate 3 (30%) 20 (40.8%) 4 (40%) 18 (36.7%) Marked 0 4 (8.2%) 0 9 (18.4%) Mammographic density 0.10 0.15 Predominantly fatty 0 0 0 1 (2.0%) Scattered FGT 4 (40%) 6 (12.2%) 3 (30%) 10 (20.4%) Heterogeneously dense 4 (40%) 28 (57.2%) 7 (70%) 21 (42.9%) Extremely dense 2 (20%) 15 (30.6%) 0 17 (34.7%) Lesion kinetic curve 0.08 0.47 Type I 1 (10%) 24 (49%) 4 (40%) 24 (48.9%) Type II 7 (70%) 19 (38.8%) 6 (60%) 21 (42.9%) Type III 2 (20%) 6 (12.2%) 0 4 (8.2%) Lesion size 0.30 0.65 ≥2 cm 5 (50%) 16 (32.7%) 4 (40%) 16 (32.7%) <2 cm 5 (50%) 33 (67.3%) 6 (60%) 33 (67.3%) Lesion type 0.42 0.37 NME 8 (80%) 29 (59.2%) 8 (80%) 28 (57.1%) Mass 2 (20%) 17 (34.7%) 2 (20%) 18 (36.8%) Focus 0 3 (6.1%) 0 3 (6.1%)
BPE, background parenchymal enhancement; FGT, fibroglandular tissue; NME, non–mass-like enhancement.
The P values are from Fisher exact test (two groups) or the chi-square test (≥3 groups).
Get Radiology Tree app to read full this article<
Get Radiology Tree app to read full this article<
Get Radiology Tree app to read full this article<
Get Radiology Tree app to read full this article<
Get Radiology Tree app to read full this article<
Get Radiology Tree app to read full this article<
Get Radiology Tree app to read full this article<
Discussion
Get Radiology Tree app to read full this article<
Get Radiology Tree app to read full this article<
Get Radiology Tree app to read full this article<
Get Radiology Tree app to read full this article<
Get Radiology Tree app to read full this article<
Get Radiology Tree app to read full this article<
Get Radiology Tree app to read full this article<
Get Radiology Tree app to read full this article<
Get Radiology Tree app to read full this article<
Conclusions
Get Radiology Tree app to read full this article<
Get Radiology Tree app to read full this article<
References
1. O’Donovan P.J., Livingston D.M.: BRCA1 and BRCA2: breast/ovarian cancer susceptibility gene products and participants in DNA double-strand break repair. Carcinogenesis 2010; 31: pp. 961-967.
2. Whittemore A.S., Gong G., John E.M., et. al.: Prevalence of BRCA1 mutation carriers among U.S. non-Hispanic whites. Cancer Epidemiol Biomarkers Prev 2004; 13: pp. 2078-2083.
3. Group A.B.C.S.: Prevalence and penetrance of BRCA1 and BRCA2 mutations in a population-based series of breast cancer cases. Br J Cancer 2000; 83: pp. 1301-1308.
4. Antoniou A., Pharoah P.D., Narod S., et. al.: Average risks of breast and ovarian cancer associated with BRCA1 or BRCA2 mutations detected in case Series unselected for family history: a combined analysis of 22 studies. Am J Hum Genet 2003; 72: pp. 1117-1130.
5. Gilliland F.D., Joste N., Stauber P.M., et. al.: Biologic characteristics of interval and screen-detected breast cancers. J Natl Cancer Inst 2000; 92: pp. 743-749.
6. Smith R.A., Saslow D., Sawyer K.A., et. al.: American Cancer Society guidelines for breast cancer screening: update 2003. CA Cancer J Clin 2003; 53: pp. 141-169.
7. Gillman J., Toth H.K., Moy L.: The role of dynamic contrast-enhanced screening breast MRI in populations at increased risk for breast cancer. Womens Health (Lond Engl) 2014; 10: pp. 609-622.
8. Bluemke D.A., Gatsonis C.A., Chen M.H., et. al.: Magnetic resonance imaging of the breast prior to biopsy. JAMA 2004; 292: pp. 2735-2742.
9. Gutierrez R.L., DeMartini W.B., Eby P.R., et. al.: BI-RADS lesion characteristics predict likelihood of malignancy in breast MRI for masses but not for nonmasslike enhancement. AJR Am J Roentgenol 2009; 193: pp. 994-1000.
10. Mahoney M.C., Gatsonis C., Hanna L., et. al.: Positive predictive value of BI-RADS MR imaging. Radiology 2012; 264: pp. 51-58.
11. King V., Brooks J.D., Bernstein J.L., et. al.: Background parenchymal enhancement at breast MR imaging and breast cancer risk. Radiology 2011; 260: pp. 50-60.
12. Amarosa A.R., McKellop J., Klautau Leite A.P., et. al.: Evaluation of the kinetic properties of background parenchymal enhancement throughout the phases of the menstrual cycle. Radiology 2013; 268: pp. 356-365.
13. King V., Gu Y., Kaplan J.B., et. al.: Impact of menopausal status on background parenchymal enhancement and fibroglandular tissue on breast MRI. Eur Radiol 2012; 22: pp. 2641-2647.
14. King V., Kaplan J., Pike M.C., et. al.: Impact of tamoxifen on amount of fibroglandular tissue, background parenchymal enhancement, and cysts on breast magnetic resonance imaging. Breast J 2012; 18: pp. 527-534.
15. Price E.R., Brooks J.D., Watson E.J., et. al.: The impact of bilateral salpingo-oophorectomy on breast MRI background parenchymal enhancement and fibroglandular tissue. Eur Radiol 2014; 24: pp. 162-168.
16. DeMartini W.B., Liu F., Peacock S., et. al.: Background parenchymal enhancement on breast MRI: impact on diagnostic performance. AJR Am J Roentgenol 2012; 198: pp. W373-W380.
17. Eyal E., Badikhi D., Furman-Haran E., et. al.: Principal component analysis of breast DCE-MRI adjusted with a model-based method. J Magn Reson Imaging 2009; 30: pp. 989-998.
18. BI-RADS Committee : Breast Imaging Reporting and Data System (BI-RADS).4th ed.2003.American College of RadiologyReston, VA
19. Ko E.S., Choi H.Y., Lee B.H., et. al.: Central washout sign in computer-aided evaluation of breast MRI: preliminary results. Acta Radiol 2011; 52: pp. 256-263.
20. Morris E.: Diagnostic breast MR imaging: current status and future directions. Radiol Clin North Am 2007; 45: pp. 863-880. vii
21. Weinstein S.: Invited commentary. Radiographics 2014; 34: pp. 247-249.
22. Easton D.F.: How many more breast cancer predisposition genes are there?. Breast Cancer Res 1999; 1: pp. 14-17.
23. Campeau P.M., Foulkes W.D., Tischkowitz M.D.: Hereditary breast cancer: new genetic developments, new therapeutic avenues. Hum Genet 2008; 124: pp. 31-42.
24. Mote P.A., Leary J.A., Avery K.A., et. al.: Germ-line mutations in BRCA1 or BRCA2 in the normal breast are associated with altered expression of estrogen-responsive proteins and the predominance of progesterone receptor A. Genes Chromosomes Cancer 2004; 39: pp. 236-248.
25. Obdeijn I.M., Winter-Warnars G.A., Mann R.M., et. al.: Should we screen BRCA1 mutation carriers only with MRI? A multicenter study. Breast Cancer Res Treat 2014; 144: pp. 577-582.
26. Sardanelli F., Podo F., Santoro F., et. al.: Multicenter surveillance of women at high genetic breast cancer risk using mammography, ultrasonography, and contrast-enhanced magnetic resonance imaging (the high breast cancer risk Italian 1 study): final results. Invest Radiol 2011; 46: pp. 94-105.
27. Zakhartseva L.M., Gorovenko N.G., Podolskaya S.V., et. al.: Breast cancer immunohistochemical features in young women with BRCA 1/2 mutations. Exp Oncol 2009; 31: pp. 174-178.
28. Heerma van Voss M.R., van der Groep P., Bart J., et. al.: Lympho-vascular invasion in BRCA related breast cancer compared to sporadic controls. BMC Cancer 2010; 10: pp. 145.
29. Kuhl C.K., Bieling H.B., Gieseke J., et. al.: Healthy premenopausal breast parenchyma in dynamic contrast-enhanced MR imaging of the breast: normal contrast medium enhancement and cyclical-phase dependency. Radiology 1997; 203: pp. 137-144.
30. Hussain Z., Roberts N., Whitehouse G.H., et. al.: Estimation of breast volume and its variation during the menstrual cycle using MRI and stereology. Br J Radiol 1999; 72: pp. 236-245.
31. Delille J.P., Slanetz P.J., Yeh E.D., et. al.: Hormone replacement therapy in postmenopausal women: breast tissue perfusion determined with MR imaging—initial observations. Radiology 2005; 235: pp. 36-41.
32. Kang S.S., Ko E.Y., Han B.K., et. al.: Background parenchymal enhancement on breast MRI: influence of menstrual cycle and breast composition. J Magn Reson Imaging 2014; 39: pp. 526-534.
33. Howlader N., Noone A.M., Krapcho M., et. al.: SEER Cancer Statistics Review, 1975-2010.2013.National Cancer InstituteBethesda, MD
34. Scaranelo A.M., Carrillo M.C., Fleming R., et. al.: Pilot study of quantitative analysis of background enhancement on breast MR images: association with menstrual cycle and mammographic breast density. Radiology 2013; 267: pp. 692-700.
35. Kim S.A., Cho N., Ryu E.B., et. al.: Background parenchymal signal enhancement ratio at preoperative MR imaging: association with subsequent local recurrence in patients with ductal carcinoma in situ after breast conservation surgery. Radiology 2014; 270: pp. 699-707.
36. Kajihara M., Goto M., Hirayama Y., et. al.: Effect of the menstrual cycle on background parenchymal enhancement in breast MR imaging. Magn Reson Med Sci 2013; 12: pp. 39-45.
37. Huang W., Li X., Morris E.A., et. al.: The magnetic resonance shutter speed discriminates vascular properties of malignant and benign breast tumors in vivo. Proc Natl Acad Sci U S A 2008; 105: pp. 17943-17948.
38. Tofts P.S., Brix G., Buckley D.L., et. al.: Estimating kinetic parameters from dynamic contrast-enhanced T(1)-weighted MRI of a diffusable tracer: standardized quantities and symbols. J Magn Reson Imaging 1999; 10: pp. 223-232.