
Rationale and Objectives
This study aimed to test the hypothesis that the heterogeneity difference between edge and core of lesions by using intensity and entropy features obtained from whole-lesion texture analysis on contrast-enhanced computed tomography (CT) may be useful for differentiation of malignant from inflammatory pulmonary nodules and masses.
Materials and Methods
In all, 48 single pulmonary nodules and masses were retrospectively evaluated. All lesions were histologically or clinically confirmed (malignancy: inflammation = 24:20). We utilized a newly introduced texture analysis method based on contrast-enhanced CT (first described by Grove et al.) that automatically divided the whole lesion volume into two regions: edge and core. Mean attenuation value (AV) and entropy of each region and also the whole lesion were evaluated separately. Each texture metric (absolute value for each region, and difference value defined as difference between edge and core) of malignant and inflammatory lesions were compared using Mann-Whitney U test. Individual image parameters were combined by using linear discriminant analysis. Receiver operating characteristic curves were generated to assess each texture metric and their combination for discriminating between the two entities.
Results
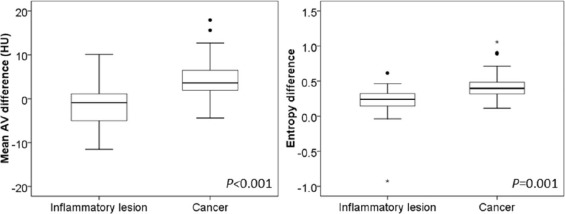
Mean AV difference and entropy difference were significantly higher in malignant lesions than in inflammatory lesions (4.71 HU ± 5.06 vs −1.53 HU ± 5.05, P < .001; 0.45 ± 0.23 vs 0.18 ± 0.30, P = .001). Receiver operating characteristic curves for individual mean AV difference and entropy difference provided relatively high values for the area under the curve (0.836 and 0.795, respectively). The combination of mean AV difference, entropy difference, and lesion volume improved the area under the curve to 0.864.
Conclusion
Heterogeneity difference between edge and core by using whole-lesion texture analysis on contrast-enhanced CT may be a promising tool for estimating the probability of malignancy in pulmonary nodules and masses.
Introduction
Lung cancer is the leading cause of cancer deaths in both men and women, with a 5-year survival rate of only 18% in the United States . Early diagnosis and early surgery are still considered as the most effective methods that may reduce lung cancer mortality. In clinical practice, focal pulmonary lesions are commonly encountered with the wide spread and use of multidetector-row computed tomography (CT) scanners. Typically, focal pulmonary lesions may be classified as nodules (less than 3–4 cm in diameter) or masses (more than 3–4 cm in diameter) . Malignancy accounted forapproximately half of nodules, whereas masses tend to be even more likely to be malignant . Therefore, it is important to accurately differentiate malignant from benign lesions in the least invasive way to facilitate prompt and effective interventions, as therapeutic approaches are almost completely distinct.
CT imaging has enabled a more detailed characterization of focal pulmonary lesions noninvasively based on imaging features such as internal density, contour shape, margins, and contrast enhancement features. However, among all types of benign focal pulmonary lesions, inflammatory lesions can share not only similar morphologic characteristics, but also comparable contrast enhancement levels with lung cancers , making the differential diagnosis even more difficult .
Get Radiology Tree app to read full this article<
Get Radiology Tree app to read full this article<
Materials and Methods
Patients
Get Radiology Tree app to read full this article<
TABLE 1
Patient Demographics and Lesion Characteristics
Lung Cancer Inflammatory Lesion_P_ Value Age (y) \* 63.2 ± 9.0(44–80) 60 ± 11.9(41–80) .31 Sex distribution .90 No. of men 24 16 — No. of women 4 4 — Diameter (cm) \* 3.9 ± 0.9(2.5–5.8) 3.5 ± 1.0(1.9–5.2) .26 Volume (cm 3 ) \* 37.6 ± 32.5(6.1–123.4) 21.6 ± 22.9(1.6–94.4) .03 Pathologic subtype Adenocarcinoma ( n = 14), squamous cell carcinoma ( n = 12), small cell carcinoma ( n = 2) Focal-organizing pneumonia ( n = 9), granulomatous inflammation ( n = 8), pulmonary inflammation ( n = 3) — Reference standard Surgical resection ( n = 14), transbronchial lung biopsy ( n = 8), CT-guided percutaneous biopsy ( n = 6) Surgical resection ( n = 10), CT-guided percutaneous biopsy ( n = 7), clinical confirmation ( n = 3) —
CT, computed tomography.
Get Radiology Tree app to read full this article<
Get Radiology Tree app to read full this article<
CT Examination
Get Radiology Tree app to read full this article<
Image Analysis
Get Radiology Tree app to read full this article<
Entropy=∑ni=1(−pi)[log(pi)] E
ntropy
=
∑
i
=
1
n
(
−
p
i
)
[
log
(
p
i
)
]
where p i represents the probability of a certain normalized gray level i (1 ≤ i ≤ 256) in the volumetric density histogram . In our study, we used a 256-bin histogram. Entropy difference was defined as the difference value between edge and core, that is, Entropy edge −Entropy core . Absolute mean AVs for whole and subdivided regions, as well as the meanattenuation value difference (AV edge −AV core ), were registered. Besides, lesion diameter (the largest diameter on transverse, sagittal, and coronal sections, overall) and lesion volume were recorded.

Get Radiology Tree app to read full this article<
Get Radiology Tree app to read full this article<
Statistical Analysis
Get Radiology Tree app to read full this article<
Get Radiology Tree app to read full this article<
Results
Get Radiology Tree app to read full this article<
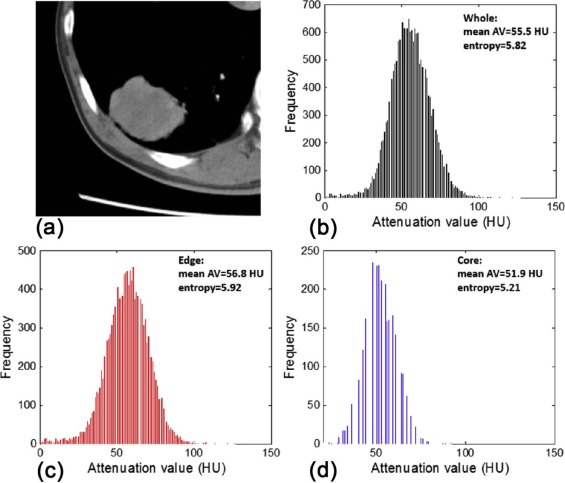
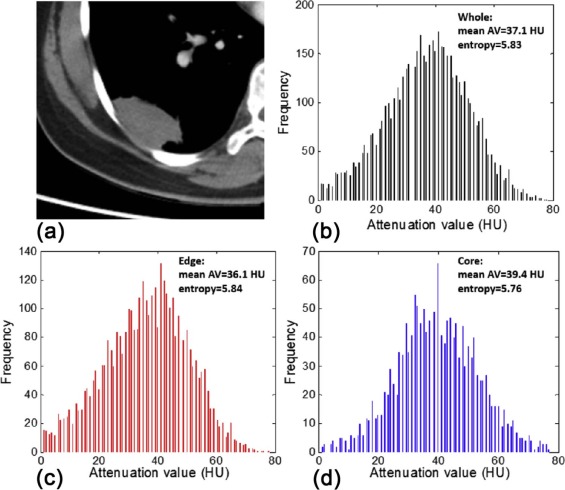
TABLE 2
Texture Parameters of Lung Cancer and Inflammatory Lesions
Parameters Cancer Inflammation_P_ Value Core Mean AV (HU) 43.94 ± 18.12 36.44 ± 14.40 .202 Entropy 5.74 ± 0.49 5.59 ± 0.70 .770 Edge Mean AV (HU) 48.65 ± 17.98 34.91 ± 13.62.013 Entropy 6.19 ± 0.50 5.77 ± 0.92 .143 Whole Mean AV (HU) 45.67 ± 17.90 35.41 ± 13.64 .069 Entropy 6.11 ± 0.49 5.81 ± 0.73 .259 Mean AV difference (HU) 4.71 ± 5.06 −1.53 ± 5.05<.001 Entropy difference 0.45 ± 0.23 0.18 ± 0.30.001
AV, attenuation value.
Significant differences are captured in bold. Data are means ± standard deviation.
Get Radiology Tree app to read full this article<
Get Radiology Tree app to read full this article<
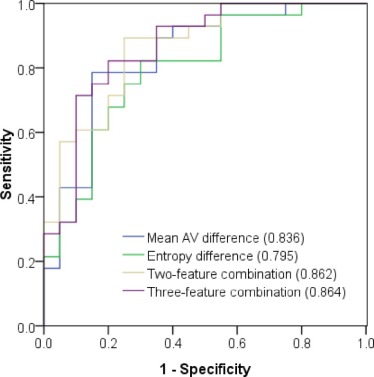
TABLE 3
Diagnostic Performance of Quantitative Image Features for Differentiation of Malignant From Inflammatory Pulmonary Nodules and Masses
Parameters AUC \* Sensitivity Specificity Cutoff † Core Mean AV 0.609 (0.457, 0.746) 46.4% 85.0% 44.89 HU Entropy 0.525 (0.376, 0.671) 17.9% 100.0% 6.28 Edge Mean AV 0.713 (0.564, 0.834) 60.7% 85.0% 43.96 HU Entropy 0.625 (0.474, 0.760) 35.7% 100.0% 6.53 Whole Mean AV 0.655 (0.504, 0.786) 53.6% 85.0% 44.24 HU Entropy 0.596 (0.445, 0.735) 28.6% 100.0% 6.51 Mean AV difference 0.836 (0.701, 0.927) 78.6% 85.0% 1.75 HU Entropy difference 0.795 (0.653, 0.898) 82.1% 70.0% 0.26 Two-feature combination ‡ 0.862 (0.732, 0.945) 89.3% 75.0% — Three-feature combination § 0.864 (0.735, 0.946) 82.1% 80.0% —
AUC, area under the receiver operating characteristic curve; AV, attenuation value.
Get Radiology Tree app to read full this article<
Get Radiology Tree app to read full this article<
Get Radiology Tree app to read full this article<
Get Radiology Tree app to read full this article<
Get Radiology Tree app to read full this article<
Get Radiology Tree app to read full this article<
Discussion
Get Radiology Tree app to read full this article<
Get Radiology Tree app to read full this article<
Get Radiology Tree app to read full this article<
Get Radiology Tree app to read full this article<
Get Radiology Tree app to read full this article<
Conclusion
Get Radiology Tree app to read full this article<
Get Radiology Tree app to read full this article<
Get Radiology Tree app to read full this article<
References
1. Siegel R.L., Miller K.D., Jemal A.: Cancer statistics, 2015. CA Cancer J Clin 2015; 65: pp. 5-29.
2. Gould M.K., Maclean C.C., Kuschner W.G., et. al.: Accuracy of positron emission tomography for diagnosis of pulmonary nodules and mass lesions: a meta-analysis. JAMA 2001; 285: pp. 914-924.
3. Zhang M., Kono M.: Solitary pulmonary nodules: evaluation of blood flow patterns with dynamic CT. Radiology 1997; 205: pp. 471-478.
4. Hou W.S., Wu H.W., Yin Y., et. al.: Differentiation of lung cancers from inflammatory masses with dual-energy spectral CT imaging. Acad Radiol 2015; 22: pp. 337-344.
5. Ganeshan B., Goh V., Mandeville H.C., et. al.: Non–small cell lung cancer: histopathologic correlates for texture parameters at CT. Radiology 2013; 266: pp. 326-336.
6. Lambin P., Rios-Velazquez E., Leijenaar R., et. al.: Radiomics: extracting more information from medical images using advanced feature analysis. Eur J Cancer 2012; 48: pp. 441-446.
7. Kumar V., Gu Y., Basu S., et. al.: Radiomics: the process and the challenges. Magn Reson Imaging 2012; 30: pp. 1234-1248.
8. Aerts H.J., Velazquez E.R., Leijenaar R.T., et. al.: Decoding tumour phenotype by noninvasive imaging using a quantitative radiomics approach. Nat Commun 2014; 5: pp. 4006.
9. Weiss G.J., Ganeshan B., Miles K.A., et. al.: Noninvasive image texture analysis differentiates K-ras mutation from Pan-wildtype NSCLC and is prognostic. PLoS ONE 2014; 9: pp. e100244.
10. Chae H.-D., Park C.M., Park S.J., et. al.: Computerized texture analysis of persistent part-solid ground-glass nodules: differentiation of preinvasive lesions from invasive pulmonary adenocarcinomas. Radiology 2014; 273: pp. 285-293.
11. Kamiya A., Murayama S., Kamiya H., et. al.: Kurtosis and skewness assessments of solid lung nodule density histograms: differentiating malignant from benign nodules on CT. Jpn J Radiol 2014; 32: pp. 14-21.
12. Ganeshan B., Miles K.A., Young R., et. al.: Hepatic entropy and uniformity: additional parameters that can potentially increase the effectiveness of contrast enhancement during abdominal CT. Clin Radiol 2007; 62: pp. 761-768.
13. Kierans A.S., Bennett G.L., Mussi T.C., et. al.: Characterization of malignancy of adnexal lesions using ADC entropy: comparison with mean ADC and qualitative DWI assessment. J Magn Reson Imaging 2013; 37: pp. 164-171.
14. Cao M.-Q., Suo S.-T., Zhang X.-B., et. al.: Entropy of T2-weighted imaging combined with apparent diffusion coefficient in prediction of uterine leiomyoma volume response after uterine artery embolization. Acad Radiol 2014; 21: pp. 437-444.
15. Fujimoto K., Tonan T., Azuma S., et. al.: Evaluation of the mean and entropy of apparent diffusion coefficient values in chronic hepatitis C: correlation with pathologic fibrosis stage and inflammatory activity grade. Radiology 2011; 258: pp. 739-748.
16. Ganeshan B., Abaleke S., Young R.C., et. al.: Texture analysis of non-small cell lung cancer on unenhanced computed tomography: initial evidence for a relationship with tumour glucose metabolism and stage. Cancer Imaging 2010; 10: pp. 137.
17. Grove O., Berglund A.E., Schabath M.B., et. al.: Quantitative computed tomographic descriptors associate tumor shape complexity and intratumor heterogeneity with prognosis in lung adenocarcinoma. PLoS ONE 2015; 10: pp. e0118261.
18. Gatenby R.A., Grove O., Gillies R.J.: Quantitative imaging in cancer evolution and ecology. Radiology 2013; 269: pp. 8-14.
19. Ravanelli M., Farina D., Morassi M., et. al.: Texture analysis of advanced non-small cell lung cancer (NSCLC) on contrast-enhanced computed tomography: prediction of the response to the first-line chemotherapy. Eur Radiol 2013; 23: pp. 3450-3455.
20. Peng Y., Jiang Y., Yang C., et. al.: Quantitative analysis of multiparametric prostate MR images: differentiation between prostate cancer and normal tissue and correlation with Gleason score—a computer-aided diagnosis development study. Radiology 2013; 267: pp. 787-796.
21. Ganeshan B., Miles K.A.: Quantifying tumour heterogeneity with CT. Cancer Imaging 2013; 13: pp. 140.
22. Alic L., Niessen W.J., Veenland J.F.: Quantification of heterogeneity as a biomarker in tumor imaging: a systematic review. PLoS ONE 2014; 9: pp. e110300.
23. O’Connor J.P., Rose C.J., Waterton J.C., et. al.: Imaging intratumor heterogeneity: role in therapy response, resistance, and clinical outcome. Clin Cancer Res 2015; 21: pp. 249-257.
24. Wang H., Guo X.-H., Jia Z.-W., et. al.: Multilevel binomial logistic prediction model for malignant pulmonary nodules based on texture features of CT image. Eur J Radiol 2010; 74: pp. 124-129.
25. Kido S., Kuriyama K., Higashiyama M., et. al.: Fractal analysis of small peripheral pulmonary nodules in thin-section CT: evaluation of the lung-nodule interfaces. J Comput Assist Tomogr 2002; 26: pp. 573-578.
26. Maldonado F., Boland J.M., Raghunath S., et. al.: Non-invasive characterization of the histopathologic features of pulmonary nodules of the lung adenocarcinoma spectrum using Computer Aided Nodule Assessment and Risk Yield (CANARY)—a pilot study. J Thorac Oncol 2013; 8: pp. 452-460.
27. Reiner C.S., Gordic S., Puippe G., et. al.: Histogram analysis of CT perfusion of hepatocellular carcinoma for predicting response to transarterial radioembolization: value of tumor heterogeneity assessment. Cardiovasc Intervent Radiol 2016; 39: pp. 400-408.
28. Mandeville H.C., Ng Q.S., Daley F.M., et. al.: Operable non–small cell lung cancer: correlation of volumetric helical dynamic contrast-enhanced CT parameters with immunohistochemical markers of tumor hypoxia. Radiology 2012; 264: pp. 581-589.
29. Swensen S.J., Brown L.R., Colby T.V., et. al.: Pulmonary nodules: CT evaluation of enhancement with iodinated contrast material. Radiology 1995; 194: pp. 393-398.
30. Swensen S.J., Viggiano R.W., Midthun D.E., et. al.: Lung nodule enhancement at CT: multicenter study. Radiology 2000; 214: pp. 73-80.
31. Ng F., Kozarski R., Ganeshan B., et. al.: Assessment of tumor heterogeneity by CT texture analysis: can the largest cross-sectional area be used as an alternative to whole tumor analysis?. Eur J Radiol 2013; 82: pp. 342-348.
32. Hawkins S.H., Korecki J.N., Balagurunathan Y., et. al.: Predicting outcomes of nonsmall cell lung cancer using CT image features. IEEE Access 2014; 2: pp. 1418-1426.