
Rationale and Objectives
The aim of this study was to combine the stereological technique with magnetic resonance (MR) imaging data for the volumetric and functional analysis of the left ventricle (LV).
Materials and Methods
Cardiac MR examinations were performed in 13 consecutive subjects with known or suspected coronary artery disease. The end-diastolic volume (EDV), end-systolic volume, ejection fraction (EF), and mass were estimated by stereology using the entire slice set depicting LV and systematic sampling intensities of 1/2 and 1/3 that provided samples with every second and third slice, respectively. The repeatability of stereology was evaluated. Stereological assessments were compared with the reference values derived by manually tracing the endocardial and epicardial contours on MR images.
Results
Stereological EDV and EF estimations obtained by the 1/3 systematic sampling scheme were significantly different from those by manual delineation ( P < .05). No difference was observed between the reference values and the LV parameters estimated by the entire slice set or a sampling intensity of 1/2 ( P > .05). For these stereological approaches, a high correlation ( r 2 = 0.80–0.93) and clinically acceptable limits of agreement were found with the reference method. Stereological estimations obtained by both sample sizes presented comparable coefficient of variation values of 2.9–5.8%. The mean time for stereological measurements on the entire slice set was 3.4 ± 0.6 minutes and it was reduced to 2.5 ± 0.5 minutes with the 1/2 systematic sampling scheme.
Conclusion
Stereological analysis on systematic samples of MR slices generated by the 1/2 sampling intensity provided efficient and quick assessment of LV volumes, function, and mass.
The left ventricular (LV) volumetric and functional parameters are important predictive factors in patients with cardiovascular diseases . Cardiac magnetic resonance (MR) imaging is currently considered as the modality of choice for the assessment of LV volumes, ejection fraction (EF), and myocardial mass . Most of the techniques employed for the measurement of LV indices are based on the manual , semiautomatic , or automatic detection of endocardial and epicardial contours on cine MR images. Manual delineation of LV contours on a slice-by-slice basis is a labor-intensive approach not easily applicable in routine clinical practice. Semiautomatic methods may be limited by the demand either to manually draw an initial LV outline or to perform manual corrections on one or more of the obtained contours . The automatic segmentation methods are occasionally prone to errors because of the variation of the MR image characteristics and heart geometry among patients .
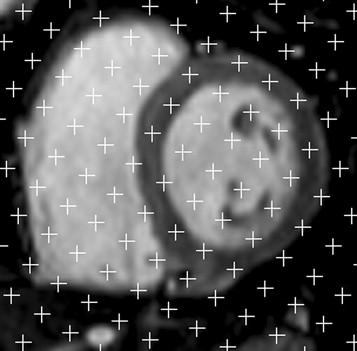
The computer-assisted stereological technique consists in overlying each image with a randomly oriented systematic array of test points and counting the number of intersections between the region of interest and the test points. Stereological volume measurements are not dependent upon the requirement of any contour extraction from cross-sectional images. Limited information exists in the literature about the application of the stereological point counting technique on cardiac MR images. Roberts et al analyzed the cardiac function of a single healthy volunteer. The results of Graves and Dommett were referred to healthy subjects and no attempts were made to obtain efficient stereological estimations using only a sample of slices from the initially acquired image set. Moreover, the stereological estimations in the previous reports were not compared with those derived by manual tracing which has been widely used as the standard of reference .
Get Radiology Tree app to read full this article<
Materials and methods
Subjects
Get Radiology Tree app to read full this article<
MR Imaging Data Acquisition
Get Radiology Tree app to read full this article<
Manual Tracing
Get Radiology Tree app to read full this article<
V=TS∑mi=1Ni V
=
T
S
∑
i
=
1
m
N
i
where V is the volume of interest, T is the slice thickness, S is the pixel area, m is the total number of slices showing LV, and N i is the number of pixels lying inside each contour of slice i . The obtained volume measurements were employed to calculate the LV EF and mass with the following equations:
EF=EDV−ESVEDV×100% E
F
=
E
D
V
−
E
S
V
E
D
V
×100%
Mass=(Vepi−EDV)×1.05 M
a
s
s
=
(
V
e
p
i
−
E
D
V
)
×1
.05
Get Radiology Tree app to read full this article<
Stereological Volume Estimations
Get Radiology Tree app to read full this article<
V=Td2∑mi=1Pi V
=
T
d
2
∑
i
=
1
m
P
i
where T is the slice thickness, d is the separation distance between test points, m is the total number of slices depicting LV, and P i is the number of points counted on a section i . The coefficient of error (CE) of the obtained cardiac volume estimations due to both sectioning and point counting was calculated by the following formula introduced by Cruz-Orive :
CE=(∑mi=1Pi)−1[112(3∑mi=1P2i+∑m−2i=1PiPi+2−4∑m−1i=1PiPi+1)+0.0543(BA√)(m∑mi=1Pi)1/2]1/2 C
E
=
(
∑
i
=
1
m
P
i
)
−
1
[
1
12
(
3
∑
i
=
1
m
P
i
2
+
∑
i
=
1
m
−
2
P
i
P
i
+
2
−
4
∑
i
=
1
m
−
1
P
i
P
i
+
1
)
+
0
.0543
(
B
A
)
(
m
∑
i
=
1
m
P
i
)
1/2
]
1/2
where B is the mean boundary length and A is the mean area of the region of interest. The quantity (B/A−−√) (
B
/
A
) , known as shape coefficient, has been previously determined for the LV and it was equal to 4.7 .
Get Radiology Tree app to read full this article<
Get Radiology Tree app to read full this article<
Get Radiology Tree app to read full this article<
d=V100T−−−−√ d
=
V
100
T
where V is an approximate estimate of the volume of interest and T is the sectioning interval . The above formula ensures that approximately 100 test points are selected in all slices. To calculate the distance d , we considered that the mean EDV and ESV were about 120 mL and 45 mL, respectively. Moreover, T was set equal to the MR section thickness of 0.8 cm when the cardiac volumes were estimated using the total number of slices depicting LV in each cardiac phase. Based on Equation 6 , the point spacing applied in the end-diastolic and end-systolic images was 1.22 cm and 0.75 cm, respectively. For samples produced by using a sampling intensity of 1/2, the value of T was set to 2×0.8 = 1.6 cm. The corresponding T value for a sampling intensity of 1/3 was 2.4 cm. The above T values were introduced in Equation 6 to determine the point separation distance used for EDV and ESV estimations when a sampling intensity of 1/2 or 1/3 was adopted. The V epi at end-diastole was estimated using the same point spacing with that employed for EDV measurements. The stereological volume estimations were used to calculate the LV EF and mass with the Equations 2 and 3 , respectively.
Get Radiology Tree app to read full this article<
Repeatability of Stereological Estimations
Get Radiology Tree app to read full this article<
Statistics
Get Radiology Tree app to read full this article<
Results
Get Radiology Tree app to read full this article<
Table 1
Number of Counted Points for the Stereological Estimation of Left Ventricular Volumes Using the Entire Slice Set and Sampling Intensities of 1/2 and 1/3
Number of Sampled Slices Number of Counted Points EDV ESV V epi All 106 ± 27 101 ± 28 181 ± 41 1/2 106 ± 28 112 ± 39 183 ± 41 1/3 112 ± 33 117 ± 34 191 ± 47
Data are expressed as mean ± SD.
EDV, end-diastolic volume; ESV, end-systolic volume; V epi , epicardial volume.
Table 2
Coefficient of Error (CE) Associated with the Stereological Estimation of Left Ventricular Volumes Using the Entire Slice Set and Sampling Intensities of 1/2 and 1/3
Number of Sampled Slices CE (%) EDV ESV V epi All 4.8 ± 0.5 6.2 ± 1.3 4.0 ± 0.4 1/2 8.0 ± 0.9 9.8 ± 1.8 7.2 ± 1.1 1/3 11.8 ± 1.6 14.5 ± 2.2 11.5 ± 1.8
Data are expressed as mean ± SD.
EDV, end-diastolic volume; ESV, end-systolic volume; V epi , epicardial volume.
Get Radiology Tree app to read full this article<
Get Radiology Tree app to read full this article<
Get Radiology Tree app to read full this article<
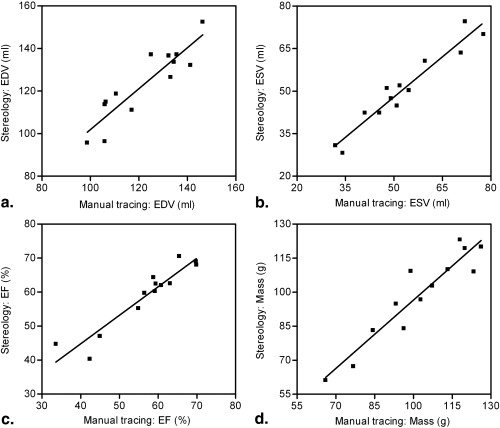
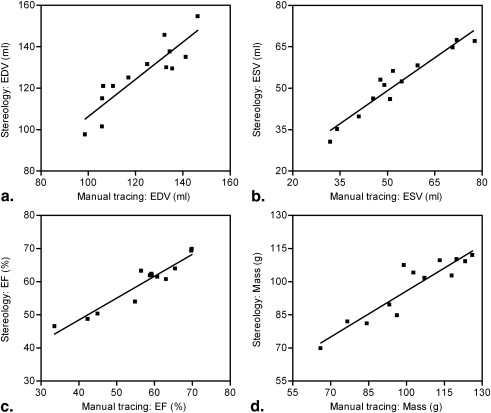
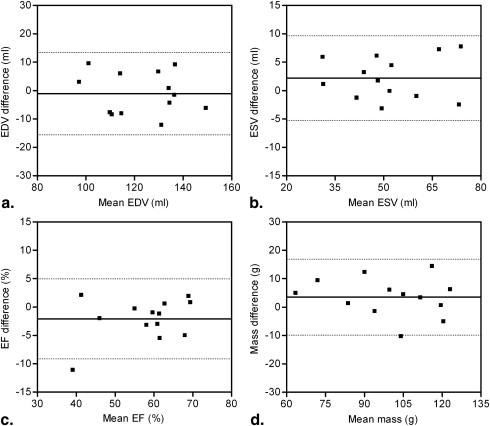
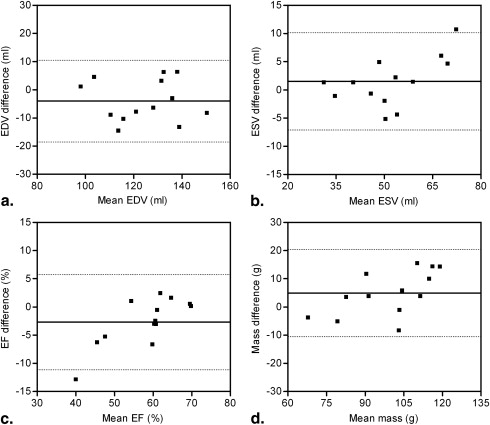
Table 3
Intraobserver Coefficient of Variation (CV) Values for the Stereological Estimation of Left Ventricular Parameters using the Entire Slice Set and a Sampling Intensity of 1/2
Number of Sampled Slices CV (%) EDV ESV EF Mass All 3.3 3.8 2.9 5.3 1/2 4.1 3.0 3.1 5.8
EDV, end-diastolic volume; ESV, end-systolic volume; EF, ejection fraction.
Get Radiology Tree app to read full this article<
Discussion
Get Radiology Tree app to read full this article<
Get Radiology Tree app to read full this article<
Get Radiology Tree app to read full this article<
Get Radiology Tree app to read full this article<
Conclusions
Get Radiology Tree app to read full this article<
References
1. White H.D., Norris R.M., Brown M.A., et. al.: Left ventricular end-systolic volume as the major determinant of survival after recovery from myocardial infarction. Circulation 1987; 76: pp. 44-51.
2. Alfakih K., Reid S., Jones T., et. al.: Assessment of ventricular function and mass by cardiac magnetic resonance imaging. Eur Radiol 2004; 14: pp. 1813-1822.
3. George K.P., Birch K.M., Pennel D.J., et. al.: Magnetic-resonance-imaging-derived indices for the normalization of ventricular morphology by body size. Magn Reson Imaging 2009; 27: pp. 207-213.
4. Bottger T., Kunert T., Meinzer H.P., et. al.: Application of a new segmentation tool based on interactive simplex meshes to cardiac images and pulmonary MRI data. Acad Radiol 2007; 14: pp. 319-329.
5. van der Geest R.J., Buller V.G.M., Jansen E., et. al.: Comparison between manual and semiautomated analysis of left ventricular volume parameters from short-axis MR images. J Comput Assist Tomogr 1997; 21: pp. 756-765.
6. van Geuns R.J., Baks T., Gronnenschild E.H., et. al.: Automatic quantitative left ventricular analysis of cine MR images by using three-dimensional information for contour detection. Radiology 2006; 240: pp. 215-221.
7. Mazonakis M., Grinias E., Pagonidis K., et. al.: Development and evaluation of a semiautomatic segmentation method for the estimation of LV parameters on cine MR images. Phys Med Biol 2010; 55: pp. 1127-1140.
8. Gupta V., Hendriks E.A., Milles J., et. al.: Fully automatic registration and segmentation of first-pass myocardial perfusion MR image sequences. Acad Radiol 2010; 17: pp. 1375-1385.
9. van der Geest R.J., Lelieveldt B.P.F., Angelie E., et. al.: Evaluation of a new method for automated detection of left ventricular boundaries in time series of magnetic resonance images using an active appearance motion model. J Cardiovasc Magn Reson 2004; 6: pp. 609-617.
10. Roberts N., Cruz-Orive L.M., Bourne M., et. al.: Analysis of cardiac function by MRI and stereology. J Microsc 1997; 187: pp. 31-42.
11. Graves M.J., Dommett D.M.F.: Comparison of cardiac stroke volume measurement determined using stereological analysis of breath-hold cine MRI and phase contrast velocity mapping. Br J Radiol 2000; 73: pp. 825-832.
12. Cruz-Orive L.M.: Systematic sampling in stereology. Bull Int Stat Inst 1993; 55: pp. 451-468.
13. Mazonakis M., Pagonidis K., Schlosser T., et. al.: Stereological estimation of left-ventricular volumetric and functional parameters from multidetector-row computed tomography data. Eur Radiol 2008; 18: pp. 1338-1349.
14. Roberts N., Garden A.S., Cruz-Orive L.M., et. al.: Estimation of fetal volume by magnetic resonance imaging and stereology. Br J Radiol 1994; 67: pp. 1067-1077.
15. Gundersen H.J.G., Jensen E.B.: The efficiency of systematic sampling in stereology and its prediction. J Microsc 1987; 147: pp. 229-263.
16. Sahin B., Emizreoglu M., Uzun A., et. al.: Unbiased estimation of the liver volume by the Cavalieri principle using magnetic resonance images. Eur J Radiol 2003; 47: pp. 164-170.
17. Mazonakis M., Karampekios S., Damilakis J., et. al.: Stereological estimation of total intracranial volume on CT images. Eur Radiol 2004; 14: pp. 1285-1290.
18. Joe B.N., Suh J., Hildebolt C.F., et. al.: MR volumetric measurements of the myomatous uterus: improved reliability of stereology over linear measurements. Acad Radiol 2007; 14: pp. 455-462.