
Rationale and Objectives
To evaluate the ability of segmental linear fitting analysis of gadolinium ethoxybenzyl diethylenetriamine pentaacetic acid liver perfusion magnetic resonance imaging (MRI) to assess liver function and liver fibrosis.
Materials and Methods
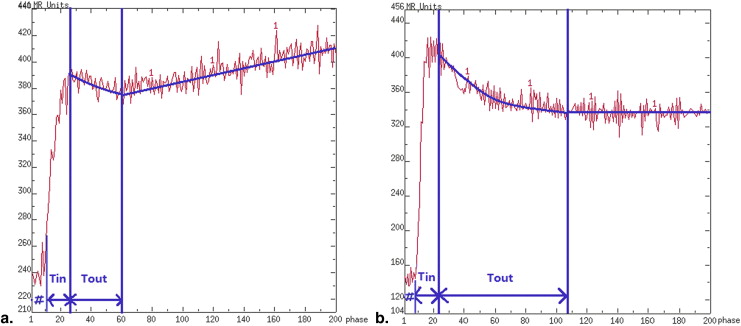
Gadolinium ethoxybenzyl diethylenetriamine pentaacetic acid liver perfusion MRI was performed in 41 patients, and perfusion estimates were generated by segmental linear fitting analysis of the time-intensity curves. The relationships of T in , T out , K up , and the ratio between the signal intensities of the peak and the last phase with liver fibrosis stage and laboratory measurements of liver function were evaluated.
Results
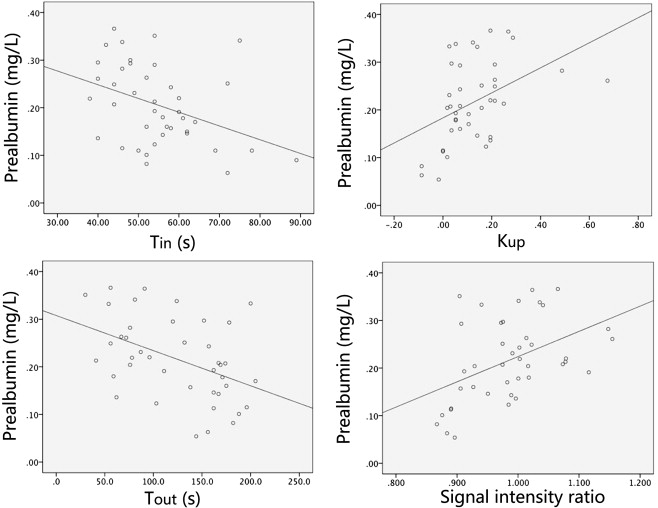
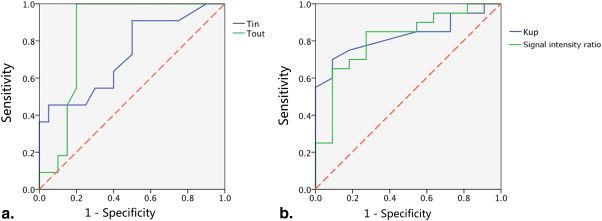
Serum prealbumin concentration was significantly positively correlated with K up and the signal intensity ratio and was significantly negatively correlated with T in and T out . T in and T out were significantly higher and K up and the signal intensity ratio were significantly lower in patients with advanced fibrosis than those without. T out was the best predictor of advanced fibrosis, with an area under the receiving operating characteristic curve of 0.843, a sensitivity of 100%, and a specificity of 80%.
Conclusions
A new procedure of quantifying the hepatocyte-specific uptake of a T1-enhancing contrast agent can be used to assess impaired hepatobiliary function. The parameters obtained from perfusion MRI have the potential to predict advanced fibrosis.
Assessment of segmental liver function plays an important role in the preoperative evaluation of liver tumors, as regional differences in hepatocyte function may occur in patients with chronic liver diseases. Quantitatively derived estimates are useful and even necessary for reproducible and robust evaluation of liver function. These estimates can also be used to evaluate liver function preoperatively to plan segmental liver resections and postoperatively to evaluate the effects of treatment. Scintigraphic and single photon emission computed tomography (SPECT) methods are currently the only imaging-based liver function tests in clinical use . These methods, however, are not widely accepted for the preoperative evaluation. Use of a hepatocyte-specific contrast agent, gadolinium ethoxybenzyl diethylenetriamine pentaacetic acid (Gd-EOB-DTPA, Primovist; Bayer Schering Pharma AG, Berlin), has been shown to improve the detection and characterization of focal liver lesions in T1-weighted magnetic resonance imaging (MRI) . Moreover, Gd-EOB-DTPA has the potential to directly measure liver function . The pharmacokinetic properties of Gd-EOB-DTPA are similar to those of the 99mTc-iminodiacetic acid family, in that hepatocellular uptake occurs through the organic anionic transport system and subsequent biliary excretion by glutathione S-transferase . Pharmacokinetic studies have shown that approximately 50% of the administered dose of Gd-EOB-DTPA is extracted by the liver and secreted through the hepatobiliary system . Thus, hepatic uptake of Gd-EOB-DTPA and subsequent excretion are dependent on the integrity of the hepatocyte mass. The liver showed early enhancement, with a steep increase in signal intensity during the first minute after administration of the contrast agent and a further, although slower, increase for up to about 20 minutes . The degree and time course of signal intensity enhancement may be used to measure liver function. Relative enhancement between plain signal intensity and contrast-enhanced signal intensity was found to differ significantly between patients with normal liver function and patients with impaired liver function .
Some model-free approaches to data analysis have been reported to quantitatively assess hepatic function in patients, correlating with disease severity . Recently proposed model-based approaches have demonstrated simultaneous measurement of liver perfusion and hepatocellular function . Measures of liver function obtained by routine Gd-EOB-DTPA dynamic contrast enhanced (DCE)-MRI with tracer kinetic modeling may provide a suitable method for the evaluation of liver functional reserve . However, model-based approaches require data processing with specific programs and complicated computations. Additionally, although some estimates showed a potential to discriminate between impaired and normal hepatobiliary function, their clinical relevance has not yet been fully determined. This study, which uses a simple method to analyze perfusion data, was performed to determine whether parameters obtained by this method correlate with clinical characteristics.
Materials and methods
Get Radiology Tree app to read full this article<
Get Radiology Tree app to read full this article<
Get Radiology Tree app to read full this article<
Get Radiology Tree app to read full this article<
Get Radiology Tree app to read full this article<
Get Radiology Tree app to read full this article<
Get Radiology Tree app to read full this article<
Results
Histologic Findings
Get Radiology Tree app to read full this article<
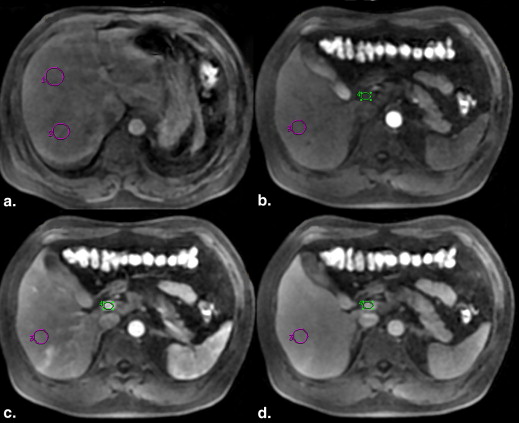
Perfusion MR Imaging Findings
Get Radiology Tree app to read full this article<
Get Radiology Tree app to read full this article<
Get Radiology Tree app to read full this article<
Table 1
Perfusion Parameters in Patients with S0–2 and S3–4 Liver Fibrosis
Parameters S0–2 ( n = 18) S3–4 ( n = 13)Z Value_P_ Value_T_ in (s) 15.90 ± 6.90 23.46 ± 9.75 −2.07 .038T out (s) 95.05 ± 49.04 165.36 ± 20.58 −3.12 .002K up 0.19 ± 0.16 0.05 ± 0.06 −2.98 .003 Signal intensity ratio 1.03 ± 0.07 0.96 ± 0.06 −2.85 .004
Get Radiology Tree app to read full this article<
Discussion
Get Radiology Tree app to read full this article<
Get Radiology Tree app to read full this article<
Get Radiology Tree app to read full this article<
Get Radiology Tree app to read full this article<
Get Radiology Tree app to read full this article<
Get Radiology Tree app to read full this article<
Get Radiology Tree app to read full this article<
Get Radiology Tree app to read full this article<
Get Radiology Tree app to read full this article<
References
1. Jonas E., Hultcrantz R., Slezak P., et. al.: Dynamic 99Tcm-HIDA SPET: non-invasive measuring of intrahepatic bile flow. Description of the method and a study in primary sclerosing cholangitis. Nucl Med Commun 2001; 22: pp. 127-134.
2. Jonas E., Naslund E., Freedman J., et. al.: Measurement of parenchymal function and bile duct flow in primary sclerosing cholangitis using dynamic 99mTc-HIDA SPECT. J Gastroenterol Hepatol 2006; 21: pp. 674-681.
3. Huppertz A., Balzer T., Blakeborough A., et. al.: Improved detection of focal liver lesions at MR imaging: multicenter comparison of gadoxetic acid-enhanced MR images with intraoperative findings. Radiology 2004; 230: pp. 266-275.
4. Zech C.J., Herrmann K.A., Reiser M.F., et. al.: MR imaging in patients with suspected liver metastases: value of liver-specific contrast agent Gd-EOB-DTPA. Magn Reson Med Sci 2007; 6: pp. 43-52.
5. Clement O., Siauve N., Lewin M., et. al.: Contrast agents in magnetic resonance imaging of the liver: present and future. Biomed Pharmacother 1998; 52: pp. 51-58.
6. Schuhmann-Giampieri G.: Liver contrast media for magnetic resonance imaging. Interrelations between pharmacokinetics and imaging. Invest Radiol 1993; 28: pp. 753-761.
7. Hamm B., Staks T., Muhler A., et. al.: Phase I clinical evaluation of Gd-EOB-DTPA as a hepatobiliary MR contrast agent: safety, pharmacokinetics, and MR imaging. Radiology 1995; 195: pp. 785-792.
8. Verloh N., Haimerl M., Zeman F., et. al.: Assessing liver function by liver enhancement during the hepatobiliary phase with Gd-EOB-DTPA-enhanced MRI at 3 Tesla. Eur Radiol 2014; 24: pp. 1013-1019.
9. Nilsson H., Blomqvist L., Douglas L., et. al.: Assessment of liver function in primary biliary cirrhosis using Gd-EOB-DTPA-enhanced liver MRI. HPB (Oxford) 2010; 12: pp. 567-576.
10. Kamimura K., Fukukura Y., Yoneyama T., et. al.: Quantitative evaluation of liver function with T1 relaxation time index on Gd-EOB-DTPA-enhanced MRI: comparison with signal intensity-based indices. J Magn Reson Imaging 2014; 40: pp. 884-889.
11. Hagiwara M., Rusinek H., Lee V.S., et. al.: Advanced liver fibrosis: diagnosis with 3D whole-liver perfusion MR imaging–initial experience. Radiology 2008; 246: pp. 926-934.
12. Sourbron S., Sommer W.H., Reiser M.F., et. al.: Combined quantification of liver perfusion and function with dynamic gadoxetic acid-enhanced MR imaging. Radiology 2012; 263: pp. 874-883.
13. Saito K., Ledsam J., Sourbron S., et. al.: Assessing liver function using dynamic Gd-EOB-DTPA-enhanced MRI with a standard 5-phase imaging protocol. J Magn Reson Imaging 2013; 37: pp. 1109-1114.
14. Saito K., Ledsam J., Sourbron S., et. al.: Measuring hepatic functional reserve using low temporal resolution Gd-EOB-DTPA dynamic contrast-enhanced MRI: a preliminary study comparing galactosyl human serum albumin scintigraphy with indocyanine green retention. Eur Radiol 2014; 24: pp. 112-119.
15. Batts K.P., Ludwig J.: Chronic hepatitis: an update on terminology and reporting. Am J Surg Pathol 1995; 19: pp. 1409-1417.
16. Verloh N., Haimerl M., Rennert J., et. al.: Impact of liver cirrhosis on liver enhancement at Gd-EOB-DTPA enhanced MRI at 3 Tesla. Eur J Radiol 2013; 82: pp. 1710-1715.
17. Gulberg V., Haag K., Rossle M., et. al.: Hepatic arterial buffer response in patients with advanced cirrhosis. Hepatology 2002; 35: pp. 630-634.
18. Orrego H., Blendis L.M., Crossley I.R., et. al.: Correlation of intrahepatic pressure with collagen in the Disse space and hepatomegaly in humans and in the rat. Gastroenterology 1981; 80: pp. 546-556.
19. Martinez-Hernandez A.: The hepatic extracellular matrix. II. Electron immunohistochemical studies in rats with CCl4-induced cirrhosis. Lab Invest 1985; 53: pp. 166-186.
20. Van Beers B.E., Leconte I., Materne R., et. al.: Hepatic perfusion parameters in chronic liver disease: dynamic CT measurements correlated with disease severity. AJR Am J Roentgenol 2001; 176: pp. 667-673.
21. Vogl T.J., Kummel S., Hammerstingl R., et. al.: Liver tumors: comparison of MR imaging with Gd-EOB-DTPA and Gd-DTPA. Radiology 1996; 200: pp. 59-67.
22. Reichen J., Egger B., Ohara N., et. al.: Determinants of hepatic function in liver cirrhosis in the rat. J Clin Invest 1988; 82: pp. 2069-2076.
23. Varin F., Huet P.M.: Hepatic microcirculation in the perfused cirrhotic rat liver. J Clin Invest 1985; 76: pp. 1904-1912.
24. Huet P.M., Goresky C.A., Villeneuve J.P., et. al.: Assessment of liver microcirculation in human cirrhosis. J Clin Invest 1982; 70: pp. 1234-1244.
25. Dahlqvist Leinhard O., Dahlström N., Kihlberg J., et. al.: Quantifying differences in hepatic uptake of the liver specific contrast agents Gd-EOB-DTPA and Gd-BOPTA: a pilot study. Eur Radiol 2012; 22: pp. 642-653.
26. Beck F.K., Rosenthal T.C.: Prealbumin: a marker for nutritional evaluation. Am Fam Physician 2002; 65: pp. 1575-1758.
27. Materne R., Smith A.M., Peeters F., et. al.: Assessment of hepatic perfusion parameters with dynamic MRI. Magn Reson Med 2002; 47: pp. 135-142.
28. Sourbron S.P., Buckley D.L.: Tracer kinetic modelling in MRI: estimating perfusion and capillary permeability. Phys Med Biol 2012; 57: pp. R1-R33.
29. Koh T.S., Bisdas S., Koh D.M., et. al.: Fundamentals of tracer kinetics for dynamic contrast-enhanced MRI. J Magn Reson Imaging 2011; 34: pp. 1262-1276.
30. Yoshioka K., Hashimoto S.: Can non-invasive assessment of liver fibrosis replace liver biopsy?. Hepatol Res 2012; 42: pp. 233-240.
31. Do R.K., Rusinek H., Taouli B.: Dynamic contrast-enhanced MR imaging of the liver: current status and future directions. Magn Reson Imaging Clin N Am 2009; 17: pp. 339-349.
32. Geisel D., Lüdemann L., Wagner C., et. al.: Evaluation of gadolinium-EOB-DTPA uptake after portal vein embolization: value of an increased flip angle. Acta Radiol 2014; 55: pp. 149-154.