
This article reviews the central issues that arise in the assessment of diagnostic imaging and computer-assist modalities. The paradigm of the receiver operating characteristic (ROC) curve—the dependence of the true-positive fraction versus the false-positive fraction as a function of the level of aggressiveness of the reader/radiologist toward a positive call—is essential to this field because diagnostic imaging systems are used in multiple settings, including controlled laboratory studies in which the prevalence of disease is different from that encountered in a study in the field. The basic equation of statistical decision theory is used to display how readers can vary their level of aggressiveness according to this diagnostic context. Most studies of diagnostic modalities in the last 15 years have demonstrated not only a range of levels of reader aggressiveness, but also a range of level of reader performance. These characteristics require a multivariate approach to ROC analysis that accounts for both the variation of case difficulty and the variation of reader skill in a study. The resulting paradigm is called the multiple-reader, multiple-case ROC paradigm. Highlights of historic as well as contemporary work in this field are reviewed. Many practical issues related to study design and resulting statistical power are included, together with recent developments and availability of analytical software.
The subject of this article is the assessment of medical imaging systems and computer-assist devices that are used with medical imaging systems. This article is an attempt to represent the scope of consensus that can be discovered in the field at present, to sketch topics that are the subjects of current work-in-progress, and to point to the horizon as it appears from our present vantage point. The article is thus a continuation and major extension of several earlier ones on the same topics ( ).
In this article, a “computer-assist device” (CAD) refers to a computer algorithm that is used in combination with an imaging system as an aid to the human reader of images for the purpose of detecting or classifying disease.
When one imaging technology is to be used in conjunction with another, it is possible for them to be used either sequentially or in parallel. If they are used in parallel, they may be thought of as complementary in some sense. The concept of complementary tests has a formal meaning in the field of clinical laboratory tests and requires the specification of a combining rule. This concept has not been formalized in medical imaging. If results of two (or more) imaging modalities used in parallel are to be “fused” in some way to obtain a single diagnostic test output, the fused test result can be considered a single modality and assessed according to the approaches described here.
When two modalities are to be used sequentially, the second is typically used only when there is ambiguity or some other form of incompleteness in the first result. The second is then said to function as an “adjunct” to the first imaging modality. That is, it is intended to be used as an “add-on” to the first imaging system in the manner of a “piggy-back” for the purpose of incrementing the original diagnostic information. Sensitive measurement methodology is available to assess this incremental change, and companies developing new imaging technologies in fields where there is already an established technology thus often consider the adjunctive mode at their entry into the regulatory process.
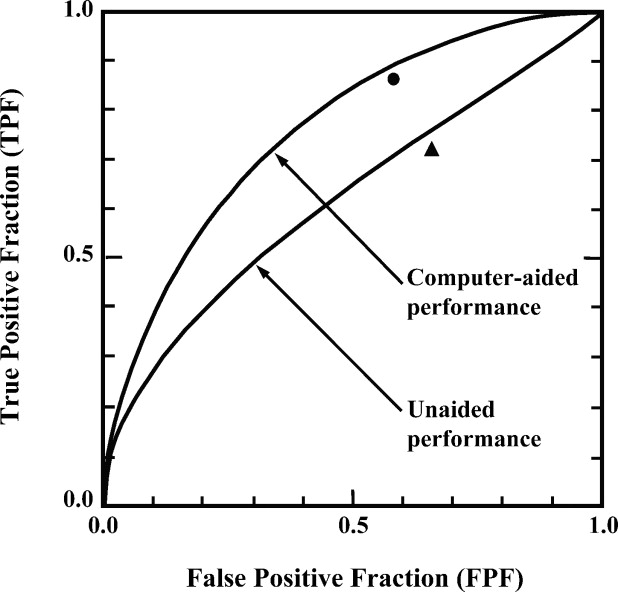
Contemporary developments in the field of medical imaging include not only new imaging hardware, but also software algorithms whose task is to assist the human reader to detect or diagnose disease from the images. Such algorithms are said to function adjunctively, in the sense described previously. That is, the dominant mode of operation for these algorithms is to assist the reader on a second pass, after the reader has finished his or her original reading of the image on a first pass. A typical comparison study then compares the unaided reader with the same reader assisted subsequently by the software algorithm.
Get Radiology Tree app to read full this article<
Get Radiology Tree app to read full this article<
Get Radiology Tree app to read full this article<
Get Radiology Tree app to read full this article<
THE FUNDAMENTAL MEASURES OF PERFORMANCE OF A DIAGNOSTIC TEST
Definitions of Sensitivity, Specificity, and the Receiver (or Relative) Operating Characteristic
Get Radiology Tree app to read full this article<
Get Radiology Tree app to read full this article<
Get Radiology Tree app to read full this article<
Get Radiology Tree app to read full this article<
Get Radiology Tree app to read full this article<
Limitations of a Single (Sensitivity, Specificity) Assessment
Get Radiology Tree app to read full this article<
Get Radiology Tree app to read full this article<
Get Radiology Tree app to read full this article<
Get Radiology Tree app to read full this article<
Expected Benefit Analysis
Get Radiology Tree app to read full this article<
Get Radiology Tree app to read full this article<
E[utility]=TPF×U[TP]×p+FPF×U[FP]×(1−p)+TNF×U[TN]×(1−p)+FNF×U[FN]×p E
[
u
t
i
l
i
t
y
]
=
T
P
F
×
U
[
T
P
]
×
p
+
F
P
F
×
U
[
F
P
]
×
(
1
−
p
)
+
T
N
F
×
U
[
T
N
]
×
(
1
−
p
)
+
F
N
F
×
U
[
F
N
]
×
p
where p is the prevalence of the disease of interest in the population of interest, TNF is the true-negative fraction, and FNF is the false-negative fraction. If one wishes to compare two modalities at their respective (TPF, FPF) points based on this classical approach to decision-making under uncertainty, it is necessary to take account of the appropriate disease prevalence and to have sufficient information to specify the elements of the utility matrix. These and related issues associated with the analysis of expected benefit in the field of medical imaging will be reviewed in this and the following section.
Get Radiology Tree app to read full this article<
Get Radiology Tree app to read full this article<
d(TPF)/d(FPF)=(1−P)(U[TN]−U[FP])P(U[TP]−U[FN]) d
(
TPF
)
/
d
(
FPF
)
=
(
1
−
P
)
(
U
[
TN
]
−
U
[
FP
]
)
P
(
U
[
TP
]
−
U
[
FN
]
)
Get Radiology Tree app to read full this article<
Get Radiology Tree app to read full this article<
A Special Random Test
Get Radiology Tree app to read full this article<
The Complication of Reader Variability
Get Radiology Tree app to read full this article<
Get Radiology Tree app to read full this article<
Get Radiology Tree app to read full this article<
Get Radiology Tree app to read full this article<
Get Radiology Tree app to read full this article<
Get Radiology Tree app to read full this article<
The Hierarchical Model of Efficacy
Get Radiology Tree app to read full this article<
Table 1
The Six-Tiered or Hierarchical Model of Efficacy ( )
Level 1: Technical efficacy. Physical performance measurements of imaging system characteristics; preclinical standalone and bench tests Level 2: Diagnostic accuracy. Sensitivity, specificity, ROC curve, and their summary measures Level 3: Diagnostic thinking. Difference in clinicians’ subjective estimates of diagnostic probabilities, pretest to posttest Level 4: Therapeutic efficacy. Effect of diagnostic imaging or test on therapeutic management of patients Level 5: Patient outcome. Expected value of test information in terms of gains in quality-adjusted life years (QALYs); also, cost per QALY gained Level 6: Societal efficacy. Cost-effectiveness and/or cost-benefit analysis from the societal viewpoint
Get Radiology Tree app to read full this article<
Get Radiology Tree app to read full this article<
Get Radiology Tree app to read full this article<
Get Radiology Tree app to read full this article<
Scales Used for ROC Measurements
Get Radiology Tree app to read full this article<
Get Radiology Tree app to read full this article<
Get Radiology Tree app to read full this article<
Get Radiology Tree app to read full this article<
Get Radiology Tree app to read full this article<
Get Radiology Tree app to read full this article<
Get Radiology Tree app to read full this article<
Get Radiology Tree app to read full this article<
Get Radiology Tree app to read full this article<
Get Radiology Tree app to read full this article<
Get Radiology Tree app to read full this article<
Get Radiology Tree app to read full this article<
Get Radiology Tree app to read full this article<
Get Radiology Tree app to read full this article<
MULTIPLE-READER, MULTIPLE-CASE ROC ANALYSIS
Get Radiology Tree app to read full this article<
Get Radiology Tree app to read full this article<
Get Radiology Tree app to read full this article<
Get Radiology Tree app to read full this article<
Get Radiology Tree app to read full this article<
Get Radiology Tree app to read full this article<
Get Radiology Tree app to read full this article<
Get Radiology Tree app to read full this article<
Get Radiology Tree app to read full this article<
Get Radiology Tree app to read full this article<
Get Radiology Tree app to read full this article<
Get Radiology Tree app to read full this article<
Get Radiology Tree app to read full this article<
Get Radiology Tree app to read full this article<
Get Radiology Tree app to read full this article<
Get Radiology Tree app to read full this article<
Get Radiology Tree app to read full this article<
The MRMC Model of Swets and Pickett
Get Radiology Tree app to read full this article<
Get Radiology Tree app to read full this article<
Get Radiology Tree app to read full this article<
Get Radiology Tree app to read full this article<
Get Radiology Tree app to read full this article<
Var[A2−A1]=2[S2c(1−ρc)+S2br(1−ρbr)/R+S2wr/R]. V
a
r
[
A
2
−
A
1
]
=
2
[
S
c
2
(
1
−
ρ
c
)
+
S
b
r
2
(
1
−
ρ
b
r
)
/
R
+
S
w
r
2
/
R
]
.
Get Radiology Tree app to read full this article<
Get Radiology Tree app to read full this article<
The Model of DBM
Get Radiology Tree app to read full this article<
Get Radiology Tree app to read full this article<
Var[A2−A1]=2[σ2mc+σ2mr/R+σ2mrc/R]. V
a
r
[
A
2
−
A
1
]
=
2
[
σ
m
c
2
+
σ
m
r
2
/
R
+
σ
m
r
c
2
/
R
]
.
Get Radiology Tree app to read full this article<
Get Radiology Tree app to read full this article<
Components of Variance in MRMC Experiments: Scaling a Pivotal Study From Pilot Data
Get Radiology Tree app to read full this article<
Get Radiology Tree app to read full this article<
Var(A2−A1)⇒2[σ2mc(C/C′)+σ2mr/R′+σ2mrc(C/C′)/R′]. V
a
r
(
A
2
−
A
1
)
⇒
2
[
σ
m
c
2
(
C
/
C
′
)
+
σ
m
r
2
/
R
′
+
σ
m
r
c
2
(
C
/
C
′
)
/
R
′
]
.
Get Radiology Tree app to read full this article<
Get Radiology Tree app to read full this article<
Get Radiology Tree app to read full this article<
Some Empirical Rules of Thumb for Sizing ROC Experiments
Get Radiology Tree app to read full this article<
Get Radiology Tree app to read full this article<
Var(Aest)≈Aest(1−Aest)/(2N), V
a
r
(
A
e
s
t
)
≈
A
e
s
t
(
1
−
A
e
s
t
)
/
(
2
N
)
,
where N = N abn = N norm and where A est is the estimate of the mean area under the curve. The approximate factor two in variance reduction compared to the case of a binomial random variable with the same mean value arises from the averaging of sensitivity over the entire range of specificities when the total area is measured. Estimates of sensitivity at a fixed and known specificity are distributed as a binomial random variable. Estimates of percent correct in the classical 2AFC experiment ( ) are also distributed as a binomial random variable in the common experimental paradigm. The variance reduction by the approximate factor of two comes about only when every element of one list of alternatives is compared with every element of the other list. The resulting Mann-Whitney-Wilcoxon statistic ( ) is an average of a large number of correlated binomial random variables. This is an intuitive way to think of the Mann-Whitney-Wilcoxon statistic, the area under the empirical ROC plot, or the result of a 2AFC experiment that takes advantage of every possible pairing.
Get Radiology Tree app to read full this article<
Get Radiology Tree app to read full this article<
Get Radiology Tree app to read full this article<
2/Neff=1/Nabn+1/Nnorm 2
/
N
e
f
f
=
1
/
N
a
b
n
+
1
/
N
n
o
r
m
and used in place of N in Eq 6 for that more general problem. Although Eq 6 and 7 do not have a rigorous formal basis, they serve as practical rules of thumb that may get the study designer inside the ballpark.
Get Radiology Tree app to read full this article<
Get Radiology Tree app to read full this article<
Get Radiology Tree app to read full this article<
Get Radiology Tree app to read full this article<
Get Radiology Tree app to read full this article<
Get Radiology Tree app to read full this article<
THE FULLY CROSSED DESIGN: FINE-TUNING
Get Radiology Tree app to read full this article<
Get Radiology Tree app to read full this article<
Get Radiology Tree app to read full this article<
Get Radiology Tree app to read full this article<
Get Radiology Tree app to read full this article<
Get Radiology Tree app to read full this article<
Get Radiology Tree app to read full this article<
Get Radiology Tree app to read full this article<
Get Radiology Tree app to read full this article<
Get Radiology Tree app to read full this article<
Get Radiology Tree app to read full this article<
LOCATION-SPECIFIC ROC ANALYSIS
Get Radiology Tree app to read full this article<
Get Radiology Tree app to read full this article<
Get Radiology Tree app to read full this article<
Get Radiology Tree app to read full this article<
Get Radiology Tree app to read full this article<
Get Radiology Tree app to read full this article<
Get Radiology Tree app to read full this article<
Get Radiology Tree app to read full this article<
Get Radiology Tree app to read full this article<
Get Radiology Tree app to read full this article<
Get Radiology Tree app to read full this article<
Region-of-Interest Analysis
Get Radiology Tree app to read full this article<
Get Radiology Tree app to read full this article<
Get Radiology Tree app to read full this article<
Get Radiology Tree app to read full this article<
THE PROBLEM OF UNCERTAINTY IN THE TRUTH STATUS
Get Radiology Tree app to read full this article<
Expert Panel as “Truth”?
Get Radiology Tree app to read full this article<
Get Radiology Tree app to read full this article<
Get Radiology Tree app to read full this article<
Get Radiology Tree app to read full this article<
ROC Estimation Without Truth?
Get Radiology Tree app to read full this article<
Get Radiology Tree app to read full this article<
SOME SAMPLING ISSUES
Get Radiology Tree app to read full this article<
Get Radiology Tree app to read full this article<
Get Radiology Tree app to read full this article<
Get Radiology Tree app to read full this article<
Get Radiology Tree app to read full this article<
Get Radiology Tree app to read full this article<
Get Radiology Tree app to read full this article<
READING ORDER EFFECTS
Get Radiology Tree app to read full this article<
Get Radiology Tree app to read full this article<
Get Radiology Tree app to read full this article<
Perhaps the only situation in which reading-order effects are appropriate occurs when both of two conditions are satisfied: 1) a stand-alone imaging modality is to be compared with the combination of that imaging modality and a supplementary modality; and 2) the stand-alone modality is always read before the combination in clinical practice. In this situation, which occurs in assessing some computer-aided diagnostic (CAD) techniques, for example ( ), if the experimental design provides an amount of time between the first and second readings of each image similar to that which would occur in clinical practice, the potential benefit of the first reading to interpretations made from the second reading becomes not a bias, but instead a factor of realistic experimental design.
Get Radiology Tree app to read full this article<
Get Radiology Tree app to read full this article<
RECENT UPGRADES IN ROC SOFTWARE
Get Radiology Tree app to read full this article<
Get Radiology Tree app to read full this article<
Get Radiology Tree app to read full this article<
FUTURE APPLICATIONS OF MULTIVARIATE ROC ANALYSIS
Get Radiology Tree app to read full this article<
Get Radiology Tree app to read full this article<
AFTERWORDS
Get Radiology Tree app to read full this article<
Get Radiology Tree app to read full this article<
ACKNOWLEDGMENTS
Get Radiology Tree app to read full this article<
Get Radiology Tree app to read full this article<
Get Radiology Tree app to read full this article<
REFERENCES
1. Wagner R.F., Beiden S.V., Campbell G., et. al.: Assessment of medical imaging and computer-assist systems: lessons from recent experience. Acad Radiol 2002; 9: pp. 1264-1277.
2. Wagner R.F., Beiden S.V., Campbell G., et. al.: Contemporary issues for experimental design in assessment of medical imaging and computer-assist systems. Proc SPIE 2003; 5034: pp. 213-224.
3. Beiden S.V., Wagner R.F., Doi K., et. al.: Independent versus sequential reading in ROC studies of computer-assist modalities: analysis of components of variance. Acad Radiol 2002; 9: pp. 1036-1043.
4. Dodd L.E., Wagner R.F., Armato S.G., et. al.: Assessment methodologies and statistical issues for computer-aided diagnosis of lung nodules in computed tomography: contemporary research topics relevant to the lung image database consortium (LIDC). Acad Radiol 2004; 11: pp. 462-475.
5. Wagner RF. An overview of contemporary ROC methodology in medical imaging and computer-assist modalities. Tutorial presented at the FDA Radiological Devices Public Panel Meeting of the Medical Devices Advisory Board, February 3, 2004. Available online at: http://www.fda.gov/ohrms/dockets/ac/04/slides/4024s1.htm
6. Houn F., Bright R.A., Bushar H.F., et. al.: Study design in the evaluation of breast cancer imaging technologies. Acad Radiol 2000; 7: pp. 684-692.
7. Metz C.E.: Basic principles of ROC analysis. Semin Nucl Med 1978; 8: pp. 283-298.
8. Zweig M.H., Campbell G.: Receiver operating characteristic plots: a fundamental evaluation tool in clinical medicine. Clin Chem 1993; 39: pp. 561-577.
9. Gur D., Rockette H.E., Armfield D.R., et. al.: Prevalence effect in a laboratory environment. Radiology 2003; 228: pp. 10-14.
10. Patton D.D.: Introduction to clinical decision making. Semin Nucl Med 1978; VIII: pp. 273-282.
11. Green D.M., Swets J.A.: Signal detection theory and psychophysics (revised ed).1974.KriegerHuntington, NY
12. Wagner R.F., Beam C.A., Beiden S.V.: Reader variability in mammography and its implications for expected utility over the population of readers and cases. Med Decis Making 2004; 24: pp. 561-572.
13. Metz CE, Pesce L. Private communication of draft manuscript on general principles motivating the use of “proper” binormal ROC curves. June 2006.
14. Beam C., Layde P.M., Sullivan D.C.: Variability in the interpretation of screening mammograms by US radiologists. Arch Intern Med 1996; 156: pp. 209-213.
15. American College of Radiology. Breast imaging recording and data system (BI-RADS ® ). Reston, Va: American College of Radiology, 1993. First edition 1993; currently in fourth edition 2003.
16. Biggerstaff B.J.: Comparing diagnostic tests: a simple graphic using likelihood ratios. Stat Med 2000; 19: pp. 649-663.
17. Fryback D.G., Thornbury J.R.: The efficacy of diagnostic imaging. Med Decis Making 1991; 11: pp. 88-94.
18. NCRP Commentary No. 13. An introduction to efficacy in diagnostic radiology and nuclear medicine. Bethesda, Md: National Council on Radiation Protection and Measurements, 1995.
19. Federal Food, Drug, and Cosmetic Act. Chapter V—drugs and devices; subchapter A—drugs and devices. Section 513 [US Code 360c. Washington, DC: US GPO. Available online at http://www.fda.gov/opacom/laws/fdcact/fdcact5a2.htm
20. Swets J.A., Pickett R.M., Whitehead S.F., et. al.: Assessment of diagnostic technologies. Science 1979; 205: pp. 753-759.
21. Swets J.A., Pickett R.M.: Evaluation of Diagnostic Systems.1982.Academic Press, New YorkNew York
22. Rockette H.E., Gur D., Metz C.E.: The use of continuous and discrete confidence judgements in receiver operating characteristic studies of diagnostic imaging techniques. Invest Radiol 1992; 27: pp. 169-172.
23. Wagner R.F., Beiden S.V., Metz C.E.: Continuous versus categorical data for ROC analysis: some quantitative considerations. Acad Radiol 2001; 8: pp. 328-334.
24. Jiang Y., Nishikawa R.M., Schmidt R.A., et. al.: Improving breast cancer diagnosis with computer-aided diagnosis. Acad Radiol 1999; 6: pp. 22-33.
25. Wagner R.F.: Toward a strategy for consensus development on a quantitative approach to medical imaging. Acad Radiol 2006; 13: pp. 137-139.
26. Pisano E.D., Gatsonis C., Hendrick E., et. al., Digital Mammographic Imaging Screening Trial (DMIST) Investigators Group: Diagnostic performance of digital versus film mammography for breast-cancer screening. N Engl J Med 2005; 353: pp. 1773-1783.
27. Cole P., Morrison A.S.: Basic issues in population screening for cancer. J Natl Cancer Inst 1980; 64: pp. 1263-1272.
28. Baker S.G., Pinsky P.: A proposed design and analysis for comparing digital and analog mammography: special ROC methods for cancer screening. J Am Stat Assoc 2001; 96: pp. 421-428.
29. Hanley J.A.: Receiver operating characteristic (ROC) methodology: the state of the art. Crit Rev Diagn Imaging 1989; 23: pp. 307-335.
30. Dorfman D.D., Berbaum K.S., Metz C.E.: Receiver operating characteristic rating analysis: generalization to the population of readers and patients with the jackknife method. Invest Radiol 1992; 27: pp. 723-731.
31. Gatsonis C.A., Begg C.B., Wieand S.: Advances in statistical methods for diagnostic radiology: a symposium. Acad Radiol 1995; 2: pp. S1-S84.
32. University of Iowa. ROC software. Available online at: http://perception.radiology.uiowa.edu/
33. The University of Chicago. ROC software. Available online at: http://www-radiology.uchicago.edu/krl/KRL_ROC/software_index6.htm
34. Roe C.A., Metz C.E.: Dorfman-Berbaum-Metz method for statistical analysis of multireader, multimodality receiver operating characteristic data: validation with computer simulation. Acad Radiol 1997; 4: pp. 298-303.
35. Dorfman D.D., Berbaum K.S., Lenth R.V., et. al.: Monte Carlo validation of a multireader method for receiver operating characteristic discrete rating data: factorial experimental design. Acad Radiol 1998; 5: pp. 591-602.
36. Obuchowski N.A.: Multireader, multimodality receiver operating characteristic curve studies: hypothesis testing and sample size estimation using an analysis of variance approach with dependent observations. Acad Radiol 1995; 2: pp. S22-S29.
37. Obuchowski N.A., Rockette H.E.: Hypothesis testing of the diagnostic accuracy for multiple diagnostic tests: an ANOVA approach with dependent observations. Commun Stat Simul Comput 1995; 24: pp. 285-308.
38. Cleveland Clinic. Quantitative health sciences. Available online at: http://www.bio.ri.ccf.org/html/rocanalysis.html
39. Toledano A., Gatsonis C.A.: Regression analysis of correlated receiver operating characteristic data. Acad Radiol 1995; 2: pp. S30-S36.
40. Toledano A., Gatsonis C.: Ordinal regression methodology for ROC curves derived from correlated data. Stat Medi 1996; 15: pp. 1807-1826.
41. Song H.H.: Analysis of correlated ROC areas in diagnostic testing. Biometrics 1997; 53: pp. 370-382.
42. Ishwaran H., Gatsonis C.A.: A general class of hierarchical ordinal regression models with applications to correlated ROC analysis. Can J Stat 2000; 28: pp. 731-750.
43. Beiden S.V., Wagner R.F., Campbell G.: Components-of-variance models and multiple-bootstrap experiments: an alternative method for random-effects receiver operating characteristic analysis. Acad Radiol 2000; 7: pp. 341-349.
44. Beiden S.V., Wagner R.F., Campbell G., et. al.: Components-of-variance models for random-effects ROC analysis: The case of unequal variance structures across modalities. Acad Radiol 2001; 8: pp. 605-615.
45. Beiden S.V., Wagner R.F., Campbell G., et. al.: Analysis of uncertainties in estimates of components of variance in multivariate ROC analysis. Acad Radiol 2001; 8: pp. 616-622.
46. Obuchowski N.A., Beiden S.V., Berbaum K.S., et. al.: Multi-reader, multi-case ROC analysis: an empirical comparison of five methods. Acad Radiol 2004; 11: pp. 980-995.
47. Toledano A.: Three methods for analyzing correlated ROC curves: A comparison in real data sets from multi-reader, multi-case studies with a factorial design. Stat Med 2003; 22: pp. 2919-2933.
48. Song X., Zhou X.-H.: A marginal model approach for analysis of multi-reader multi-test receiver operating characteristic (ROC) data. Biostatistics 2005; 6: pp. 303-312.
49. Hillis S.L., Obuchowski N.A., Schartz K.M., et. al.: A comparison of the Dorfman-Berbaum-Metz and Obuchowski-Rockette methods for receiver operating characteristic (ROC) data. Stat Med 2005; 24: pp. 1579-1607.
50. Hillis S.L., Berbaum K.S.: Monte Carlo validation of the Dorfman-Berbaum-Metz method using normalized pseudovalues and less data-based model simplification. Acad Radiol 2005; 12: pp. 1534-1541.
51. Hillis S.L.: A comparison of denominator degrees of freedom methods for multiple observer ROC analysis. Stat Med 2007; 26: pp. 596-619.
52. Hillis SL, Berbaum KS. Recent developments in the Dorfman-Berbaum-Metz (DBM) procedure for multi-reader ROC study analysis. Presented at Medical Image Perception Society (MIPS) Conference XI, September 2005, Windermere, UK.
53. Barrett HH, Kupinski MA, Clarkson E. Probabilistic foundations of the MRMC method. In: Eckstein MP, Jiang Y, eds. Medical imaging: image perception, observer performance, and technology assessment. Proc. of the SPIE 5749. Bellingham, WA: 2005; 21–31.
54. Clarkson E., Kupinski M.A., Barrett H.H.: A probabilistic model for the MRMC method. Acad Radiol 2006; 13: pp. 1410-1421.
55. Kupinski M.A., Clarkson E., Barrett H.H.: A probabilistic model for the MRMC method. Acad Radiol 2006; 13: pp. 1422-1430.
56. Gallas B.D.: One-shot estimate of MRMC variance: AUC. Acad Radiol 2006; 13: pp. 353-362.
57. Bamber D.: The area above the ordinal dominance graph and the area below the receiver operating characteristic curve. J Math Psych 1975; 12: pp. 387-415.
58. Campbell G, Douglas MA, Bailey JJ. Nonparametric comparison of two tests of cardiac function on the same patients using the entire ROC curve. Proc Computers Cardiol 1988; 267–270. Published by the IEEE Computer Society Press. Washington, DC, September 25–28, 1988:.
59. Bandos AI, Rockette HE, Gur D. Exact bootstrap variances of the area under the ROC curve. Commun Sta A—Theory 2007; 36 (13) in press.
60. Gallas BD, Bandos A, Kupinski M, et al. A framework for random-effects ROC analysis: biases with the bootstrap and other variance estimators. Stat Med. Submitted to Stat Med.
61. Samuelson FW, Wagner RF. Bootstrapped MRMC confidence intervals. In: Eckstein MP, Jiang Y, eds. Proc SPIE 5749, Med Imaging 2005: image perception, observer performance, and technology assessment. Bellingham, WA: 2005; 15–20.
62. Obuchowski N.A.: Multireader receiver operating characteristic studies: a comparison of study designs. Acad Radiol 1995; 2: pp. 709-716.
63. ICRU (submitted 2006; in press 2007). ROC analysis in medical imaging. Report Committee # TBD, International Commission for Radiological Units and Measurements (ICRU) Bethesda, MD.
64. DeLong E.R., DeLong D.M., Clarke-Pearson D.L.: Comparing the areas under two or more correlated receiver operating characteristic curves: a nonparametric approach. Biometrics 1988; 44: pp. 837-845.
65. Hanley J.A., McNeil B.J.: The meaning and use of the area under the receiver operating characteristic (ROC) curve. Radiology 1982; 143: pp. 29-36.
66. McClish D.K.: Analyzing a portion of the ROC curve. Med Decis Making 1989; 9: pp. 190-195.
67. Wieand S., Gail M.H., James B.R., et. al.: A family of nonparametric statistics for comparing diagnostic markers with paired and unpaired data. Biometrika 1989; 76: pp. 585-592.
68. Jiang Y., Metz C.E., Nishikawa R.M.: A receiver operating characteristic partial area index for highly sensitive diagnostic tests. Radiology 1996; 201: pp. 745-750.
69. Roe C.A., Metz C.E.: Variance-component modeling in the analysis of receiver operating characteristic index estimates. Acad Radiol 1997; 4: pp. 587-600.
70. Hillis S.L., Berbaum K.S.: Power estimation for the Dorfman-Berbaum-Metz method. Acad Radiol 2004; 11;: pp. 1260-1273.
71. Private communication, originally noted by CE Metz and supported by unpublished calculations of Chan HP, Sahiner B, Wagner RF, et al, 1998.
72. Greenhouse S.W., Mantel N.: The evaluation of diagnostic tests. Biometrics 1950; 6: pp. 399-412.
73. Metz C.E.: Fundamental ROC analysis.Beutel J.Kundel H.L.VanMetter R.L.2000.SPIE PressPhysics and psychophysics. Bellingham, WA:pp. 751-769.
74. Kondratovich M. Personal communication of unpublished report to RF Wagner, 1999.
75. Blume JD. Bounding sample size projections for the area under a ROC curve. Draft report available online at http://alexander.stat.brown.edu/∼jblume/slides/ .
76. Metz CE, Pesce L. Personal communication 2006.
77. Metz C.E., Shen J.H.: Gains in accuracy from replicated readings of diagnostic images: prediction and assessment in terms of ROC analysis. Med Decis Making 1992; 12: pp. 60-75.
78. Metz C.E.: Statistical analysis of ROC data in evaluating diagnostic performance.Herbert D.E.Myers R.H.Multiple regression analysis: applications in the health sciences.1986.American Institute of Physics: American Association of Physicists in MedicineNew York:pp. 365-384.
79. Zhou X.-H., Obuchowski N.A., McClish D.K.: Statistical methods in diagnostic medicine (Wiley series in probability and statistics).2002.Wiley-InterscienceNew York
80. Rockette H.E., Campbell W.L., Britton C.A., et. al.: Empiric assessment of parameters that affect the design of multireader receiver operating characteristic studies. Acad Radiol 1999; 6: pp. 723-729.
81. Wagner R.F., Beiden S.V., Campbell G.: Multiple-reader studies, digital mammography, computer-aided diagnosis—and the Holy Grail of imaging physics (I). Proc SPIE 2001; 4320: pp. 611-618.
82. Metz C.E.: Some practical issues of experimental design and data analysis in radiological ROC studies. Invest Radiol 1989; 24: pp. 234-245.
83. Kobayashi T., Xu X.-W., MacMahon H., et. al.: Effect of a computer-aided diagnosis scheme on radiologists’ performance in detection of lung nodules on radiographs. Radiology 1996; 199: pp. 843-848.
84. Nishikawa R.M., Giger M.L., Schmidt R.A., et. al.: Can computer-aided diagnosis (CAD) help radiologists find mammographically missed screening cancers. Proc SPIE Med Imaging 2001; 4324: pp. 56-63.
85. Beiden S.V., Wagner R.F., Doi K., et. al.: Independent versus sequential reading in ROC studies of computer-assist modalities: analysis of components of variance. Acad Radiol 2002; 9: pp. 1036-1043.
86. Freedman M, Lo S-C B, Lure F, et al. Design choices in the Deus Technologies RS-2000 lung cancer on chest radiograph ROC clinical trial. Presented at Medical Image Perception Conference IX, Warrenton, Va, September 20–23, 2001.
87. Gifford H.C., King M.A.: Case-sampling in LROC: a Monte Carlo analysis. Proc SPIE Med Imaging 2000; 4324: pp. 143-152.
88. Dev Chakraborty. What is FROC? Available online at: http://www.devchakraborty.com .
89. Egan J.P., Greenburg G.Z., Schulman A.I.: Operating characteristics, signal detectability and the method of free response. J Acoust Soc Am 1961; 33: pp. 993-1007.
90. Starr S.J., Metz C.E., Lusted L.B., et. al.: Visual detection and localization of radiographic images. Radiology 1975; 116: pp. 533-538.
91. Bunch P.C., Hamilton J.F., Sanderson G.K., et. al.: A free-response approach to the measurement and characterization of radiographic-observer performance. J Appl Photogr Eng 1978; 4: pp. 166-171.
92. Chakraborty D.P.: Maximum likelihood analysis of free-response receiver operating characteristic (FROC) data. Phys 1989; 16: pp. 561-568.
93. Chakraborty D.P., Winter L.: Free-response methodology: alternate analysis and a new observer-performance experiment. Radiology 1990; 174: pp. 873-881.
94. Swensson R.G.: Unified measurement of observer performance in detecting and localizing target objects on images. Med Phys 1996; 23: pp. 1709-1725.
95. Metz CE. Evaluation of digital mammography by ROC analysis. In: Doi K, ed. Digital mammography ‘96. Amsterdam: Elsevier Science, 1996.
96. Chakraborty D.P.: The FROC, AFROC and DROC variants of the ROC analysis.Beutel J.Kundel H.L.Van Metter R.L.Handbook of medical imaging.2000.SPIE PressBellingham, WA:pp. 771-796.
97. Chakraborty D.: Statistical power in observer performance studies: s comparison of the ROC and free-response methods in tasks involving localization. Acad Radiol 2002; 9: pp. 147-156.
98. Edwards D.C., Kupinski M.A., Metz C.E., et. al.: Maximum likelihood fitting of FROC curves under an initial-detection-and-candidate-analysis model. Med Phys 2002; 29: pp. 2861-2870.
99. Chakraborty D.P., Berbaum K.S.: Observer studies involving detection and localization: Modeling, analysis, and validation. Med Phys 2004; 31: pp. 2313-2330.
100. Zheng B., Chakraborty D.P., Rockette H.E., et. al.: A comparison of two data analyses from two observer performance studies using Jackknife ROC and JAFROC. Med Phys 2005; 32: pp. 1031-1034.
101. Chakraborty D.P.: A search model and figure of merit for observer data acquired according to the free-response paradigm. Phys Med Biol 2006; 51: pp. 3449-3462.
102. Chakraborty D.P.: ROC curves predicted by a model of visual search. Phys Med Biol 2006; 51: pp. 3463-3482.
103. Nishikawa R.M., Yarusso L.M.: Variations in measured performance of CAD schemes due to database composition and scoring protocol. Proc SPIE 1998; 3338: pp. 840-844.
104. Giger M.L.: Current issues in CAD for mammography.Doi K.Giger M.L.Nishikawa R.M., et alDigital mammography ‘96.1996.Elsevier Science B.VAmsterdam:pp. 53-59.
105. Kallergi M., Carney G.M., Gaviria J.: Evaluating the performance of detection algorithms in digital mammography. Med Phys 1999; 26: pp. 267-275.
106. Kundel H.L., Nodine C.F.: Modeling visual search during mammogram viewing. Proc SPIE Med Imaging 2004; 5372: pp. 110-115.
107. Dorfman D.D., Berbaum K.S.: A contaminated binormal model for ROC data. Acad Radiol 2000; 7: pp. 427-437.
108. Samuelson FW, Petrick N. Comparing image detection algorithms using resampling. Proceedings of the 2006 IEEE International Symposium on Biomedical Imaging 2006; 1312–1315.
109. Bornefalk H., Bornefalk Hermansson A.: On the comparison of FROC curves in mammography CAD systems. Med Phys 2005; 32: pp. 412-417.
110. Obuchowski N.A., Lieber M.L., Powell K.A.: Data analysis for detection and localization of multiple abnormalities with application to mammography. Acad Radiol 2000; 7: pp. 516-525.
111. Rutter C.M.: Bootstrap estimation of diagnostic accuracy with patient-clustered data. Acad Radiol 2000; 7: pp. 413-419.
112. Chakraborty D., Obuchowski N.A., Lieber M.L., et. al.: Point-counterpoint. Acad Radiol 2000; 7: pp. 553-556.
113. Chakraborty DP. Personal communication to RF Wagner, 2004.
114. Armato S.G., McLennan G., McNitt-Gray M.F., et. al.: Lung Image Database Consortium: developing a resource for the medical imaging research community. Radiology 2004; 232: pp. 739-748.
115. Revesz G., Kundel H.L., Bonitatibus M.: The effect of verification on the assessment of imaging techniques. Invest Radiol 1983; 18: pp. 194-198.
116. Miller D.P., O’Shaughnessy K.F., Wood S.A., et. al.: Gold standards and expert panels: A pulmonary nodule case study with challenges and solutions. Proc SPIE Med Imaging 2004; 5372: pp. 173-184.
117. Henkelman R.M., Kay I., Bronskill M.J.: Receiver operator characteristic (ROC) analysis without truth. Med Decis Making 1990; 10: pp. 24-29.
118. Begg C.B., Metz C.E.: Consensus diagnoses and “gold standards.”. Med Decis Making 1990; 10: pp. 29-30.
119. Beiden S.V., Campbell G., Meier K.L., et. al.: On the problem of ROC analysis without truth: the EM algorithm and the information matrix. Proc SPIE 2000; 3981: pp. 126-134.
120. Zhou X.-H.: Correcting for verification bias in studies of a diagnostic test’s accuracy. Stat Methods Med Res 1998; 7: pp. 337-353.
121. Zhou X.-H.: Comparing correlated areas under the ROC curves of two diagnostic tests in the presence of verification bias. Biometrics 1998; 54: pp. 453-470.
122. Premarket applications for digital mammography systems; final guidance for industry and FDA. US Department of Health and Human Services, Food and Drug Administration, Center for Devices and Radiological Health (February 4, 1999). Available online at www.fda.gov/cdrh/ode/guidance/983.html
123. Gur D., Rockette H.E., Warfel T.E., et. al.: From the laboratory to the clinic: the ‘prevalence effect’. Acad Radiol 2003; 10: pp. 1324-1326.
124. Kundel H.L., Polansky M.: Comparing observer performance with mixture distribution analysis when there is no external gold standard. Proc SPIE 1998; 3340: pp. 78-84.
125. Begg C.B., McNeil B.J.: Assessment of radiologic tests: control of bias and other design considerations. Radiology 1988; 167: pp. 565-569.
126. American College of Radiology Imaging Network. Available online at: http://www.acrin.org/committees.html
127. Metz CE, Pesce L. Personal communication of expected availability of ROC software upgrades, February 2006.
128. Metz C.E., Pan X.: “Proper” binormal ROC curves: theory and maximum-likelihood estimation. J Math Psychol 1999; 43: pp. 1-33.
129. Beiden S.V., Maloof M.A., Wagner R.F.: A general model for finite-sample effects in training and testing of competing classifiers. IEEE Trans Pattern Anal Machine Intell (TPAMI) 2003; 25: pp. 1561-1569.
130. Yousef WA, Wagner RF, Loew MH. Comparison of nonparametric methods for assessing classifier performance in terms of ROC parameters. In: Applied Imagery Pattern Recognition Workshop, 2004. Published by the IEEE Computer Society. Proceedings 33rd AIPR conference, 2004; 190–195.
131. Yousef W.A., Wagner R.F., Loew M.H.: Estimating the uncertainty in the estimated mean area under the ROC curve of a classifier. Pattern Recogn Lett 2005; 26: pp. 2600-2610.
132. Yousef W.A., Wagner R.F., Loew M.H.: Assessing classifiers from two independent data sets using ROC analysis: a nonparametric approach. IEEE Trans Patt Anal Mach Intell (TPAMI) 2006; 28: pp. 1809-1817.
133. Yousef WA, Wagner RF, Loew MH. The partial area under the ROC curve: its properties and nonparametric estimation for assessing classifier performance. Submitted to IEEE Patt Anal Mach Intell.
134. Gur D., Wagner R.F., Chan H.-P.: On the repeated use of databases for testing incremental improvement of computer-aided detection schemes. Acad Radiol 2004; 11: pp. 103-105.
135. Pepe M.S.: The statistical evaluation of medical tests for classification and prediction.2003.Oxford University PressNew York
136. Interagency Council on Biomedical Imaging in Oncology. Available online at: http://cancer.gov/dctd/icbio