
Rationale and Objectives
Studies that evaluate the lung nodule detection performance of radiologists or computerized methods depend on an initial inventory of the nodules within the thoracic images (the “truth”). The purpose of this study was to analyze ( ) variability in the “truth” defined by different combinations of experienced thoracic radiologists and ( ) variability in the performance of other experienced thoracic radiologists based on these definitions of “truth” in the context of lung nodule detection in computed tomographic (CT) scans.
Materials and Methods
Twenty-five thoracic CT scans were reviewed by four thoracic radiologists, who independently marked lesions they considered to be nodules ≥3 mm in maximum diameter. Panel “truth” sets of nodules were then derived from the nodules marked by different combinations of two and three of these four radiologists. The nodule detection performance of the other radiologists was evaluated based on these panel “truth” sets.
Results
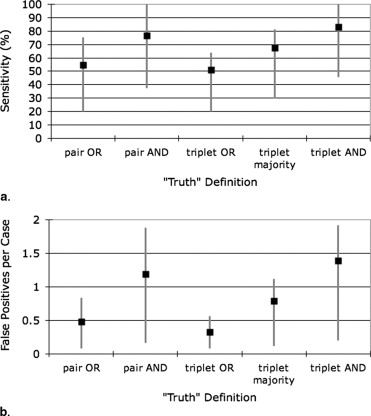
The number of “true” nodules in the different panel “truth” sets ranged from 15 to 89 (mean 49.8 ± 25.6). The mean radiologist nodule detection sensitivities across radiologists and panel “truth” sets for different panel “truth” conditions ranged from 51.0 to 83.2%; mean false-positive rates ranged from 0.33 to 1.39 per case.
Conclusions
Substantial variability exists across radiologists in the task of lung nodule identification in CT scans. The definition of “truth” on which lung nodule detection studies are based must be carefully considered, because even experienced thoracic radiologists may not perform well when measured against the “truth” established by other experienced thoracic radiologists.
Studies that evaluate the lung nodule detection performance of computer-aided diagnostic (CAD) methods or of different groups of radiologists fundamentally depend on an initial inventory of the nodules in the images. This assessment of “truth” is usually provided by a panel of experienced thoracic radiologists who review the images used in the study to identify lesions that are defined as targets of the study ( ). Change the “truth,” however, and the performance of the CAD method or radiologist under evaluation necessarily changes ( ). The “truth” for a specific study is affected by a number of factors, including the composition of the expert panel ( ), the defined targets of the study, the instructions provided to panel members, and the manner in which individual panel members interpret the defined study targets and instructions.
Lung nodules as a study target are especially subjective. The term nodule refers to abnormalities that span a wide spectrum, which is itself a subset of a broader spectrum of lesions that can be described as “focal abnormalities” ( ). Varying interpretations of these spectra by different radiologists lead to variability in radiologists’ identification of lung nodules ( ). Compound variability in the definition of “nodule” with subjective qualifying attributes, such as minimum size, radiographic solidity, or actionability, and the potential for discordant interpretation is further magnified. The determination that a nodule is present at a specific location is almost always based on image features alone as interpreted by a radiologist, without independent objective verification, given the inherent limitations of obtaining lung tissue or postmortem data in humans. According to Dodd et al ( ), “dependence on expert opinion derived from the very same images used for the assessment of the imaging system or algorithm leads to an additional source of uncertainty that is not present when an independent source of ‘ground truth’ is available.” These investigators suggest that some form of resampling of the expert panel may be useful to understand this additional uncertainty ( ).
Get Radiology Tree app to read full this article<
Get Radiology Tree app to read full this article<
Get Radiology Tree app to read full this article<
Get Radiology Tree app to read full this article<
Materials and methods
Patient Image Data
Get Radiology Tree app to read full this article<
Image Evaluation
Get Radiology Tree app to read full this article<
Get Radiology Tree app to read full this article<
Get Radiology Tree app to read full this article<
Get Radiology Tree app to read full this article<
Evaluation of Radiologist Performance Based on the “Truth” of the Other Radiologists
Get Radiology Tree app to read full this article<
Get Radiology Tree app to read full this article<
Get Radiology Tree app to read full this article<
Results
Number of Nodules
Get Radiology Tree app to read full this article<
Table 1
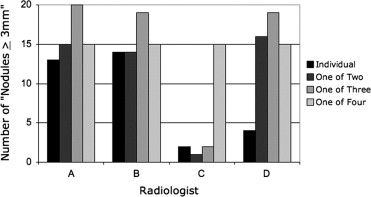
The Number of Nodules Identified by Each Radiologist
No. of Nodules Mean ± SD Radiologist A 63 49.8 ± 20.2 Radiologist B 62 Radiologist C 20 Radiologist D 54
SD, standard deviation.
Get Radiology Tree app to read full this article<
Variability in “Truth” Sets
Get Radiology Tree app to read full this article<
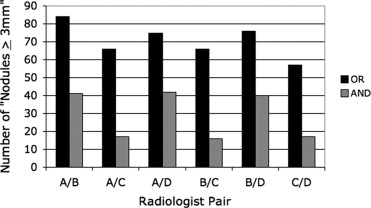
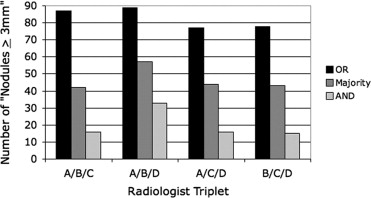
Table 2
The Number of Nodules Contained in the Panel “Truth” Sets Obtained from Different Combinations of Radiologists under Different Conditions
Panel “Truth” Set No. of Nodules Mean ± SD Radiologist pairs (OR/AND) Radiologists A/B 84/41 70.7 ± 9.5/28.8 ± 13.4 Radiologists A/C 66/17 Radiologists A/D 75/42 Radiologists B/C 66/16 Radiologists B/D 76/40 Radiologists C/D 57/17 Radiologist triplets (OR/Majority/AND) Radiologists A/B/C 87/42/16 82.8 ± 6.1/46.5 ± 7.0/20.0 ± 8.7 Radiologists A/B/D 89/57/33 Radiologists A/C/D 77/44/16 Radiologists B/C/D 78/43/15
SD, standard deviation.
Get Radiology Tree app to read full this article<
Get Radiology Tree app to read full this article<
Get Radiology Tree app to read full this article<
Get Radiology Tree app to read full this article<
Radiologist Performance
Get Radiology Tree app to read full this article<
Table 3
Radiologist Nodule-detection Sensitivities and False-positive Rates across Radiologists and Panel “Truth” Sets for Each Panel “Truth” Condition
Panel “Truth” Condition Sensitivity False-positive Rate (False Positives/Case) Minimum Maximum Mean ± SD Minimum Maximum Mean ± SD Radiologist pairs (logical OR) 20.2% 75.4% 54.8 ± 19.9% 0.08 0.84 0.48 ± 0.31 Radiologist pairs (logical AND) 37.5% 100.0% 76.7 ± 24.1% 0.16 1.88 1.19 ± 0.70 Radiologist triplets (logical OR) 20.2% 64.1% 51.0 ± 20.7% 0.08 0.56 0.33 ± 0.25 Radiologist triplets (majority) 29.8% 81.4% 67.4 ± 25.1% 0.12 1.12 0.79 ± 0.47 Radiologist triplets (logical AND) 45.5% 100.0% 83.2 ± 25.4% 0.20 1.92 1.39 ± 0.81
SD, standard deviation.
Get Radiology Tree app to read full this article<
Get Radiology Tree app to read full this article<
Table 4
Individual Radiologist Nodule-detection Sensitivities (in percentages) Based on Different Pairwise Panel “Truth” Sets Combined through a Logical OR/AND
Radiologist Pair A/B A/C A/D B/C B/D C/D Mean CV Radiologist A — — — 63.6/100.0 65.8/82.5 75.4/94.1 68.3/92.2 0.09/0.10 Radiologist B — 62.1/94.1 64.0/78.6 — — 71.9/88.2 71.9/88.2 0.08/0.09 Radiologist C 20.2/39.0 — 24.0/38.1 — 23.7/37.5 — 23.7/37.5 0.09/0.02 Radiologist D 58.3/80.5 65.2/94.1 — 63.6/93.8 — — 63.6/93.8 0.06/0.09
CV, coefficient of variation.
Table 5
Individual Radiologist Nodule-detection Sensitivities (in percentages) Based on Different Triplet Panel “Truth” Sets Combined through a Logical OR/Majority/AND
Radiologist Triplet A/B/C A/B/D A/C/D B/C/D Radiologist A — — — 64.1/81.4/100.0 Radiologist B — — 62.3/77.3/93.8 — Radiologist C — 20.2/29.8/45.5 — — Radiologist D 57.5/81.0/93.8 — — —
Get Radiology Tree app to read full this article<
Get Radiology Tree app to read full this article<
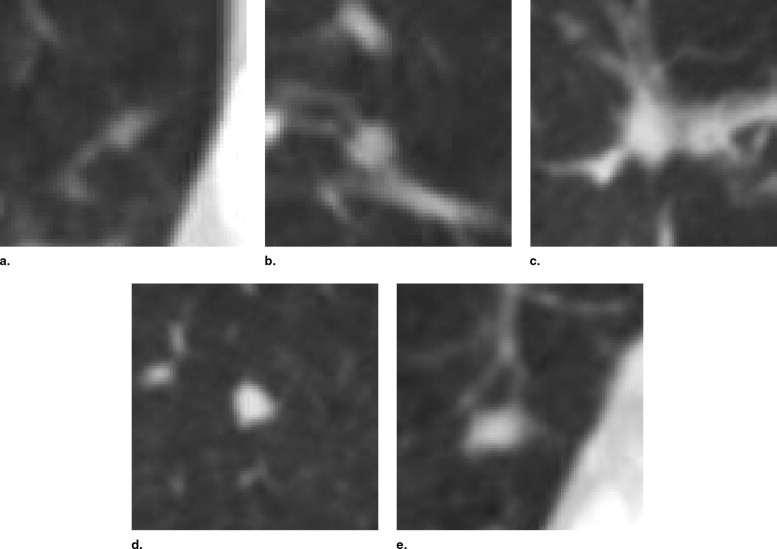
Table 6
The Lesion Categories Assigned by the Four Radiologists to the Five Lesions Shown in Figure 5
Radiologist A Radiologist B Radiologist C Radiologist D Fig 5 (a) Nodule <3 mm Nodule <3 mmNodule ≥3 mm Fig 5 (b)Nodule ≥3 mmNodule ≥3 mmNodule ≥3 mm Fig 5 (c)Nodule ≥3 mm Non-nodule ≥3 mm Fig 5 (d)Nodule ≥3 mmNodule ≥3 mmNodule ≥3 mm Fig 5 (e)Nodule ≥3 mmNodule ≥3 mmNodule ≥3 mm Nodule <3 mm
The “nodule ≥3 mm” category, which is the only category of interest for this study, is shown in bold.
Get Radiology Tree app to read full this article<
Discussion
Get Radiology Tree app to read full this article<
Get Radiology Tree app to read full this article<
Get Radiology Tree app to read full this article<
Get Radiology Tree app to read full this article<
Get Radiology Tree app to read full this article<
Get Radiology Tree app to read full this article<
Get Radiology Tree app to read full this article<
Get Radiology Tree app to read full this article<
Get Radiology Tree app to read full this article<
Get Radiology Tree app to read full this article<
Get Radiology Tree app to read full this article<
References
1. Wormanns D., Ludwig K., Beyer F., et. al.: Detection of pulmonary nodules at multirow-detector CT: effectiveness of double reading to improve sensitivity at standard-dose and low-dose chest CT. Eur Radiol 2005; 15: pp. 14-22.
2. Leader J.K., Warfel T.E., Fuhrman C.R., et. al.: Pulmonary nodule detection with low-dose CT of the lung: agreement among radiologists. Am J Roentgenol 2005; 185: pp. 973-978.
3. Novak C.L., Qian J., Fan L., et. al.: Inter-observer variations on interpretation of multi-slice CT lung cancer screening studies, and the implications for computer-aided diagnosis. SPIE Proc 2002; 4684: pp. 68-79.
4. Ochs R., Kim H.J., Angel E., et. al.: Forming a reference standard from LIDC data: impact of reader agreement on reported CAD performance. SPIE Proc 2007; 6514:
5. Paquerault S., Petrick N., Myers K.J., et. al.: Impact of a computer-aided detection (CAD) system on reader performance: assessment based on a truthing panel compared to the true gold standard. Radiology 2007; 245: pp. 546-547.
6. Petrick N., Gallas B.D., Samuelson F.W., et. al.: Influence of panel size and expert skill on truth panel performance when combining expert ratings. SPIE Proc 2005; 5749: pp. 49-57.
7. Armato S.G., McLennan G., McNitt-Gray M.F., et. al.: Lung Image Database Consortium: developing a resource for the medical imaging research community. Radiology 2004; 232: pp. 739-748.
8. Armato S.G., McNitt-Gray M.F., Reeves A.P., et. al.: The Lung Image Database Consortium (LIDC): an evaluation of radiologist variability in the identification of lung nodules on CT scans. Acad Radiol 2007; 14: pp. 1409-1421.
9. Dodd L.E., Wagner R.F., Armato S.G., et. al.: Assessment methodologies and statistical issues for computer-aided diagnosis of lung nodules in computed tomography: contemporary research topics relevant to the Lung Image Database Consortium. Acad Radiol 2004; 11: pp. 462-475.
10. McNitt-Gray M.F., Armato S.G., Meyer C.R., et. al.: The Lung Image Database Consortium (LIDC) data collection process for nodule detection and annotation. Acad Radiol 2007; 14: pp. 1464-1474.
11. Miller D.P., O’Shaughnessy K.F., Wood S.A., et. al.: Gold standards and expert panels: a pulmonary nodule case study with challenges and solutions. SPIE Proc 2004; 5372: pp. 173-184.
12. Revesz G., Kundel H.L., Bonitatibus M.: The effect of verification on the assessment of imaging techniques. Invest Radiol 1983; 18: pp. 194-198.
13. Jiang Y.: A Monte Carlo simulation method to understand expert-panel consensus truth and double readings.2007.The University of IowaIowa City, IA
14. Clarke L.P., Croft B.Y., Staab E., et. al.: National Cancer Institute initiative: lung image database resource for imaging research. Acad Radiol 2001; 8: pp. 447-450.
15. Department of Health and Human Services: Standards for privacy of individually identifiable health information: final rules. Fed Register 2002; 67: pp. 53182-53272.
16. Kundel H.L., Nodine C.F., Carmody D.: Visual scanning, pattern recognition and decision-making in pulmonary nodule detection. Invest Radiol 1978; 13: pp. 175-181.
17. Meyer C.R., Johnson T.D., McLennan G., et. al.: Evaluation of lung MDCT nodule annotation across radiologists and methods. Acad Radiol 2006; 13: pp. 1254-1265.
18. Reeves A.P., Biancardi A.M., Apanasovich T.V., et. al.: The Lung Image Database Consortium (LIDC): a comparison of different size metrics for pulmonary nodule measurements. Acad Radiol 2007; 14: pp. 1475-1485.
19. Schwartz L.H., Ginsberg M.S., DeCorato D., et. al.: Evaluation of tumor measurements in oncology: Use of film-based and electronic techniques. J Clin Oncol 2000; 18: pp. 2179-2184.
20. Ross J.C., Miller J.V., Turner W.D., et. al.: An analysis of early studies released by the Lung Imaging Database Consortium (LIDC). Acad Radiol 2007; 14: pp. 1382-1388.