
Rationale and Objectives
The study aimed to assess the relationship between tumor marker index (TMI) and high-resolution computed tomography features in early-stage lung adenocarcinoma.
Materials and Methods
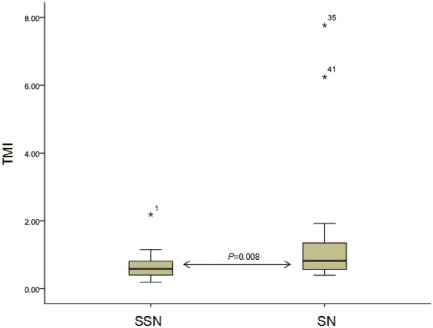
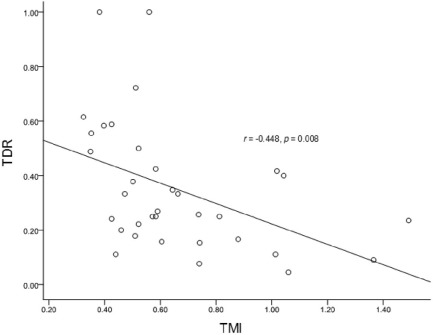
Seventy-four stage IA lung adenocarcinomas confirmed pathologically were retrospectively evaluated. Lung nodules were divided into two types: solid nodule (SN) and subsolid nodule (SSN). The maximum diameters on mediastinal window in axial imaging (D m ) and tumor shadow disappearance rate (TDR) were measured. Meanwhile, other computed tomography features of lung nodules were also recorded. TMI represents the geometric mean of normalized CEA and CYFRA 21-1 values, and the discriminatory value of TMI in this study was set at 1.0. The evaluation of discriminatory values for D m and the TMI between SNs and SSNs was done with Mann-Whitney U -test. The relationship between TDR and TMI in SSNs was evaluated by Pearson correlation analysis.
Results
Of 74 cases, 40 cases (54.05%) showed SNs and 34 cases (45.95%) showed SSNs. D m and TMI were higher in SNs than in SSNs (z = −4.782, P < 0.001; z = −2.647, P = 0.008). TDR demonstrated negative relationship with TMI in SSNs (r = −0.448, P = 0.008). Spiculation (odds ratio [OR] = 14.685; 95% confidence interval [CI]: 2.739–78.729; P = 0.002), nodule type (OR = 6.215; 95% CI: 1.531–25.228; P = 0.011), and gender (OR = 0.227; 95% CI: 0.062–0.833; P = 0.025) were independent factors associated with TMI.
Conclusions
Early-stage lung adenocarcinoma with lower TDR coexisting with spiculation was associated with higher TMI, especially in patients with solid nodule, which tended to have poor prognosis.
Introduction
Non-small cell lung cancer (NSCLC) approximately accounts for 85% of lung cancer cases , which is one of the most prevalent and cancer-related death worldwide. For highly treatment refractory rate, considerable effort is currently devoted to NSCLC-related research area. However, early detection and surgical resection remain a primary way of improving the survival of NSCLC patients . Although pathologic stage IA (T1N0M0) NSCLC is able to be completely resected theoretically, postoperation survival rate is significantly variable (60–85%) in current clinical practice . In the quest to improve prognosis, reliable prognostic markers are required in order to select the best possible treatment for individual lung cancer patients who could benefit from neoadjuvant chemoradiotherapy for high-risk groups after operation. Thus, in addition to the tumor, node, and metastasis(TNM) stage, other factors with predictive value for prognosis, such as pathologic characteristics, imaging features, serum tumor markers, and molecular markers, are widely evaluated in clinical practice.
Pretreatment serum carcinoembryonic antigen (CEA) and cytokeratin 19 fragments (CYFRA21-1) are well-established serum tumor markers used for NSCLC, used as indicators of treatment response to improve the clinical outcomes of lung cancer patients. However, their evaluation when used in combination is often difficult. A prognostic score that is based on both tumor marker values—the tumor marker index (TMI)—was then introduced by Muley et al. . TMI is useful for predicting the prognosis of early-stage NSCLC patients and might help identify patients who are likely to benefit from adjuvant therapy .
Get Radiology Tree app to read full this article<
Materials and Methods
Study Group
Get Radiology Tree app to read full this article<
Table 1
Summary of Computer Tomography Features and Patients’ Clinical Characteristics ( n = 74)
Factors Numbers/Values Factors Numbers/Values Patient age (year) 61.61 ± 9.21 Coexistence with bullae/honeycomb (no.) Gender (no.) Yes 13 (13/74; 17.57%) Male 35 (35/74; 47.30%) No 61 (61/74; 82.43%) Female 39 (39/74; 52.70%) Air bronchogram (no.) Smoking status (no.) Yes 23 (23/74; 31.08%) Smokers 22 (22/74; 29.73%) No 51 (51/74; 68.92%) Non-smokers 52 (52/74; 70.27%) TDR SSN (%) 35.16 ± 23.73 Nodule type (no.) Max D media (cm) 2.61 ± 1.16 SN 40 (40/74; 54.05%) Preoperative serum CEA (no.) SSN 34 (34/74; 45.95%) ≥5.0 ng/mL 17 (17/74; 22.97%) Lobulation (no.) <5.0 ng/mL 57 (57/74; 77.03%) Yes 70 (70/74; 94.59%) Preoperative serum CYFRA21-1 (no.) No 4 (4/74; 5.41%) >3.3 ng/mL 27 (27/74; 36.49%) Spiculation (no.) ≤3.3 ng/mL 47 (47/74; 63.51%) Yes 42 (42/74; 56.76%) TMI (no.) No 32 (32/74; 43.24%) >1.0 23 (23/74; 31.08%) Pleural based (no.) ≤1.0 51 (51/74; 68.92%) Yes 13 (13/74; 17.57%) Surgical procedure (no.) No 61 (61/74; 82.43%) Single-side pneumonectomy 1 (1/74; 1.35%) Pleural indentation (no.) Lobectomy 67 (67/74; 90.54%) Yes 40 (40/74; 54.05%) Segment resection 2 (2/74; 2.70%) No 34 (34/74; 45.95%) Wedge resection 4 (4/74; 5.41%)
CEA, carcinoembryonic antigen; CYFRA 21-1, cytokeratin 19 fragments; SN, solid nodule; SSN, subsolid nodules; TDR, tumor shadow disappearance rate; TMI, tumor marker index.
Get Radiology Tree app to read full this article<
Serum Tumor Markers
Get Radiology Tree app to read full this article<
Get Radiology Tree app to read full this article<
CT Scan and Image Analysis
Get Radiology Tree app to read full this article<
Get Radiology Tree app to read full this article<
![Figure 1-2, Illustration on how to measure the tumor shadow disappearance rate (TDR). The maximum tumor diameter (D) and the largest diameter perpendicular to D (perD) on lung window (left) is 27.5 mm and 25.0 mm, and that on mediastinal window (right) is 19.6 mm and 15.8 mm. TDR is calculated by the following formula: [1 − (19.6 × 15.8)/(27.5 × 25)] × 100% ≈ 45%.](https://storage.googleapis.com/dl.dentistrykey.com/clinical/AssessmentofRelationshipBetweenCTFeaturesandSerumTumorMarkerIndexinEarlystageLungAdenocarcinoma/0_1s20S1076633216301295.jpg)
Get Radiology Tree app to read full this article<
Pathology Evaluation
Get Radiology Tree app to read full this article<
Statistical Analysis
Get Radiology Tree app to read full this article<
Get Radiology Tree app to read full this article<
Results
Get Radiology Tree app to read full this article<
Get Radiology Tree app to read full this article<
Get Radiology Tree app to read full this article<
Get Radiology Tree app to read full this article<
Get Radiology Tree app to read full this article<
Table 2
Computed Tomography Features and Clinical Characters of Different TMI Subgroups
Factors TMI_P_ Value χ 2 >1.0 ≤1.0 Max D media 0.069 3.309 ≥1.5 cm 20 (27.03%) 34 (45.95%) <1.5 cm 3 (4.05%) 17 (22.97%) Air bronchogram 0.037 0.368 Yes 11 (14.86%) 12 (16.22%) No 12 (16.22%) 39 (52.70%) Pleural indentation 0.001 10.956 Yes 19 (25.68%) 21 (28.38%) No 4 (5.41%) 30 (40.54%) Spiculation 0.007 7.235 Yes 22 (29.73%) 20 (27.03%) No 1 (1.35%) 31 (41.89%) Lobulation 0.409 0.682 Yes 23 (31.08%) 47 (63.51%) No 0 (0%) 4 (5.41%) Pleural-based 0.196 1.673 Yes 6 (8.11%) 7 (9.46%) No 17 (22.97%) 44 (59.46%) Coexistence with bulla/honeycomb 0.762 0.092 Yes 5 (6.76%) 8 (10.81%) No 18 (24.32%) 43 (58.11%) Nodule type <0.001 14.547 SN 20 (27.03%) 20 (27.03%) SSN 3 (4.05%) 31 (41.89%) Age (years) 0.228 1.455 >70 6 (8.11%) 6 (8.11%) ≤70 17 (22.97%) 45 (60.81%) Gender 0.038 4.299 Female 15 (20.27%) 20 (27.03%) Male 8 (10.81%) 31 (41.89%) Smoking status 0.022 5.231 Smokers 11 (14.86%) 11 (14.86%) Non-smokers 12 (16.22%) 40 (54.05%)
Max D media, axial maximum diameters on mediastinal window; SN, solid nodule; SSN, subsolid nodule; TMI, tumor marker index.
Table 3
Independent Factors Associated with High TMI (>1.0)
Factors OR (95% CI)P Spiculation 14.685 (2.739–78.729) 0.002 Nodule type 6.215 (1.531–25.228) 0.011 Gender 0.227 (0.062–0.833) 0.025 Max D media NA 0.359 Pleural indentation NA 0.507 Air bronchogram NA 0.521 Smoking status NA 0.794
CI, confidence interval; OR, odds ratio; TMI, tumor marker index.
Binary logistic regression analysis with forward conditional method.
Get Radiology Tree app to read full this article<
Discussion
Get Radiology Tree app to read full this article<
Get Radiology Tree app to read full this article<
Get Radiology Tree app to read full this article<
Get Radiology Tree app to read full this article<
Get Radiology Tree app to read full this article<
Get Radiology Tree app to read full this article<
Get Radiology Tree app to read full this article<
Get Radiology Tree app to read full this article<
Acknowledgment
Get Radiology Tree app to read full this article<
References
1. Jemal A., Siegel R., Ward E., et. al.: Cancer statistics, 2009. CA Cancer J Clin 2009; 59: pp. 225-249.
2. Ferlay J., Autier P., Boniol M., et. al.: Estimates of the cancer incidence and mortality in Europe in 2006. Ann Oncol 2007; 18: pp. 581-592.
3. Hanagiri T., Baba T., So T., et. al.: Time trends of surgical outcome in patients with non-small cell lung cancer. J Thorac Oncol 2010; 5: pp. 825-829.
4. Kameyama K., Takahashi M., Ohata K., et. al.: Evaluation of the new TNM staging system proposed by the International Association for the Study of Lung Cancer at a single institution. J Thorac Cardiovasc Surg 2009; 137: pp. 1180-1184.
5. Goya T., Asamura H., Yoshimura H., et. al.: Prognosis of 6644 resected non-small cell lung cancers in Japan: a Japanese Lung Cancer Registry study. Lung Cancer 2005; 50: pp. 227-234.
6. Strauss G.M., Herndon J.E., Maddaus M.A., et. al.: Adjuvant paclitaxel plus carboplatin compared with observation in stage IB non-small-cell lung cancer: CALGB 9633 with the Cancer and Leukemia Group B, Radiation Therapy Oncology Group, and North Central Cancer Treatment Group Study Groups. J Clin Oncol 2008; 26: pp. 5043-5051.
7. Hanagiri T., Sugaya M., Takenaka M., et. al.: Preoperative CYFRA 21-1 and CEA as prognostic factors in patients with stage I non-small cell lung cancer. Lung Cancer 2011; 74: pp. 112-117.
8. Matsuguma H., Nakahara R., Igarashi S., et. al.: Pathologic stage I non-small cell lung cancer with high levels of preoperative serum carcinoembryonic antigen: clinicopathologic characteristics and prognosis. J Thorac Cardiovasc Surg 2008; 135: pp. 44-49.
9. Muley T., Fetz T.H., Dienemann H., et. al.: Tumor volume and tumor marker index based on CYFRA 21-1 and CEA are strong prognostic factors in operated early stage NSCLC. Lung Cancer 2008; 60: pp. 408-415.
10. Fukai R., Sakao Y., Sakuraba M., et. al.: The prognostic value of carcinoembryonic antigen in T1N1M0 and T2N1M0 non-small cell carcinoma of the lung. Eur J Cardiothorac Surg 2007; 32: pp. 440-444.
11. Hsu W.H., Huang C.S., Hsu H.S., et. al.: Preoperative serum carcinoembryonic antigen level is a prognostic factor in women with early non-small-cell lung cancer. Ann Thorac Surg 2007; 83: pp. 419-424.
12. Park S.Y., Lee J.G., Kim J., et. al.: Preoperative serum CYFRA 21-1 level as a prognostic factor in surgically treated adenocarcinoma of lung. Lung Cancer 2013; 79: pp. 156-160.
13. Ono A., Takahashi T., Mori K., et. al.: Prognostic impact of serum CYFRA 21-1 in patients with advanced lung adenocarcinoma: a retrospective study. BMC Cancer 2013; 13: pp. 354-364.
14. Muley T., Dienemann H., Ebert W.: CYFRA 21-1 and CEA are independent prognostic factors in 153 operated stage I NSCLC patients. Anticancer Res 2004; 24: pp. 1953-1956.
15. Blankenburg F., Hatz R., Nagel D., et. al.: Preoperative CYFRA 21-1 and CEA as prognostic factors in patients with stage I non-small cell lung cancer. Tumor Biol 2008; 29: pp. 272-277.
16. Yamazaki M., Ishikawa H., Kunii R., et. al.: Relationship between CT features and high preoperative serum carcinoembryonic antigen levels in early-stage lung adenocarcinoma. Clin Radiol 2014; 69: pp. 559-566.
17. Travis W.D., Brambilla E., Noguchi M., et. al.: International Association for the Study of Lung Cancer/American Thoracic Society/European Respiratory Society International Multidisciplinary Classification of lung adenocarcinoma. J Thorac Oncol 2011; 6: pp. 244-285.
18. Okada M., Tauchi S., Iwanaga K., et. al.: Associations among bronchioloalveolar carcinoma components, positron emission tomographic and computed tomographic findings, and malignant behavior in small lung adenocarcinomas. J Thorac Cardiovasc Surg 2007; 133: pp. 1448-1454.
19. Horn L., Sandler A.B., Putnam J.B., et. al.: The rational for adjuvant chemotherapy in stage I non-small cell lung cancer. J Thorac Oncol 2007; 2: pp. 377-383.
20. Nakata M., Sawada S., Yamashita M., et. al.: Objective radiologic analysis of ground-glass opacity aimed at curative limited resection for small peripheral non-small cell lung cancer. J Thorac Cardiovasc Surg 2005; 129: pp. 1226-1231.
21. Shimizu K., Yamada K., Saito H., et. al.: Surgically curable peripheral lung carcinoma: correlation of thin-section CT findings with histologic prognostic factors and survival. Chest 2005; 127: pp. 871-878.
22. Kakinuma R., Kodama K., Yamada K., et. al.: Performance evaluation of 4 measuring methods of ground-glass opacities for predicting the 5-year relapse-free survival of patients with peripheral non-small cell lung cancer: a multicenter study. J Comput Assist Tomogr 2008; 32: pp. 792-798.
23. Murakawa T., Konoeda C., Ito T., et. al.: The ground glass opacity component can be eliminated from the T-factor assessment of lung adenocarcinoma. Eur J Cardiothorac Surg 2013; 43: pp. 925-932.
24. Takamochi K., Nagai K., Yoshida J., et. al.: Pathologic N0 status in pulmonary adenocarcinoma is predictable by combining serum carcinoembryonic antigen level and computed tomographic findings. J Thorac Cardiovasc Surg 2001; 122: pp. 325-330.
25. Haraguchi N., Satoh H., Kikuchi N., et. al.: Prognostic value of tumour disappearance rate on computed tomography in advanced-stage lung adenocarcinoma. Clin Lung Cancer 2007; 8: pp. 327-330.
26. Takashima S., Maruyama Y., Hasegawa M., et. al.: High-resolution CT features: prognostic significance in peripheral lung adenocarcinoma with bronchioloalveolar carcinoma components. Respiration 2003; 70: pp. 36-42.
27. Aoki T., Tomoda Y., Watanabe H., et. al.: Peripheral lung adenocarcinoma: correlation of thin-section CT findings with histologic prognostic factors and survival. Radiology 2001; 220: pp. 803-809.
28. Oda S., Awai K., Murao K., et. al.: Volume-doubling time of pulmonary nodules with ground glass opacity at multidetector CT: assessment with computer-aided three-dimensional volumetry. Acad Radiol 2011; 18: pp. 63-69.
29. Alexander J.C., Silverman N.A., Chretien P.B.: Effect of age and cigarette smoking on carcinoembryonic antigen levels. JAMA 1976; 235: pp. 1975-1979.
30. Bombardieri E., Seregni E., Bogni A., et. al.: Evaluation of cytokeratin 19 serum fragments (CYFRA21-1) in patients with lung cancer: results of a multicenter trial. Int J Biol Markers 1994; 9: pp. 89-95.
31. Tomita M., Shimizu T., Ayabe T., et. al.: Prognostic significance of tumor marker index based on preoperative CEA and CYFRA 21-1 in non-small cell lung cancer. Anticancer Res 2010; 30: pp. 3099-3102.
32. Isaka T., Yokose T., Ito H., et. al.: Comparison between CT tumor size and pathological tumor size in frozen section examinations of lung adenocarcinoma. Lung Cancer 2014; 85: pp. 40-46.