
Rationale and Objectives
To investigate the diagnostic value of high-resolution dynamic contrast-enhanced magnetic resonance imaging (DCE-MRI) for assessment of synovitis in erosive osteoarthritis (EOA) of the hand and compare the results with those acquired in its potential mimic, the psoriatic arthritis (PsA).
Materials and Methods
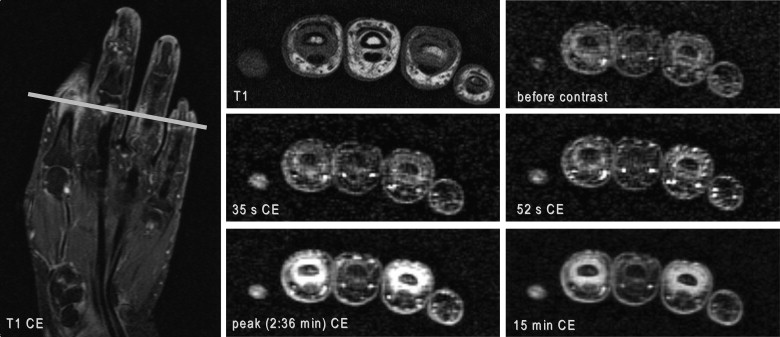
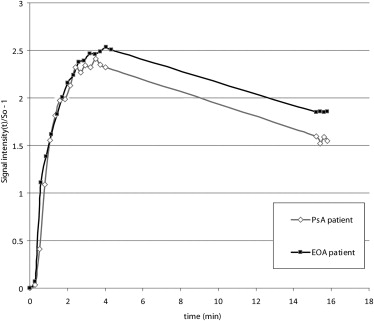
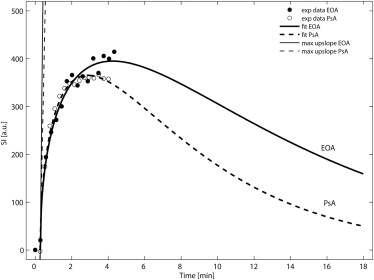
Twenty-six patients (17 PsA, 9 EOA) were examined at 3 T. The time course of synovial contrast uptake was measured by ROI analysis using a three-dimensional encoded spoiled gradient-echo sequence. Characteristic parameters of synovial uptake curves (time to peak [TTP], peak value, mean transit time [MTT], area under the curve [AUC], and maximum upslope) of PsA and EOA patients were compared using gamma variate analysis and calculation of the late relative enhancement 15 minutes after contrast administration.
Results
Enhancement curves of PsA and EOA patients paralleled each other at comparable levels in the early phase after contrast injection without statistical difference in the following calculated characteristic curve parameters: TTP, peak value, MTT, AUC, and maximum upslope. However, significant difference was found in the late relative enhancement 15 minutes after contrast injection ( P = .0275) with higher values in EOA patients.
Conclusion
DCE-MRI provides assessment of synovitis in both patients with EOA and PsA. Interestingly, synovial enhancement characteristics were comparable for the most part in these two disorders. However, late enhancement might help in differentiation which is essential for guiding therapy.
Erosive osteoarthritis (EOA) of the hand is an inflammatory form of osteoarthritis (OA) that affects predominantly postmenopausal middle-aged women and is considered a more severe form of OA with pathologic features suggestive of inflammatory synovial changes . EOA shares features typical of OA as well as inflammatory arthritis. Joint involvement may or may not be symmetric with the distal and proximal interphalangeal (PIP) joints as preferred target sites. Symptoms can wax and wane as well as inflammatory signs can be involved in different joints at different times . Early in the disease, patients present with a nonspecific synovial inflammatory arthropathy with abrupt onset of pain, tenderness, swelling, and redness of the affected joints. In the course of the disease, patients can considerably suffer from acute episodes of intense inflammation with residual deformity and impairment of function .
Psoriatic arthritis (PsA) is a synovial inflammatory arthropathy that is defined as the occurrence of seronegative arthritis and psoriasis . PsA encompasses a variety of clinical entities including a distal interphalangeal (DIP) joint polyarthritis (row type), dactylitis (ray type), enthesitis, arthritis mutilans, rheumatoid arthritis-like symmetric polyarthritis, monoarthritis, or asymmetric oligoarthritis . The peripheral joint involvement in PsA is mostly asymmetrical and oligoarticular, but can also mimic rheumatoid arthritis with eventually destructive involvement of multiple small hand joints. DIP joint disease is very typical of PsA and can range from mild changes to an aggressive and destructive arthropathy . PsA can involve tendons, ligaments, fascia, bone, and bone marrow . However, collateral ligaments and tendons are a common target at clinical presentation in both PsA and EOA , so that it may be difficult to differentiate between the two groups based on morphologic imaging features alone.
Get Radiology Tree app to read full this article<
Get Radiology Tree app to read full this article<
Materials and methods
Patient Population
Get Radiology Tree app to read full this article<
Table 1
Patients’ Characteristics and Enhancement Values
Psoriatic Arthritis (PsA) Erosive Osteoarthritis (EOA)P Value PsA vs. EOA Number of patients 17 9 Male/female 8/9 5/4 Mean age (y) 48 ± 7 (37–61) 59 ± 5 (51–66) Disease duration (y) 7.2 ± 7.5 (0.2–22.0) 1.8 ± 1.7 (0.3–4.5) Patients with MCP joint prevalence 8 3 Patients with PIP, DIP joint prevalence 9 6 Time to peak (min) 3.3 ± 0.7 (1.9–4.8) 3.3 ± 0.7 (2.1–4.1) 0.96 Mean transit time (min) 9.5 ± 2.8 (4.8–13.1) 8.6 ± 2.5 (4.9–12.3) 0.46 Peak value (a.u.) 382 ± 145 (197–772) 385 ± 100 (253–550) 0.95 Area under the curve 4544 ± 1528 (2671–8371) 4398 ± 1992 (2695–8345) 0.85 Maximum upslope 15,959 ± 35,249 (335–132,941) 17,949 ± 40,808 (299–118,475) 0.91 RE 15min in % 269 ± 55 (191–404) 362 ± 97 (249–526) 0.0275 ∗
a.u., absolute units; DIP, distal interphalangeal joint; MCP, metacarpophalangeal joint; PIP, proximal interphalangeal joint; RE 15min, relative enhancement at 15 minutes after intravenous contrast administration.
Values are given in mean ± standard deviation (range).
Get Radiology Tree app to read full this article<
Get Radiology Tree app to read full this article<
Get Radiology Tree app to read full this article<
MRI Examination Protocol
Get Radiology Tree app to read full this article<
Image Analysis
Get Radiology Tree app to read full this article<
Get Radiology Tree app to read full this article<
RE15min=S15min−S0S0×100%. R
E
15
min
=
S
15
min
−
S
0
S
0
×
100
%
.
Get Radiology Tree app to read full this article<
Get Radiology Tree app to read full this article<
Statistical Analysis
Get Radiology Tree app to read full this article<
Results
Get Radiology Tree app to read full this article<
Get Radiology Tree app to read full this article<
Get Radiology Tree app to read full this article<
Discussion
Get Radiology Tree app to read full this article<
Get Radiology Tree app to read full this article<
Get Radiology Tree app to read full this article<
Get Radiology Tree app to read full this article<
Get Radiology Tree app to read full this article<
Get Radiology Tree app to read full this article<
Get Radiology Tree app to read full this article<
Get Radiology Tree app to read full this article<
References
1. Banks S.E.: Erosive osteoarthritis: a current review of a clinical challenge. Clin Rheumatol 2010; 29: pp. 697-706.
2. Feydy A., Pluot E., Guerini H., et. al.: Osteoarthritis of the wrist and hand, and spine. Radiol Clin North Am 2009; 47: pp. 723-759.
3. Kalichman L., Hernandez-Molina G.: Hand osteoarthritis: an epidemiological perspective. Semin Arthritis Rheum 2009; 39: pp. 465-476.
4. Hunter D.J.: Insights from imaging on the epidemiology and pathophysiology of osteoarthritis. Radiol Clin North Am 2009; 47: pp. 539-551.
5. Cimmino M.A., Parodi M., Innocenti S., et. al.: Dynamic magnetic resonance of the wrist in psoriatic arthritis reveals imaging patterns similar to those of rheumatoid arthritis. Arthritis Res Ther 2005; 7: pp. R725-R731.
6. Tan A.L., Grainger A.J., Tanner S.F., et. al.: A high-resolution magnetic resonance imaging study of distal interphalangeal joint arthropathy in psoriatic arthritis and osteoarthritis: are they the same?. Arthritis Rheum 2006; 54: pp. 1328-1333.
7. McGonagle D., Conaghan P.G., Emery P.: Psoriatic arthritis: a unified concept twenty years on. Arthritis Rheum 1999; 42: pp. 1080-1086.
8. McGonagle D.: Imaging the joint and enthesis: insights into pathogenesis of psoriatic arthritis. Ann Rheum Dis 2005; 64: pp. ii58-ii60.
9. Tehranzadeh J., Ashikyan O., Anavim A., et. al.: Detailed analysis of contrast-enhanced MRI of hands and wrists in patients with psoriatic arthritis. Skeletal Radiol 2008; 37: pp. 433-442.
10. Schoellnast H., Deutschmann H.A., Hermann J., et. al.: Psoriatic arthritis and rheumatoid arthritis: findings in contrast-enhanced MRI. AJR Am J Roentgenol 2006; 187: pp. 351-357.
11. Ghanem N., Uhl M., Pache G., et. al.: MRI in psoriatic arthritis with hand and foot involvement. Rheumatol Int 2007; 27: pp. 387-393.
12. Tan A.L., Toumi H., Benjamin M., et. al.: Combined high-resolution magnetic resonance imaging and histological examination to explore the role of ligaments and tendons in the phenotypic expression of early hand osteoarthritis. Ann Rheum Dis 2006; 65: pp. 1267-1272.
13. Schwenzer NF, Kotter I, Henes JC, et al. The role of dynamic contrast-enhanced MRI in the differential diagnosis of psoriatic and rheumatoid arthritis. AJR Am J Roentgenol 194:715–720.
14. Van den Bosch F., Manger B., Goupille P., et. al.: Effectiveness of adalimumab in treating patients with active psoriatic arthritis and predictors of good clinical responses for arthritis, skin and nail lesions. Ann Rheum Dis 2010; 69: pp. 394-399.
15. Bacconnier L., Jorgensen C., Fabre S.: Erosive osteoarthritis of the hand: clinical experience with anakinra. Ann Rheum Dis 2009; 68: pp. 1078-1079.
16. Calich AL, Domiciano DS, Fuller R. Osteoarthritis: can anti-cytokine therapy play a role in treatment? Clin Rheumatol 29:451–455.
17. Taylor W., Gladman D., Helliwell P., et. al.: Classification criteria for psoriatic arthritis: development of new criteria from a large international study. Arthritis Rheum 2006; 54: pp. 2665-2673.
18. Zhang W., Doherty M., Leeb B.F., et. al.: EULAR evidence-based recommendations for the diagnosis of hand osteoarthritis: report of a task force of ESCISIT. Ann Rheum Dis 2009; 68: pp. 8-17.
19. Thompson H.K., Starmer C.F., Whalen R.E., et. al.: Indicator transit time considered as a gamma variate VARIATE. Circ Res 1964; 14: pp. 502-515.
20. Cimmino M.A., Innocenti S., Livrone F., et. al.: Dynamic gadolinium-enhanced magnetic resonance imaging of the wrist in patients with rheumatoid arthritis can discriminate active from inactive disease. Arthritis Rheum 2003; 48: pp. 1207-1213.
21. McQueen F., Lassere M., Ostergaard M.: Magnetic resonance imaging in psoriatic arthritis: a review of the literature. Arthritis Res Ther 2006; 8: pp. 207.
22. Bonnet C.S., Walsh D.A.: Osteoarthritis, angiogenesis and inflammation. Rheumatology (Oxford) 2005; 44: pp. 7-16.
23. Kirkhus E., Bjornerud A., Thoen J., et. al.: Contrast-enhanced dynamic magnetic resonance imaging of finger joints in osteoarthritis and rheumatoid arthritis: an analysis based on pharmacokinetic modeling. Acta Radiol 2006; 47: pp. 845-851.
24. Ben-Av P., Crofford L.J., Wilder R.L., et. al.: Induction of vascular endothelial growth factor expression in synovial fibroblasts by prostaglandin E and interleukin-1: a potential mechanism for inflammatory angiogenesis. FEBS Lett 1995; 372: pp. 83-87.
25. Giatromanolaki A., Sivridis E., Maltezos E., et. al.: Upregulated hypoxia inducible factor-1alpha and -2alpha pathway in rheumatoid arthritis and osteoarthritis. Arthritis Res Ther 2003; 5: pp. R193-R201.
26. Kay J., Calabrese L.: The role of interleukin-1 in the pathogenesis of rheumatoid arthritis. Rheumatology (Oxford) 2004; 43: pp. iii2-iii9.
27. Rovetta G., Bianchi G., Monteforte P.: Joint failure in erosive osteoarthritis of the hands. Int J Tissue React 1995; 17: pp. 33-42.
28. Reece R.J., Canete J.D., Parsons W.J., et. al.: Distinct vascular patterns of early synovitis in psoriatic, reactive, and rheumatoid arthritis. Arthritis Rheum 1999; 42: pp. 1481-1484.
29. Hodgson R.J., O’Connor P., Moots R.: MRI of rheumatoid arthritis image quantitation for the assessment of disease activity, progression and response to therapy. Rheumatology (Oxford) 2008; 47: pp. 13-21.
30. Espinoza L.R., Vasey F.B., Espinoza C.G., et. al.: Vascular changes in psoriatic synovium. A light and electron microscopic study. Arthritis Rheum 1982; 25: pp. 677-684.
31. Canete J.D., Rodriguez J.R., Salvador G., et. al.: Diagnostic usefulness of synovial vascular morphology in chronic arthritis. A systematic survey of 100 cases. Semin Arthritis Rheum 2003; 32: pp. 378-387.
32. vHelliwell P.S., Taylor W.J.: Treatment of psoriatic arthritis and rheumatoid arthritis with disease modifying drugs—comparison of drugs and adverse reactions. J Rheumatol 2008; 35: pp. 472-476.