
Rationale and Objectives
To assess the performance of a nonlinear microfinite element model on predicting trabecular bone yield and post-yield behavior based on high-resolution in vivo magnetic resonance images via the serial reproducibility.
Materials and Methods
The nonlinear model captures material nonlinearity by iteratively adjusting tissue-level modulus based on tissue-level effective strain. It enables simulations of trabecular bone yield and post-yield behavior from micro magnetic resonance images at in vivo resolution by solving a series of nonlinear systems via an iterative algorithm on a desktop computer. Measures of mechanical competence (yield strain/strength, ultimate strain/strength, modulus of resilience, and toughness) were estimated at the distal radius of premenopausal and postmenopausal women (N = 20, age range 50–75) in whom osteoporotic fractures typically occur. Each subject underwent three scans (20.2 ± 14.5 days). Serial reproducibility was evaluated via coefficient of variation (CV) and intraclass correlation coefficient (ICC).
Results
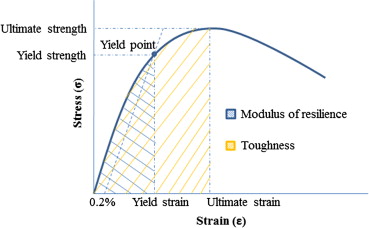
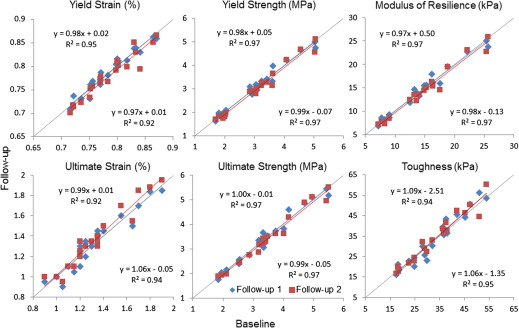
Nonlinear simulations were completed in an average of 14 minutes per three-dimensional image data set involving analysis of 61 strain levels. The predicted yield strain/strength, ultimate strain/strength, modulus of resilience, and toughness had a mean value of 0.78%, 3.09 MPa, 1.35%, 3.48 MPa, 14.30 kPa, and 32.66 kPa, respectively, covering a substantial range by a factor of up to 4. Intraclass correlation coefficient ranged from 0.986 to 0.994 (average 0.991); CV ranged from 1.01% to 5.62% (average 3.6%), with yield strain and toughness having the lowest and highest CV values, respectively.
Conclusions
The data suggest that the yield and post-yield parameters have adequate reproducibility to evaluate treatment effects in interventional studies within short follow-up periods.
Osteoporosis is a degenerative disorder of the skeleton, leading to an increased risk of fracture. The most common sites of osteoporotic fractures are the hip, spine, and wrist; all sites with a significant fraction of trabecular bone (TB). Fractures of the distal radius (e.g., Colles fracture) account for approximately 15% of all fractures in adults . They are more prevalent at earlier age than hip fractures and have been shown to be a risk factor of future spine and hip fractures . The incidence of Colles fracture is greater in women than in men, especially after menopause . For these reasons, the distal radius is an anatomic site of great interest for early detection of osteoporosis.
The ability of bone to resist stresses without failure (often referred to as “bone mechanical competence”) is impaired in subjects with osteoporosis. Improvements in mechanical competence, for example via medication or exercise, can help prevent osteoporosis or alleviate its symptoms. In many earlier studies, bone structural and topological parameters have been used as surrogates for fracture susceptibility based on the associations found between microarchitecture and the presence or extent of osteoporotic fractures . However, structural parameters are only surrogates for the bone’s mechanical failure behavior. The most direct approach to evaluate bone mechanical competence is via image-based micro-finite element (μFE) analysis . Constructed from high-resolution images of bone microstructure comprising both trabecular and cortical compartments, μFE models are capable of directly estimating bone elastic moduli, predicting bone strength, and assessing osteoporotic fracture risk .
Get Radiology Tree app to read full this article<
Get Radiology Tree app to read full this article<
Get Radiology Tree app to read full this article<
Materials and methods
Image Acquisition
Get Radiology Tree app to read full this article<
Image Processing
Get Radiology Tree app to read full this article<
Simulation of Yield and Post-yield Behavior
Get Radiology Tree app to read full this article<
Get Radiology Tree app to read full this article<
C=E(1+v)(1−2v)⎡⎣⎢⎢⎢⎢⎢⎢⎢⎢⎢⎢⎢1−vvv000v1−vv000vv1−v0000001−2v20000001−2v20000001−2v2⎤⎦⎥⎥⎥⎥⎥⎥⎥⎥⎥⎥⎥. C
=
E
(
1
+
v
)
(
1
−
2
v
)
[
1
−
v
v
v
0
0
0
v
1
−
v
v
0
0
0
v
v
1
−
v
0
0
0
0
0
0
1
−
2
v
2
0
0
0
0
0
0
1
−
2
v
2
0
0
0
0
0
0
1
−
2
v
2
]
.
Get Radiology Tree app to read full this article<
Get Radiology Tree app to read full this article<
E(εtissue)=((sech((50×εtissue+0.53)1.4))0.6+0.05)×15GPa. E
(
ε
tissue
)
=
(
(
sec
h
(
(
50
×
ε
tissue
+
0.53
)
1.4
)
)
0.6
+
0.05
)
×
15
GPa
.
Here sech stands for hyperbolic secant, and the quantity is the tissue-level effective strain calculated for each element using εtissue=2×U/E−−−−−−−√ ε
tissue
=
2
×
U
/
E with E = 15 GPa and U being the strain-energy density of that element. All other parameters in were empirically calibrated so that the resultant stress-strain curves were consistent with those observed by mechanical testing in work performed by others . Equation 2 is used to relate the local strain to the modulus of elasticity as illustrated in Zhang et al ( ; Fig 1 ). A nonlinear system, A(u)u = b , was thereby established in a way analogous to that in the linear case . This nonlinear system was solved for the resultant stress via an iterative algorithm . The maximum number of iterations was empirically set to 30. A total of 61 strain levels were applied in all experiments with the smallest strain and the step size both being 0.05%.
Get Radiology Tree app to read full this article<
Get Radiology Tree app to read full this article<
Get Radiology Tree app to read full this article<
Get Radiology Tree app to read full this article<
Statistical Analysis
Get Radiology Tree app to read full this article<
Results
Get Radiology Tree app to read full this article<
Get Radiology Tree app to read full this article<
Get Radiology Tree app to read full this article<
Table 1
Parameter Means ± SD and Ranges for the 20 Subjects, with Average Coefficient of Variance (CV) and Intraclass Correlation Coefficient (ICC) of Estimated Mechanical Parameters from Nonlinear Simulations for Three Repeat Studies
Mean ± SD Range Average CV (%) ICC Yield strain (%) 0.78 ± 0.05 [0.70, 0.87] 1.01 0.988 Yield strength (MPa) 3.09 ± 1.01 [1.62, 5.11] 3.65 0.995 Ultimate strain (%) 1.35 ± 0.28 [0.90, 1.95] 3.68 0.987 Ultimate strength (MPa) 3.48 ± 1.05 [1.75, 5.51] 3.42 0.994 Modulus of resilience (kPa) 14.30 ± 5.39 [6.83, 25.85] 4.19 0.996 Toughness (kPa) 32.77 ± 12.22 [16.09, 60.22] 5.62 0.986
Get Radiology Tree app to read full this article<
Get Radiology Tree app to read full this article<
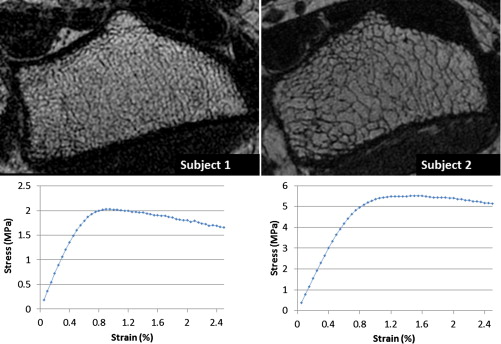
Table 2
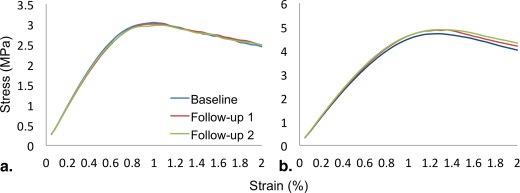
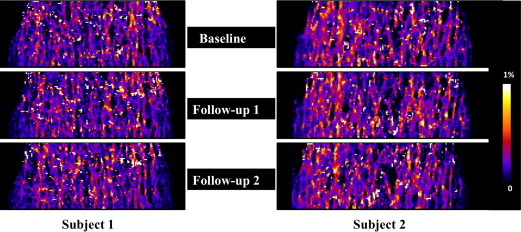
Yield and Post-yield Parameters for the Two Subjects in Figure 5
Subject 1 Subject 2 Yield strain (%) 0.74 0.87 Yield strength (MPa) 1.97 5.11 Ultimate strain (%) 0.90 1.50 Ultimate strength (MPa) 2.03 5.50 Modulus of resilience (kPa) 8.60 25.85 Toughness (kPa) 16.09 60.22
Get Radiology Tree app to read full this article<
Get Radiology Tree app to read full this article<
Get Radiology Tree app to read full this article<
Get Radiology Tree app to read full this article<
Discussion
Get Radiology Tree app to read full this article<
Get Radiology Tree app to read full this article<
Get Radiology Tree app to read full this article<
Get Radiology Tree app to read full this article<
Get Radiology Tree app to read full this article<
Get Radiology Tree app to read full this article<
Get Radiology Tree app to read full this article<
Acknowledgments
Get Radiology Tree app to read full this article<
Get Radiology Tree app to read full this article<
References
1. Davis D.I., Baratz M.: Soft tissue complications of distal radius fractures. Hand Clinics 2010; 26: pp. 229-235.
2. Kanis J., Johnell O., Oden A., et. al.: Long-term risk of osteoporotic fracture in Malmö. Osteoporosis Int 2000; 11: pp. 669-674.
3. Maravic M., Le Bihan C., Landais P., et. al.: Incidence and cost of osteoporotic fractures in France during 2001. A methodological approach by the National Hospital Database. Osteoporosis Int 2005; 16: pp. 1475-1480.
4. Lauritzen J., Schwarz P., McNair P., et. al.: Radial and humeral fractures as predictors of subsequent hip, radial or humeral fractures in women, and their seasonal variation. Osteoporosis Int 1993; 3: pp. 133-137.
5. Mallmin H., Ljunghall S., Persson I., et. al.: Fracture of the distal forearm as a forecaster of subsequent hip fracture: a population-based cohort study with 24 years of follow-up. Calcif Tiss Int 1993; 52: pp. 269-272.
6. Spiegel P.: Osteoporosis, etiology, diagnosis, and management.1996.Lippincott Williams and WilkinsPhiladelphia, PA
7. Majumdar S., Genant H.K., Grampp S., et. al.: Correlation of trabecular bone structure with age, bone, mineral density, and osteoporotic status: in vivo studies in the distal radius using high-resolution magnetic resonance imaging. J Bone Miner Res 1997; 12: pp. 111-118.
8. Ulrich D., van Rietbergen B., Laib A., et. al.: The ability of three-dimensional structural indices to reflect mechanical aspects of trabecular bone. Bone 1999; 25: pp. 55-60.
9. Wehrli F.W., Gomberg B.R., Saha P.K., et. al.: Digital topological analysis of in vivo magnetic resonance microimages of trabecular bone reveals structural implications of osteoporosis. J Bone Miner Res 2001; 16: pp. 1520-1531.
10. Van Rietbergen B., Weinans H., Huiskes R., et. al.: A new method to determine trabecular bone elastic properties and loading using micromechanical finite-element models. J Biomech 1995; 28: pp. 69-81.
11. Boutroy S., Van Rietbergen B., Sornay-Rendu E., et. al.: Finite element analysis based on in vivo HR-pQCT images of the distal radius is associated with wrist fracture in postmenopausal women. J Bone Miner Res 2008; 23: pp. 392-399.
12. Mueller T.L., Christen D., Sandercott S., et. al.: Computational finite element bone mechanics accurately predicts mechanical competence in the human radius of an elderly population. Bone 2011; 48: pp. 1232-1238.
13. Van Rietbergen B., Odgaard A., Kabel J., et. al.: Direct mechanics assessment of elastic symmetries and properties of trabecular bone architecture. J Biomech 1996; 29: pp. 1653-1657.
14. Bevill G., Keaveny T.M.: Trabecular bone strength predictions using finite element analysis of micro-scale images at limited spatial resolution. Bone 2009; 44: pp. 579-584.
15. Majumdar S.: Magnetic resonance imaging of trabecular bone structure. Top Magn Reson Imaging 2002; 13: pp. 323-334.
16. Wehrli F.W.: Structural and functional assessment of trabecular and cortical bone by micro magnetic resonance imaging. J Magn Reson Imaging 2007; 25: pp. 390-409.
17. Wehrli F.W., Rajapakse C.S., Magland J.F., et. al.: Mechanical implications of estrogen supplementation in early postmenopausal women. J Bone Miner Res 2010; 25: pp. 1406-1414.
18. Zhang X.H., Liu X.S., Vasilic B., et. al.: In vivo microMRI-based finite element and morphological analyses of tibial trabecular bone in eugonadal and hypogonadal men before and after testosterone treatment. J Bone Miner Res 2008; 23: pp. 1426-1434.
19. Rajapakse C.S., Leonard M.B., Bhagat Y.A., et. al.: Micro-MR imaging-based computational biomechanics demonstrates reduction in cortical and trabecular bone strength after renal transplantation. Radiology 2012; 262: pp. 912-920.
20. Niebur G.L., Feldstein M.J., Yuen J.C., et. al.: High-resolution finite element models with tissue strength asymmetry accurately predict failure of trabecular bone. J Biomech 2000; 33: pp. 1575-1583.
21. Verhulp E., Van Rietbergen B., Muller R., et. al.: Indirect determination of trabecular bone effective tissue failure properties using micro-finite element simulations. J Biomechan 2008; 41: pp. 1479-1485.
22. Macneil J.A., Boyd S.K.: Bone strength at the distal radius can be estimated from high-resolution peripheral quantitative computed tomography and the finite element method. Bone 2008; 42: pp. 1203-1213.
23. Charlebois M., Jirásek M., Zysset P.K.: A nonlocal constitutive model for trabecular bone softening in compression. Biomechan Modeling Mechanobiol 2010; 9: pp. 597-611.
24. Zhang N., Magland J.F., Rajapakse C.S., et. al.: Potential of in-vivo MRI-based nonlinear finite-element analysis for the assessment of trabecular bone post-yield properties. Med Phys 2013; 40: pp. 052303.
25. Magland J.F., Zhang N., Rajapakse C.S., et. al.: Computationally-optimized bone mechanical modeling from high-resolution structural images. PLoS ONE 2012; 7: pp. e35525.
26. Müller R., Hildebrand T., Häuselmann H., et. al.: In vivo reproducibility of three-dimensional structural properties of noninvasive bone biopsies using 3D-pQCT. J Bone Miner Res 1996; 11: pp. 1745-1750.
27. Wald M.J., Magland J.F., Rajapakse C.S., et. al.: Structural and mechanical parameters of trabecular bone estimated from in vivo high-resolution magnetic resonance images at 3 Tesla field strength. J Magn Reson Imaging 2010; 31: pp. 1157-1168.
28. Bhagat Y.A., Rajapakse C.S., Magland J.F., et. al.: Performance of muMRI-Based virtual bone biopsy for structural and mechanical analysis at the distal tibia at 7T field strength. J Magn Reson Imaging 2011; 33: pp. 372-381.
29. Lam S.C., Wald M.J., Rajapakse C.S., et. al.: Performance of the MRI-based virtual bone biopsy in the distal radius: serial reproducibility and reliability of structural and mechanical parameters in women representative of osteoporosis study populations. Bone 2011; 49: pp. 895-903.
30. Magland J.F., Wald M.J., Wehrli F.W.: Spin-echo micro-MRI of trabecular bone using improved 3D fast large-angle spin-echo (FLASE). Magn Reson Med 2009; 61: pp. 1114-1121.
31. Song H.K., Wehrli F.W.: In vivo micro-imaging using alternating navigator echoes with applications to cancellous bone structural analysis. Magn Reson Med 1999; 41: pp. 947-953.
32. Lin W., Ladinsky G.A., Wehrli F., et. al.: Image metric-based correction (autofocusing) of motion artifacts in high-resolution trabecular bone imaging. J Magn Reson Imaging 2007; 26: pp. 191-197.
33. Magland J.F., Jones C.E., Leonard M.B., et. al.: Retrospective 3D registration of trabecular bone MR images for longitudinal studies. J Magn Reson Imaging 2009; 29: pp. 118-126.
34. Vasilic B., Wehrli F.W.: A novel local thresholding algorithm for trabecular bone volume fraction mapping in the limited spatial resolution regime of in-vivo MRI. IEEE Trans Med Imaging 2005; 24: pp. 1574-1585.
35. Zysset P.K., Guo X.E., Hoffler C.E., et. al.: Elastic modulus and hardness of cortical and trabecular bone lamellae measured by nanoindentation in the human femur. J Biomech 1999; 32: pp. 1005-1012.
36. Betten J.: Generalization of nonlinear material laws found in experiments to multiaxial states of stress. Eur J Mech-A/Solids 1989; 8: pp. 325-339.
37. Pistoia W., van Rietbergen B., Lochmuller E.M., et. al.: Estimation of distal radius failure load with micro-finite element analysis models based on three-dimensional peripheral quantitative computed tomography images. Bone 2002; 30: pp. 842-848.
38. Kopperdahl D.L., Keaveny T.M.: Yield strain behavior of trabecular bone. J Biomech 1998; 31: pp. 601-608.
39. Gomberg B.R., Wehrli F.W., Vasilic B., et. al.: Reproducibility and error sources of micro-MRI-based trabecular bone structural parameters of the distal radius and tibia. Bone 2004; 35: pp. 266-276.
40. Newitt D.C., van Rietbergen B., Majumdar S.: Processing and analysis of in vivo high-resolution MR images of trabecular bone for longitudinal studies: reproducibility of structural measures and micro-finite element analysis derived mechanical properties. Osteoporos Int 2002; 13: pp. 278-287.
41. Rajapakse C.S., Magland J.F., Wehrli F.W.: Fast prospective registration of in vivo MR images of trabecular bone microstructure in longitudinal studies. Magn Reson Med 2008; 59: pp. 1120-1126.
42. Fernandez D.L., Jupiter J.B.: Fractures of the distal radius: a practical approach to management.2002.SpringerNew York, NY