
Rationale and Objectives
The preoperative evaluation of tumor grading and angiogenesis has important clinical implications in the treatment and prognosis of patients with colorectal cancers (CRCs). The aim of the present study was to assess tumor perfusion with 256-slice computed tomography (CT) using whole-volume perfusion technology before surgery, and to investigate the differences in the perfusion parameters among tumor grades and the correlation between perfusion parameters and pathologic results in CRC.
Materials and Methods
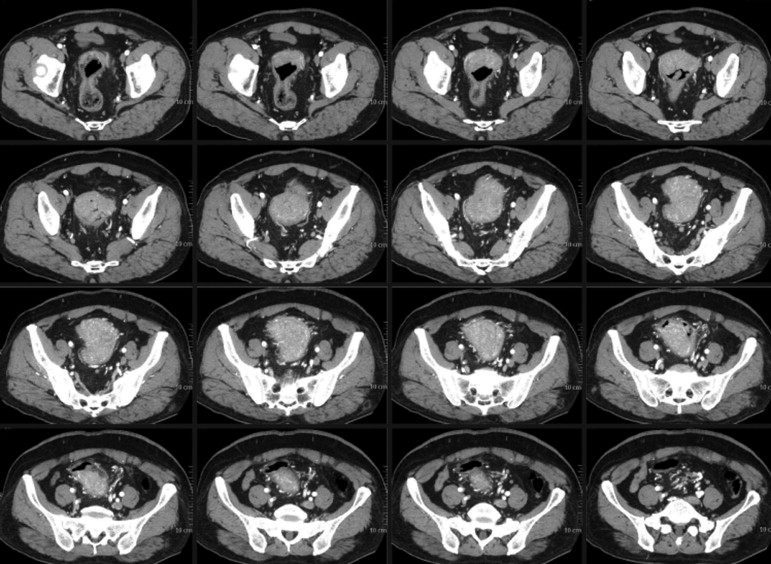
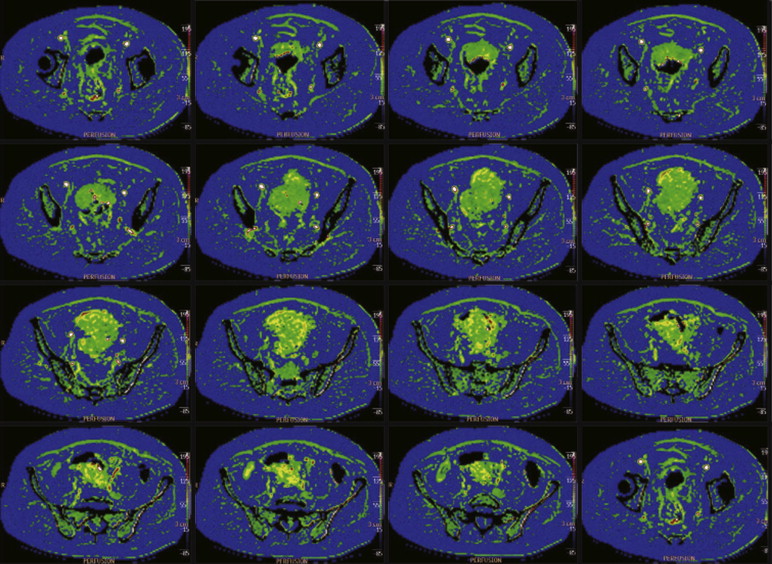
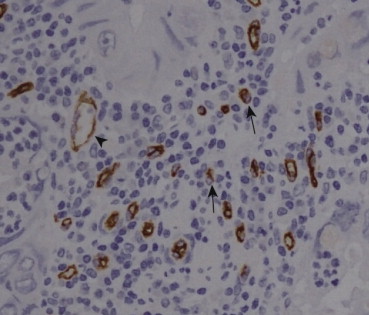
Thirty-seven patients with CRC confirmed by endoscopic pathology underwent whole-volume perfusion CT assessments with a 256-slice CT and surgery. Quantitative values for blood flow, blood volume, and time to peak were determined using commercial software. After surgery, resected specimens were analyzed immunohistochemically with CD105 antibodies for the quantification of microvessel density (MVD). The difference in CT perfusion parameters and MVD among different tumor differentiation grades was evaluated by the Student–Newman–Keuls test. The correlations between CT perfusion parameters and MVD were evaluated using the Pearson correlation analysis.
Results
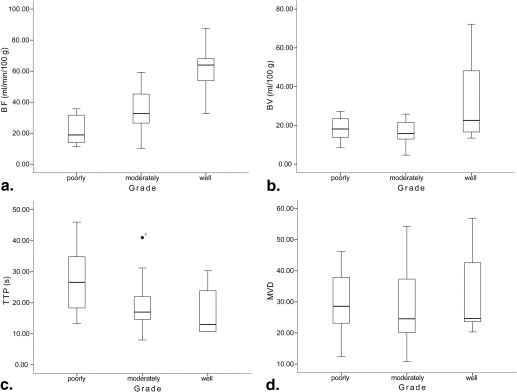
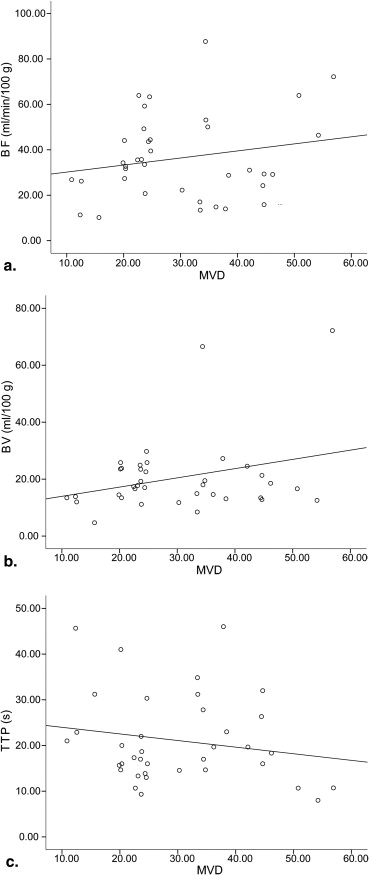
The mean blood flow was significantly different among well, moderately, and poorly differentiated groups (61.17 ± 17.97, 34.80 ± 13.06, and 22.24 ± 9.31 mL/minute/100 g, respectively; P < .05). The blood volume in the well-differentiated group was significantly higher than that in the moderately differentiated group (33.96 ± 24.81 vs. 16.93 ± 5.73 mL/100 g; P = .002) and that in the poorly differentiated group (33.96 ± 24.81 vs. 18.05 ± 6.01 mL/100 g; P = .009). The time to peak in the poorly differentiated group was significantly longer than that in the well-differentiated group (27.81 ± 11.95 vs. 17.60 ± 8.53 seconds; P = .016) and that in the moderately differentiated group (27.81 ± 11.95 vs. 18.94 ± 7.47 seconds; P = .028). There was no significant difference in the MVD among well, moderately, and poorly differentiated groups (33.47 ± 14.69, 28.89 ± 11.82, and 29.89 ± 11.02, respectively; P > .05). There was no significant correlation between CT perfusion parameters and MVD ( r = 0.201, 0.295, and −0.178, respectively; P = .233, .076, and .292, respectively).
Conclusions
CT whole-volume perfusion technology has the potential to evaluate pathologic differentiation grade of CRC before surgery. However, preoperative perfusion CT parameters do not reflect the MVD of CRC.
Colorectal cancer (CRC) is the third most common cancer and the fourth most frequent cause of cancer deaths worldwide . The 5-year survival rate depends on the tumor stage and grade at patient presentation. Tumors with an advanced stage and grade at diagnosis are associated with a poor outcome. Individual treatment strategy based on tumor stage and grade should be applied to improve the prognosis. Thus, the preoperative diagnostic evaluation and grading of CRC are important . Preoperative specimens from endoscopic colorectal biopsies are often used but are normally failed to grade tumor because of the lack of sufficient tissue . Angiogenesis, which is important in the growth and metastasis of carcinomas, has been reported to be a promising prognostic marker for the CRC . Microvessel density (MVD) count is used to define the degree of angiogenesis in solid tumors for diagnostic purpose and treatment planning, which is calculated by counting the number of angiogenic blood vessels highlighted on a variety of immunohistochemical stains . However, information pertaining to the MVD can only be gathered in the in vitro setting after the resection of the tumor, and therefore there is no opportunity to evaluate the effect of neoadjuvant radiochemotherapy and antiangiogenic therapy on this parameter.
Perfusion computed tomography (CT) can quantify tumor angiogenesis noninvasively by assessing the enhancement of the tissue and vessels over time. Perfusion parameters, including tissue blood flow (BF), blood volume (BV), time to peak (TTP), and permeability–surface area product (PS), are calculated using the mathematical models for contrast agent exchange . Goh et al. reported the relationship between CT perfusion parameters and MVD counts and their data indicated a positive correlation between tumor PS and BV with MVD in CRC, inconsistent with the report by Li et al. , which showed no significant correlation between any perfusion parameters with MVD. Both the studies were based on the deconvolution approach, but the scanning equipments, scanning modes, analytical software were different, which might be the potential explanation for such differences and make the standardization of the technique difficult . Romani et al. reported that CD105 (endoglin)-staining intensities in CRCs were correlated with the MVD levels and were better indicators of the state of tumor angiogenesis. Previous CRC CT perfusion studies usually use one slice or a few slices of the tumor to represent the overall tumor angiogenesis state, and to some degree, this sampling rate is not sufficient because of the heterogeneity of tumor angiogenesis. Additionally, the lesion on CT images is not exactly the same as the pathologic specimen in the orientation, shape, and size, which makes it difficult to achieve precise alignment. Therefore, we analyzed primary CRC using whole-volume perfusion CT measurements and assessed whether perfusion CT could be used to evaluate the pathologic grade and the correlation between perfusion parameters and MVD stained with CD105 in CRC.
Materials and methods
Patients
Get Radiology Tree app to read full this article<
Imaging Study
Get Radiology Tree app to read full this article<
Imaging Analysis
Get Radiology Tree app to read full this article<
Get Radiology Tree app to read full this article<
Assessment of Tumor Grade, Immunohistochemical Staining, and Quantification of MVD
Get Radiology Tree app to read full this article<
Get Radiology Tree app to read full this article<
Statistical Analysis
Get Radiology Tree app to read full this article<
Results
Get Radiology Tree app to read full this article<
Table 1
Reproducibility for BF, BV, and TTP Measurements
Perfusion Parameters Differences between Measurements (Mean ± SD) 95% CI 95% Limits of Agreement ICC (95% CI) BF (mL/minute/100 g) −0.07 ± 0.36 −0.23 to 0.10 −0.77 to 0.64 0.9997 (0.9993–0.9999) BV (mL/100 g) −0.01 ± 0.66 −0.29 to 0.32 −1.28 to 1.30 0.9939 (0.9845–0.9976) TTP(s) 0.32 ± 0.63 −0.03 to 0.61 −0.91 to 1.55 0.9976 (0.9939–0.9990)
BF, blood flow; BV, blood volume; 95% CI, 95% confidence interval; ICC, interclass correlation coefficient; TTP, time to peak.
Table 2
BF, BV, and TTP Measurements for the Different Tumor Differentiation Grades
CT Perfusion Parameter Well Differentiated ( n = 7) Moderately Differentiated ( n = 20) Poorly Differentiated ( n = 10)P Value BF (mL/minute/100 g) 61.17 ± 17.97 34.80 ± 13.06 22.24 ± 9.31 <.05 BV (mL/100 g) 33.96 ± 24.81 16.93 ± 5.73 18.05 ± 6.01 <.05 TTP (second) 17.60 ± 8.53 18.94 ± 7.47 27.81 ± 11.95 <.05 MVD 33.47 ± 14.69 28.89 ± 11.82 29.89 ± 11.02 >.05
BF, blood flow; BV, blood volume; CT, computed tomography; MVD, microvessel density; TTP, time to peak.
Data shown for BF, BV, and TTP are the mean values (±SD) of all individual sections involved. The MVD data represent the mean of the three highest counts per tumor in three portions.
Get Radiology Tree app to read full this article<
Discussion
Get Radiology Tree app to read full this article<
Get Radiology Tree app to read full this article<
Get Radiology Tree app to read full this article<
Get Radiology Tree app to read full this article<
Get Radiology Tree app to read full this article<
Conclusions
Get Radiology Tree app to read full this article<
Acknowledgments
Get Radiology Tree app to read full this article<
Get Radiology Tree app to read full this article<
References
1. Weitz J., Koch M., Debus J., et. al.: Colorectal cancer. Lancet 2005; 365: pp. 153-165.
2. Compton C.C., Fielding L.P., Burgart L.J., et. al.: Prognostic factors in colorectal cancer. College of American Pathologists Consensus Statement 1999. Arch Pathol Lab Med 2000; 124: pp. 979-994.
3. Fleming M., Ravula S., Tatishchev S.F., et. al.: Colorectal carcinoma: pathologic aspects. J Gastrointest Oncol 2012; 3: pp. 153-173.
4. Hanahan D., Folkman J.: Patterns and emerging mechanisms of the angiogenic switch during tumorigenesis. Cell 1996; 86: pp. 353-364.
5. Vermeulen P., Gasparini G., Fox S., et. al.: Quantification of angiogenesis in solid human tumours: an international consensus on the methodology and criteria of evaluation. Eur J Cancer 1996; 32: pp. 2474-2484.
6. Weidner N., Folkman J., Pozza F., et. al.: Tumor angiogenesis: a new significant and independent prognostic indicator in early-stage breast carcinoma. J Natl Cancer Inst 1992; 84: pp. 1875-1887.
7. Goh V., Halligan S., Daley F., et. al.: Colorectal tumor vascularity: quantitative assessment with multidetector CT—do tumor perfusion measurements reflect angiogenesis?. Radiology 2008; 249: pp. 510-517.
8. Miles K.: Measurement of tissue perfusion by dynamic computed tomography. Br J Radiol 1991; 64: pp. 409-412.
9. Li Z.P., Meng Q.F., Sun C.H., et. al.: Tumor angiogenesis and dynamic CT in colorectal carcinoma: radiologic-pathologic correlation. World J Gastroenterol 2005; 11: pp. 1287-1291.
10. Dighe S., Blake H., Jeyadevan N., et. al.: Perfusion CT vascular parameters do not correlate with immunohistochemically derived microvessel density count in colorectal tumors. Radiology 2013; 268: pp. 400-410.
11. Romani A.A., Borghetti A.F., Del Rio P., et. al.: The risk of developing metastatic disease in colorectal cancer is related to CD105-positive vessel count. J Surg Oncol 2006; 93: pp. 446-455.
12. Kämmerer U., Kapp M., Gassel A.M., et. al.: A new rapid immunohistochemical staining technique using the EnVision antibody complex. J Histochem Cytochem 2001; 49: pp. 623-630.
13. Weidner N.: Intratumor microvessel density as a prognostic factor in cancer. Am J Pathol 1995; 147: pp. 9-19.
14. Vermeulen P., Gasparini G., Fox S., et. al.: Second international consensus on the methodology and criteria of evaluation of angiogenesis quantification in solid human tumours. Eur J Cancer 2002; 38: pp. 1564-1579.
15. Bland M.J., Altman D.G.: Statistical methods for assessing agreement between two methods of clinical measurement. Lancet 1986; 327: pp. 307-310.
16. George M., Dzik-Jurasz A., Padhani A., et. al.: Non-invasive methods of assessing angiogenesis and their value in predicting response to treatment in colorectal cancer. Br J Surg 2001; 88: pp. 1628-1636.
17. Kim J.W., Jeong Y.Y., Chang N.K., et. al.: Perfusion CT in colorectal cancer: comparison of perfusion parameters with tumor grade and microvessel density. Korean J Radiol 2012; 13: pp. S89-S97.
18. Ng Q.S., Goh V., Fichte H., et. al.: Lung cancer perfusion at multi–detector row CT: reproducibility of whole tumor quantitative measurements. Radiology 2006; 239: pp. 547-553.
19. Li Y., Yang Z.G., Chen T.W., et. al.: Whole tumour perfusion of peripheral lung carcinoma: evaluation with first-pass CT perfusion imaging at 64-detector row CT. Clin Radiol 2008; 63: pp. 629-635.
20. Jung I., Gurzu S., Raica M., et. al.: The differences between the endothelial area marked with CD31 and CD105 in colorectal carcinomas by computer-assisted morphometrical analysis. Rom J Morphol Embryol 2009; 50: pp. 239-243.
21. Saad R.S., Liu Y.L., Nathan G., et. al.: Endoglin (CD105) and vascular endothelial growth factor as prognostic markers in colorectal cancer. Mod Pathol 2003; 17: pp. 197-203.
22. Hayano K., Shuto K., Koda K., et. al.: Quantitative measurement of blood flow using perfusion CT for assessing clinicopathologic features and prognosis in patients with rectal cancer. Dis Colon Rectum 2009; 52: pp. 1624-1629.
23. Dugdale P.E., Miles K.A., Bunce I., et. al.: CT measurement of perfusion and permeability within lymphoma masses and its ability to assess grade, activity, and chemotherapeutic response. J Comput Assist Tomogr 1999; 23: pp. 540-547.
24. Goh V., Halligan S., Bartram C.I.: Quantitative tumor perfusion assessment with multidetector CT: are measurements from two commercial software packages interchangeable?. Radiology 2007; 242: pp. 777-782.
25. Sahani D.V., Holalkere N.S., Mueller P.R., et. al.: Advanced hepatocellular carcinoma: CT perfusion of liver and tumor tissue—initial experience. Radiology 2007; 243: pp. 736-743.
26. D’Onofrio M., Gallotti A., Mantovani W., et. al.: Perfusion CT can predict tumoral grading of pancreatic adenocarcinoma. Eur J Radiol 2013; 82: pp. 227-233.