
Rationale and Objectives
We investigate associations between measures of mammographic parenchymal complexity and false-positive (FP) recall from screening with digital mammography (DM) versus digital breast tomosynthesis (DBT).
Materials and Methods
We retrospectively analyzed data from 541 women recruited by the American College of Radiology Imaging Network 4006 trial, designed to evaluate callback and detection rates from screening with DM versus combined DM and DBT. Of these, 68 and 56 were FPs based on DM alone versus the combined DM/DBT readings, respectively. Mammographic complexity was quantified with computerized texture analysis and percent density. Logistic regression was performed to evaluate associations between extracted features and FP recall, after adjusting for age and number of previous benign biopsies. Odds ratios and area under the curve (AUC) of the receiver operating characteristic were used to assess association strength.
Results
For DM, age, previous benign biopsies and texture features of correlation, inverse difference moment, sum average, and sum variance were deemed as significant predictors ( P <.05) of FP recall, with an AUC = 0.77. For DBT, age was the only significant predictor of FP recall with AUC = 0.64. Using exploratory receiver operating characteristic thresholds for which no true-positives would be missed, a potential FP reduction of 23.5% and 8.9% was demonstrated, respectively, for DM alone versus DM/DBT.
Conclusion
Measures of breast complexity measured on 2D digital mammograms are indicative of the likelihood for FP recall from screening with DM, and could help identify women who could benefit from supplemental screening, including DBT.
Introduction
False-positive (FP) recall from breast cancer screening is defined as being called back from screening for further assessment without breast cancer being subsequently detected. Currently, the majority of recalls from screening with digital mammography (DM) are FP, contributing to an overall low positive predictive value (PPV) and concerns for over-imaging . This issue of FP recalls has been cited as a major contributing factor in many recent studies calling into question the true benefits and effectiveness of breast cancer screening programs . Reducing unnecessary FP events, without compromising the sensitivity of cancer detection, could reduce the overall cost related to any breast cancer screening program due to less diagnostic workup and fewer biopsy procedures, while also reducing unnecessary physical pain, psychological trauma and, potentially, scarring from unnecessary biopsy procedures . Digital breast tomosynthesis (DBT) is emerging as an alternative modality to complement or even replace DM, which has spurred the investigation of its potential benefits within the screening paradigm, especially in reducing FP recalls . In DBT, tomographic breast images are reconstructed from multiple X-ray projections to produce a “quasi-3D” rendition of the breast, allowing superior breast tissue visualization and reducing the effect of tissue superposition inherent to 2D imaging .
In an ideal personalized paradigm, a prior test could be used to identify women at high-risk for such FP events, allowing for better implementations of individualized breast cancer screening protocols where supplemental screening tests could be offered to women for whom conventional mammography may have low specificity. Presently, mammographic breast density is a known risk factor for FP events . Breast density, which is commonly used to characterize the complexity of the breast tissue, is also known to confound the sensitivity of screening mammography . However, the commonly used mammographic density measures (ie, percent density [PD] and/or the ACR BI-RADS categories) are global imaging descriptors that may not adequately capture the spatially localized conspicuities and complexity of the breast parenchymal tissue, which may be driving FP recalls . We hypothesize that mammographic features of parenchymal texture, computed in a spatially adaptive manner which characterizes local regions of confounding tissue texture, can provide complementary information to the more global density measures in describing the complexity of the breast tissue and therefore augment the assessment of the likelihood for an FP screening event. Previous literature has suggested potential relationships between parenchymal texture features and breast cancer risk . Here we use a locally adaptive texture analysis algorithm to quantify mammographic parenchymal complexity and investigate associations between such texture features and FP recall from breast cancer screening. We also examine if these features have a stronger association with FP recall from DM versus DBT screening, which would further suggest that DBT could be used as a replacement or supplement to DM for women with more texturally complex breast tissue.
Materials and Methods
Imaging
Get Radiology Tree app to read full this article<
Mammographic Density Estimation
Get Radiology Tree app to read full this article<
Get Radiology Tree app to read full this article<
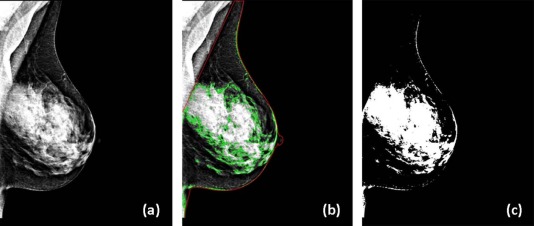
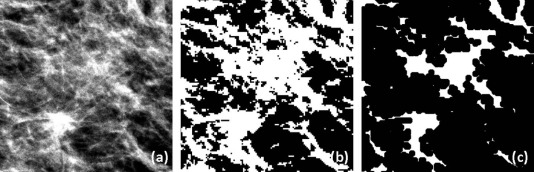
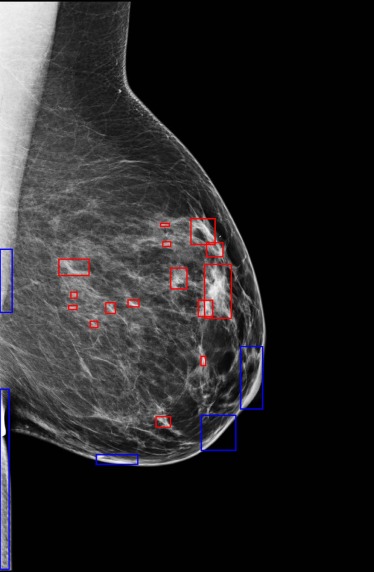
Parenchymal Texture Analysis
Get Radiology Tree app to read full this article<
ri=∣∣Rforegroundi∣∣|Ri| r
i
=
|
R
i
foreground
|
|
R
i
|
where Ri R
i is the i -th ROI rectangular box, Rforegroundi R
i
foreground is the region corresponding to the foreground pixels of Ri R
i , and |⋅| |
⋅
| returns the region (or area) of a given input argument. If ri r
i is less than a prefixed threshold (set to 0.15 based on empirical evidence ) for a specific ROI, then the ROI is marked as erroneous and not further used in localized texture analysis. The second criteria used is estimating the area of each ROI and computing its square root (assuming the window is square). If this length measurement is outside of a specified millimeter value range (ie, here set to 1.12–17.92 mm based on prior studies to prevent the selection of unrealistically small ROIs or overly large ROI essentially comprising the whole image), the selected ROI is discarded. The final criteria applied calculate a ratio defined as the percent of the ROI within its corresponding processed breast mask region. If this ratio is under 50%, the ROI is dismissed because it likely covers too much air, skin, or pectoral regions.
Get Radiology Tree app to read full this article<
Get Radiology Tree app to read full this article<
Statistical Analysis
Get Radiology Tree app to read full this article<
Get Radiology Tree app to read full this article<
Get Radiology Tree app to read full this article<
Results
Get Radiology Tree app to read full this article<
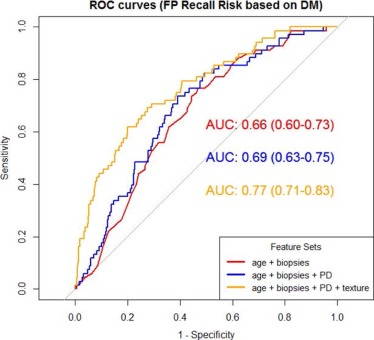
TABLE 1
Summary Table for Logistic Regression Analysis of FP Recall Decision From DM Interpretation Alone, for the Stepwise Regression Feature Set
Feature Predictor Quartile Coefficient Estimates (B)P -Values OR OR 95% CI Age \* N/A −0.058 .000 0.943 0.915–0.973 Number of previous benign biopsies \* N/A −0.784 .033 0.457 0.222–0.940 f2 (correlation) 2 0.304 .514 1.355 0.543–3.381 3 \* 1.448 .005 4.225 1.545–11.717 4 0.657 .312 1.930 0.539–6.907 f5 (inverse difference moment) 2 \* 1.024 .038 2.783 1.057–7.332 3 0.259 .638 1.296 0.440–3.819 4 0.444 .477 1.559 0.459–5.301 f6 (sum average) 2 −0.034 .942 0.967 0.388–2.408 3 \* 1.036 .011 2.817 1.263–6.282 4 \* 1.031 .017 2.804 1.200–6.551 f7 (sum variance) 2 \* −1.341 .008 0.261 0.098–0.701 3 \* −1.189 .036 0.305 0.100–0.924 4 −0.657 .360 0.518 0.127–2.114 f10 (difference variance) 2 0.739 .113 2.093 0.839–5.224 3 −0.110 .863 0.896 0.259–3.096 4 −0.512 .498 0.600 0.136–2.634
CI, confidence interval; DM, digital mammography; FP, false-positive; OR, odds ratio.
The texture features of correlation (f2), inverse difference moment (f5), sum average (f6), sum variance (f7), difference variance (f10) are coded as categorical with each predictor’s 2nd, 3 rd , or 4th quartile being compared to the reference 1st quartile for its corresponding values.
Get Radiology Tree app to read full this article<
Get Radiology Tree app to read full this article<
Get Radiology Tree app to read full this article<
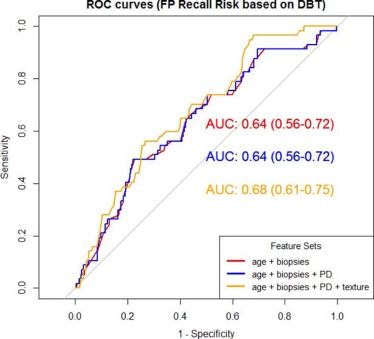
TABLE 2
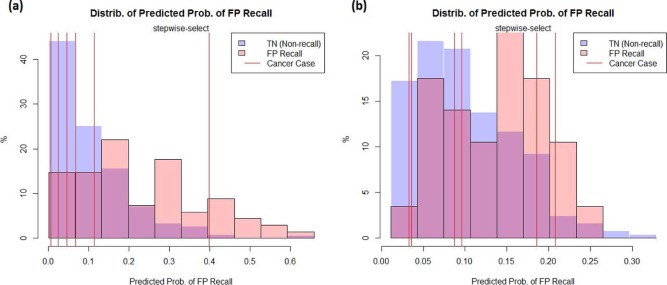
Summary Table for Logistic Regression Analysis of FP Recall Decision From Combined DM/DBT Interpretation for the Stepwise Selection Feature Set With Statistically Significant Predictors Indicated by Asterisks
Feature Predictor Coefficient Estimates (B)P -Values OR OR 95% CI Age \* −0.043 0.003 0.958 0.932–0.985
CI, confidence interval; DM/DBT, digital mammography/digital breast tomosynthesis; FP, false-positive; OR, odds ratio.
Out of all predictors evaluated, only age was significant.
Get Radiology Tree app to read full this article<
Get Radiology Tree app to read full this article<
Get Radiology Tree app to read full this article<
Get Radiology Tree app to read full this article<
Discussion
Get Radiology Tree app to read full this article<
![Figure 7, Example of left mediolateral oblique (MLO) digital mammograms of (a) a 63-year-old woman with a false-positive recall from screening (percent density [PD] = 11.30% and Breast Imaging-Reporting and Data System (BIRADS) density = “heterogeneously dense”) and (b) a 56-year-old woman not recalled from screening (PD = 13.39% and BIRADS = “heterogeneously dense”); both have the same BIRADS score and a similar low PD but visually different complexity patterns, with the false-positive (FP) recall case having higher complexity (texture inverse difference moment = 0.579) than the non-recalled case (texture inverse difference moment = 0.557).](https://storage.googleapis.com/dl.dentistrykey.com/clinical/AssociationbetweenBreastParenchymalComplexityandFalsePositiveRecallFromDigitalMammographyVersusBreastTomosynthesis/6_1s20S1076633216300150.jpg)
Get Radiology Tree app to read full this article<
Get Radiology Tree app to read full this article<
Get Radiology Tree app to read full this article<
Get Radiology Tree app to read full this article<
Get Radiology Tree app to read full this article<
Conclusions
Get Radiology Tree app to read full this article<
Appendix A
Haralick Texture Features
Get Radiology Tree app to read full this article<
P(i,j)=|{(x1,y1),(x2,y2)f(x1,y1)=i,f(x2,y2)=j,x2−x1=l|cosθ|,y2−y1=l|sinθ|}| P
(
i
,
j
)
=
|
{
(
x
1
,
y
1
)
,
(
x
2
,
y
2
)
f
(
x
1
,
y
1
)
=
i
,
f
(
x
2
,
y
2
)
=
j
,
x
2
−
x
1
=
l
|
cos
θ
|
,
y
2
−
y
1
=
l
|
sin
θ
|
}
|
Get Radiology Tree app to read full this article<
Get Radiology Tree app to read full this article<
p(i,j)=P(i,j)/∑i∑jP(i,j) p
(
i
,
j
)
=
P
(
i
,
j
)
/
∑
i
∑
j
P
(
i
,
j
)
Get Radiology Tree app to read full this article<
Get Radiology Tree app to read full this article<
Table A1
Mathematical Definitions of the 13 Co-occurrence Features Used in the Analysis
Feature Equation Notations Energy (f1)
f1=∑Ngi=1∑Ngj=1p(i,j)2 f
1
=
∑
i
=
1
N
g
∑
j
=
1
N
g
p
(
i
,
j
)
2
N g : Number of gray-levels in image
px(i)=∑Ngj=1P(i,j) p
x
(
i
)
=
∑
j
=
1
N
g
P
(
i
,
j
)
py(j)=∑Ngi=1p(i,j) p
y
(
j
)
=
∑
i
=
1
N
g
p
(
i
,
j
)
px+y(k)=∑Ngi=1∑Ngj=1p(i,j) p
x
+
y
(
k
)
=
∑
i
=
1
N
g
∑
j
=
1
N
g
p
(
i
,
j
)
With |i+j|=k |
i
+
j
|
=
k and k=2,3,…,2Ng k
=
2
,
3
,
…
,
2
N
g
px−y(k)=∑Ngi=1∑Ngj=1p(i,j) p
x
−
y
(
k
)
=
∑
i
=
1
N
g
∑
j
=
1
N
g
p
(
i
,
j
)
With |i−j|=k |
i
−
j
|
=
k and k=0,1,…,Ng−1 k
=
0
,
1
,
…
,
N
g
−
1
HXY=−∑Ngi=1∑Ngj=1p(i,j)log(p(i,j)) H
X
Y
=
−
∑
i
=
1
N
g
∑
j
=
1
N
g
p
(
i
,
j
)
log
(
p
(
i
,
j
)
)
HXY1=−∑Ngi=1∑Ngj=1p(i,j)log(px(i)py(i)) H
X
Y
1
=
−
∑
i
=
1
N
g
∑
j
=
1
N
g
p
(
i
,
j
)
log
(
p
x
(
i
)
p
y
(
i
)
)
HXY2=−∑Ngi=1∑Ngj=1px(i)py(j)log(px(i)py(i)) H
X
Y
2
=
−
∑
i
=
1
N
g
∑
j
=
1
N
g
p
x
(
i
)
p
y
(
j
)
log
(
p
x
(
i
)
p
y
(
i
)
)
HX is entropy of p x , HY is entropy of p y
µ x , µ y , σ x , σ y are means and std. dev. of p x and p y , respectively
Correlation (f2)
f2=∑i∑j(i,j)p(i,j)−μxμyσxσy f
2
=
∑
i
∑
j
(
i
,
j
)
p
(
i
,
j
)
−
μ
x
μ
y
σ
x
σ
y
Entropy (f3)
f3=−∑Ngi=1∑Ngj=1p(i,j)log(p(i,j)) f
3
=
−
∑
i
=
1
N
g
∑
j
=
1
N
g
p
(
i
,
j
)
log
(
p
(
i
,
j
)
)
Contrast (f4)f4=∑Ng−1n=0n2∑Ngi=1∑Ngj=1p(i,j) f
4
=
∑
n
=
0
N
g
−
1
n
2
∑
i
=
1
N
g
∑
j
=
1
N
g
p
(
i
,
j
)
with |i−j|=n |
i
−
j
|
=
n Inverse difference moment (f5)
f5=∑i∑j11+(i−j)2p(i,j) f
5
=
∑
i
∑
j
1
1
+
(
i
−
j
)
2
p
(
i
,
j
)
Sum average (f6)
f6=∑2Ngi=2ipx+y(i) f
6
=
∑
i
=
2
2
N
g
i
p
x
+
y
(
i
)
Sum variance (f7)
f7=∑2Ngi=2(i−f8)2px+y(i) f
7
=
∑
i
=
2
2
N
g
(
i
−
f
8
)
2
p
x
+
y
(
i
)
Sum entropy (f8)
f8=−∑2Ngi=2px+y(i)log(px+y(i)) f
8
=
−
∑
i
=
2
2
N
g
p
x
+
y
(
i
)
log
(
p
x
+
y
(
i
)
)
Difference average (f9)
f9=averageofpx−y f
9
=
average
o
f
p
x
−
y
Difference variance (f10)
f10=varianceofpx−y f
10
=
variance
o
f
p
x
−
y
Difference entropy (f11)
f11=−∑Ng−1i=0px−y(i)log(px−y(i)) f
11
=
−
∑
i
=
0
N
g
−
1
p
x
−
y
(
i
)
log
(
p
x
−
y
(
i
)
)
Information measure of correlation 1 (f12)
f12=HXY−HXY1max(HX,HY) f
12
=
H
X
Y
−
H
X
Y
1
max
(
H
X
,
H
Y
)
Information measure of correlation 2 (f13)
f13=(1−e−2.0|HXY2−HXY|)1/2 f
13
=
(
1
−
e
−
2.0
|
H
X
Y
2
−
H
X
Y
|
)
1
/
2
Get Radiology Tree app to read full this article<
Get Radiology Tree app to read full this article<
References
1. Christiansen C.L., Wang F., Barton M.B., et. al.: Predicting the cumulative risk of false-positive mammograms. J Natl Cancer Inst 2000; 92: pp. 1657-1666.
2. Bleyer A., Welch H.G.: Effect of three decades of screening mammography on breast-cancer incidence. N Engl J Med 2012; 367: pp. 1998-2005.
3. Independent UK Panel on Breast Cancer Screening : The benefits and harms of breast cancer screening: an independent review. Lancet 2012; 380: pp. 1778-1786.
4. Miller A.B., Wall C., Baines C.J., et. al.: Twenty five year follow-up for breast cancer incidence and mortality of the Canadian National Breast Screening Study: randomised screening trial. BMJ 2014; 348: pp. g366.
5. Schousboe J.T., Kerlikowske K., Loh A., et. al.: Personalizing mammography by breast density and other risk factors for breast cancer: analysis of health benefits and cost-effectiveness. Ann Intern Med 2011; 155: pp. 10-20.
6. Brett J., Austoker J.: Women who are recalled for further investigation for breast screening: psychological consequences 3 years after recall and factors affecting re-attendance. J Public Health (Bangkok) 2001; 23: pp. 292-300.
7. Houssami N., Skaane P.: Overview of the evidence on digital breast tomosynthesis in breast cancer detection. Breast 2013; 22: pp. 101-108.
8. Skaane P., Bandos A.I., Gullien R., et. al.: Comparison of digital mammography alone and digital mammography plus tomosynthesis in a population-based screening program. Radiology 2013; 267: pp. 47-56.
9. Friedewald S.M., Rafferty E.A., Rose S.L., et. al.: Breast cancer screening using tomosynthesis in combination with digital mammography. JAMA 2014; 311: pp. 2499-2507.
10. McCarthy A.M., Kontos D., Synnestvedt M., et. al.: Screening outcomes following implementation of digital breast tomosynthesis in a general-population screening program. J Natl Cancer Inst 2014; 106: pp. dju316.
11. Conant E.F.: Clinical implementation of digital breast tomosynthesis. Radiol Clin North Am 2014; 52: pp. 499-518.
12. Lehman C., White E., Peacock S., et. al.: Effect of age and breast density on screening mammograms with false-positive findings. AJR Am J Roentgenol 1999; 173: pp. 1651-1655.
13. Boyd N.F., Guo H., Martin L.J., et. al.: Mammographic density and the risk and detection of breast cancer. NEJM 2007; 356: pp. 227-236.
14. Sickles E., D’Orsi C., Bassett L., et. al.: ACR BI-RADS® mammography.2013.ACR BI-RADS Atlas, Breast Imaging Reporting and Data Systempp. 141-167.
15. Li H., Giger M.L., Olopade O.I., et. al.: Fractal analysis of mammographic parenchymal patterns in breast cancer risk assessment. Acad Radiol 2007; 14: pp. 513-521.
16. Li H., Giger M.L., Olopade O.I., et. al.: Computerized texture analysis of mammographic parenchymal patterns of digitized mammograms. Acad Radiol 2005; 12: pp. 863-873.
17. Wolfe J.N.: Breast patterns as an index of risk for developing breast cancer. AJR Am J Roentgenol 1976; 126: pp. 1130-1137.
18. Conant E., Maidment A., Copit D., et. al.: OT2-05-04: ACRIN PA 4006: comparison of full-field digital mammography with digital breast tomosynthesis image acquisition in relation to screening call-back rate. Cancer Res 2011; 71:
19. Ray S., Choi J.Y., Keller B.M., et. al.: Application of computer-extracted breast tissue texture features in predicting false-positive recalls fromscreening mammography.SPIE medical imaging: International Society for Optics and Photonics.2014. 90351X-X-7
20. Keller B.M., Hsieh M.M.K.: LIBRA: laboratory for individualized breast radiodensity assessment. Available at: https://www.cbica.upenn.edu/sbia/software/LIBRA/index.html Accessed February 8, 2016
21. Gastounioti A., Oustimov A., Keller B.M., et. al.: Associations of dense and fatty breast-tissue heterogeneity with breast cancer risk: preliminary evaluation using parenchymal texture measurements driven by breast anatomy.Radiological Society of North America (RSNA) annual meeting.2015. Chicago, IL
22. Byng J.W., Boyd N., Fishell E., et. al.: The quantitative analysis of mammographic densities. Phys Med Biol 1994; 39: pp. 1629.
23. Keller B.M., Nathan D.L., Wang Y., et. al.: Estimation of breast percent density in raw and processed full field digital mammography images via adaptive fuzzy c-means clustering and support vector machine segmentation. Med Phys 2012; 39: pp. 4903-4917.
24. Haralick R.M., Shanmugam K., Dinstein I.H.: Textural features for image classification. IEEE Trans Syst Man Cybern 1973; SMC-3: pp. 610-621.
25. Dougherty E.R., Lotufo R.A.: Hands-on morphological image processing.2003.SPIE PressBellingham, WApp. 4-8.
26. Soille P.: Morphological image analysis: principles and applications.2013.Springer-Verlag New York, Inc.Secaucus, NJpp. 173-175.
27. Haralick R.M., Shapiro L.G.: Computer and robot vision.1992.Addison-Wesley Longman Publishing Co., Inc.Boston, MApp. 28-48.
28. Li H., Giger M.L., Huo Z., et. al.: Computerized analysis of mammographic parenchymal patterns for assessing breast cancer risk: effect of ROI size and location. Med Phys 2004; 31: pp. 549-555.
29. Zheng Y., Keller B.M., Ray S., et. al.: Parenchymal texture analysis in digital mammography: a fully automated pipeline for breast cancer risk assessment. Med Phys 2015; 42: pp. 4149-4160.
30. Keller B.M., Oustimov A., Wang Y., et. al.: Parenchymal texture analysis in digital mammography: robust texture feature identification and equivalence across devices. J Med Imaging (Bellingham) 2015; 2: pp. 024501.
31. Daye D., Keller B., Conant E.F., et. al.: Mammographic parenchymal patterns as an imaging marker of endogenous hormonal exposure: a preliminary study in a high-risk population. Acad Radiol 2013; 20: pp. 635-646.
32. Kontos D., Bakic P.R., Carton A.-K., et. al.: Parenchymal texture analysis in digital breast tomosynthesis for breast cancer risk estimation: a preliminary study. Acad Radiol 2009; 16: pp. 283-298.
33. Kontos D., Ikejimba L.C., Bakic P.R., et. al.: Analysis of parenchymal texture with digital breast tomosynthesis: comparison with digital mammography and implications for cancer risk assessment. Radiology 2011; 261: pp. 80-91.
34. Kutner M.H., Nachtsheim C., Neter J.: Applied linear regression models.2004.McGraw-Hill/IrwinNew York, NYpp. 406-408.
35. Menard S.: Applied logistic regression analysis.Second ed.2002.Sage Publications Inc.Thousand Oaks, CApp. 63-66.
36. DeLong E.R., DeLong D.M., Clarke-Pearson D.L.: Comparing the areas under two or more correlated receiver operating characteristic curves: a nonparametric approach. Biometrics 1988; 44: pp. 837-845.
37. R Core Team : R: a language and environment for statistical computing.2005.R Foundation for Statistical Computing
38. Van Der Sanden J., Hoekman D.: Review of relationships between grey-tone co-occurrence, semivariance, and autocorrelation based image texture analysis approaches. Can J Remote Sens 2005; 31: pp. 207-213.
39. Kumar R.M., Sreekumar K.: A survey on image feature descriptors. Int J Comput Sci Inf Technol 2014; 5: pp. 7668-7673.
40. Deeks J.J.: Systematic reviews in health care: systematic reviews of evaluations of diagnostic and screening tests. BMJ 2001; 323: pp. 157.