
Rationale and Objective
Breast cancer can be divided into four major molecular subtypes based on the expression of hormone receptor (estrogen receptor and progesterone receptor), human epidermal growth factor receptor 2, HER2 status, and molecular proliferation rate (Ki67). In this study, we sought to investigate the association between breast cancer subtype and radiological findings in the Chinese population.
Materials and Methods
Medical records of 300 consecutive invasive breast cancer patients were reviewed from the database: the Breast Imaging Reporting and Data System. The imaging characteristics of the lesions were evaluated. The molecular subtypes of breast cancer were classified into four types: luminal A, luminal B, HER2 overexpressed (HER2), and basal-like breast cancer (BLBC). Univariate and multivariate logistic regression analyses were performed to assess the association between the subtype (dependent variable) and mammography or 15 magnetic resonance imaging (MRI) indicators (independent variables).
Results
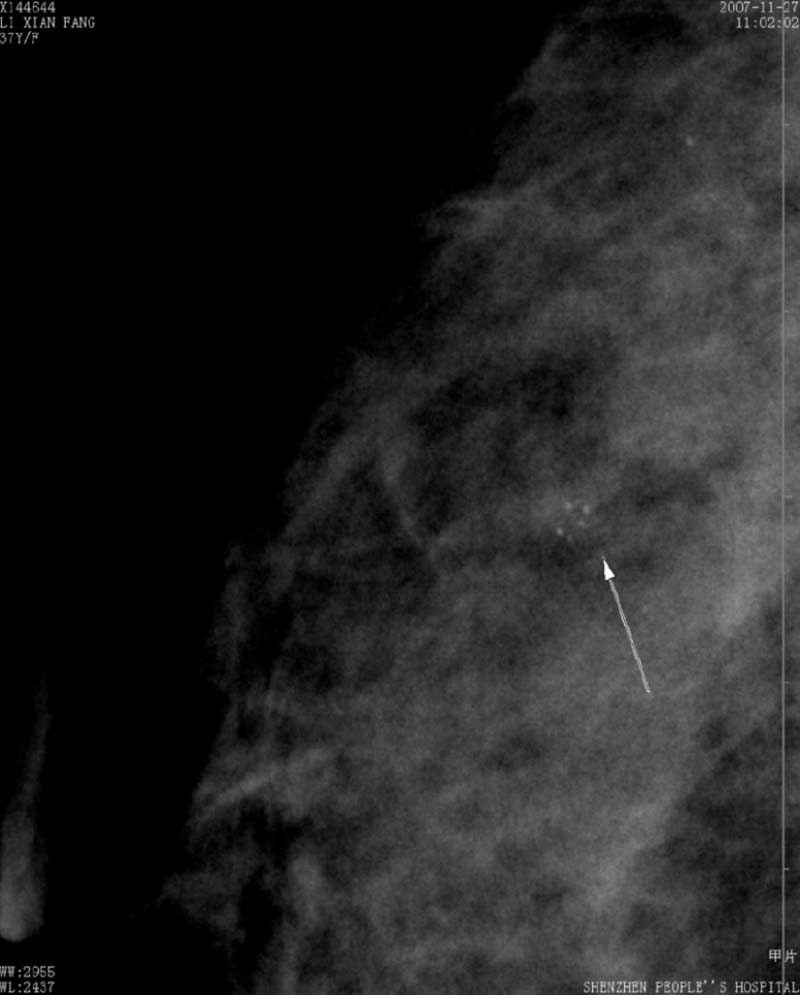
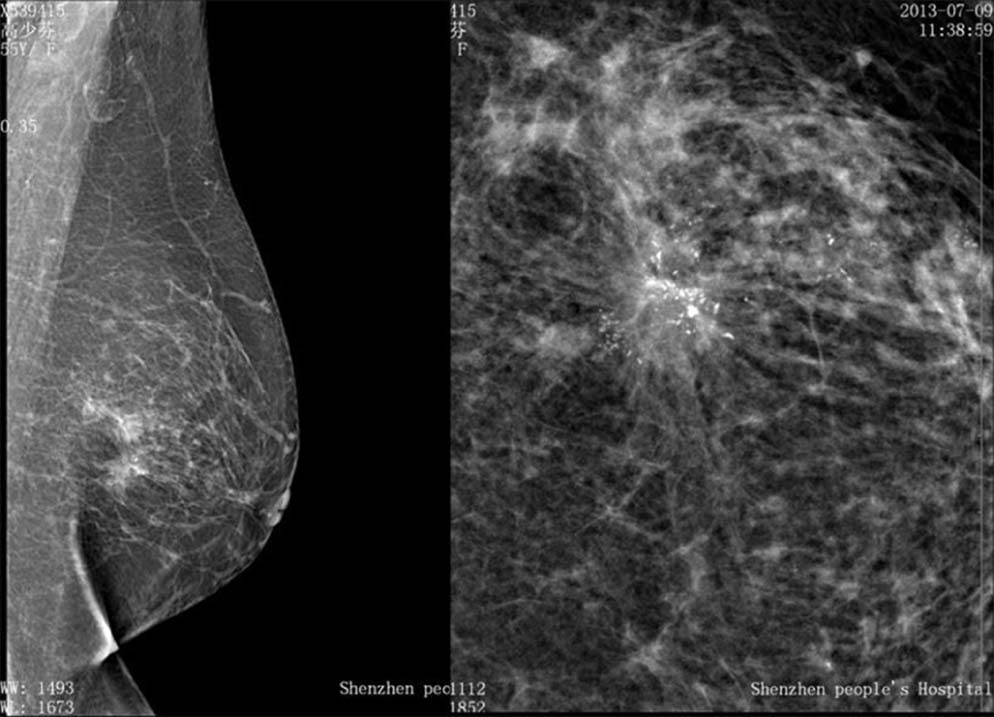
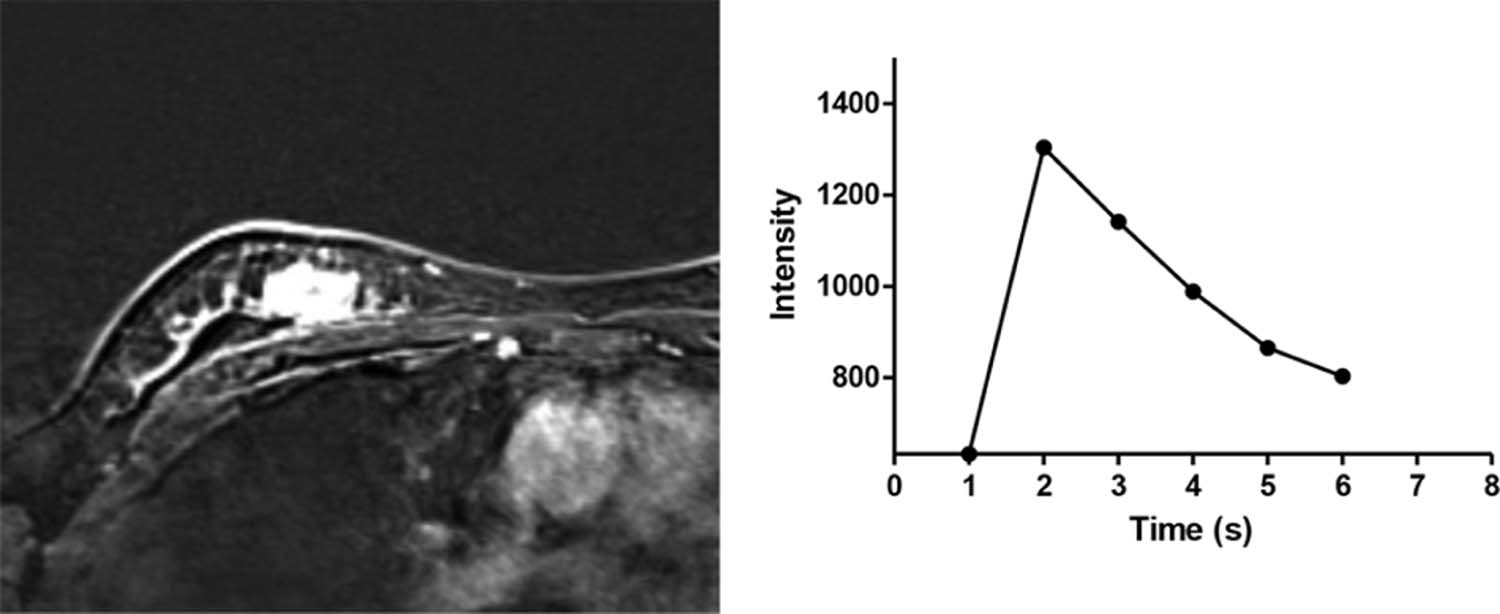
Luminal A and B subtypes were commonly associated with “clustered calcification distribution,” “nipple invasion,” or “skin invasion” ( P < 0.05). The BLBC subtype was more commonly associated with “rim enhancement” and persistent inflow type enhancement in delayed phase ( P < 0.05). HER2 overexpressed cancers showed association with persistent enhancement in the delayed phase on MRI and “clustered calcification distribution” on mammography ( P < 0.05).
Conclusion
Certain radiological features are strongly associated with the molecular subtype and hormone receptor status of breast tumor, which are potentially useful tools in the diagnosis and subtyping of breast cancer.
Introduction
Breast cancer is one of the most common cancers and one of the leading causes of death among women worldwide . It is a heterogeneous disease with several distinct molecular subtypes based on receptor status, including expression of estrogen receptor (ER), progesterone receptor (PR), and human epidermal growth factor receptor 2–neu (HER2). Immunochemistry staining of the proliferation marker Ki67 and epidermal growth factor receptor (EGFR) also aid in the molecular subtyping of breast cancer. There are four major molecular subtypes: luminal A (ER+ or PR+ and HER2−), luminal B (ER+ or PR+ and HER2+), HER2 (ER− and PR− and HER2+), and basal-like breast cancer (BLBC) (ER−, PR−, and HER2−), which has a significant overlap with triple-negative breast cancer . Determination of molecular subtype may aid in treatment planning and monitoring the efficacy of therapy .
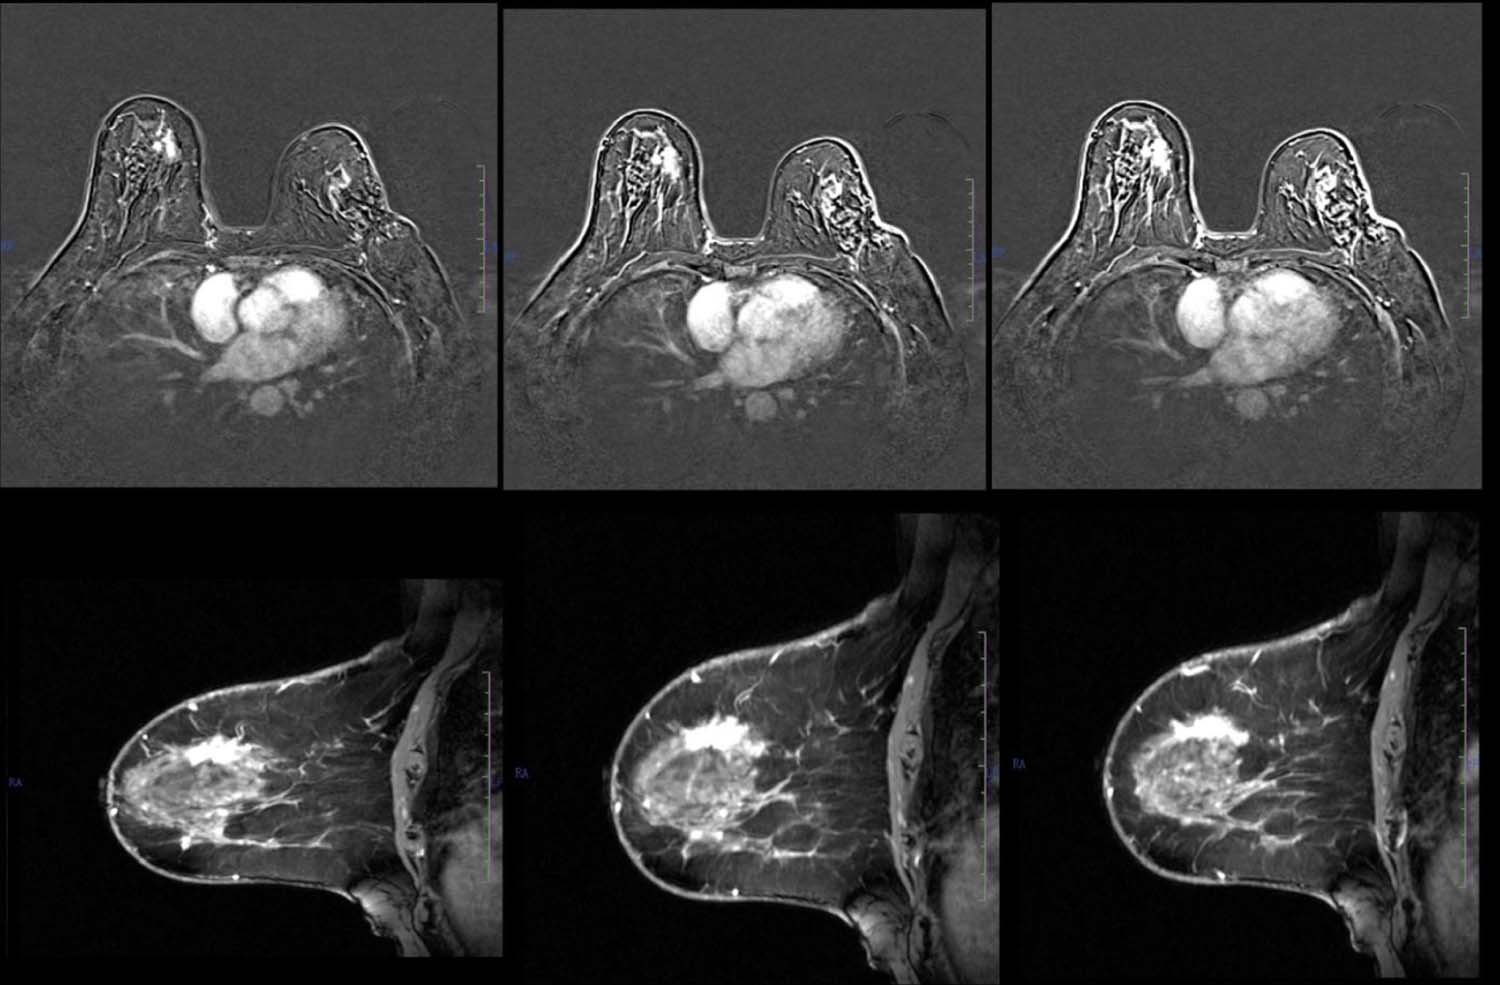
The different tumor biology of the molecular subtypes of breast cancer exhibits different morphologic patterns and microscopic pathology appearances . Different pathologic subtypes may cause different imaging features . We sought to investigate the association between imaging characteristics (ultrasound mammography and magnetic resonance imaging [MRI]) and the pathologic subtype of tumors.
Get Radiology Tree app to read full this article<
Materials and Methods
Patients
Get Radiology Tree app to read full this article<
Get Radiology Tree app to read full this article<
Mammography
Get Radiology Tree app to read full this article<
Magnetic Resonance Imaging
Get Radiology Tree app to read full this article<
Quantitative Indicators
Get Radiology Tree app to read full this article<
TABLE 1
List of the 25 Variables Analyzed in Our Study
X1 Age <35 years old: 1 35–45 years old: 2 46–55 years old: 3 X2 Premenstrual stage No = 0 Yes = 1 X3 Family history No = 0 Yes = 1 X4 Oral contraceptive history No = 0 Yes = 1 X5 Reproductive history No = 0 Yes = 1 X6 Breast feeding history No = 0 Yes = 1 X7 Oral contraceptive No = 0 Yes = 1 X8 Abortion history No = 0 Yes = 1 X9 Breast prosthesis implantation No = 0 Yes = 1 X10 Chest radiotherapy No = 0 Yes = 1 X11 Thickening of gland No = 0 Yes = 1 X12 Nipple discharge No = 0 Yes = 1 X13 Skin abnormalities No = 0 Yes = 1 X14 Palpable mass No = 0 Yes = 1 X15 Body posture Not standard = 0 Standard \* = 1 X16 Standard image Not standard = 0 Standard † = 1 X17 Breast composition categories Almost entirely fatty = 0 Scattered areas of fibroglandular density = 1 Heterogeneously dense = 2 Extremely dense = 3 X18 Mass morphology No mass = 0 Round or oval = 1 Leaf = 2 Irregular shape = 3 X19 Mass margins No mass = 0 Circumscribed = 1 Obscured = 2 Microlobulated = 3 Spiculated = 4 X20 Mass density No mass = 0 Low density = 1 Equal density = 2 High density = 3 X21 Calcification distribution No calcification = 0 Scattered =1 Regional = 2 Clustered = 3 Linear = 4 Banded = 5 X22 Calcification pattern No calcification = 0 Benign = 1 Intermediate = 2 Malignant = 3 X23 Structural distortions No structural distortion = 0 Structure disorder = 1 Structure disappeared = 2 X24 Presence of special signs (single catheter, internal mammary lymph nodes, non-compact symmetric) No = 0 One = 1 Two = 2 Three = 3 X25 Presence of merge signs (inverted nipple, skin sag, areolar thickening, skin thickening, lymph nodes) No = 0 One = 1 Two = 2 Three = 3 Five = 5
Get Radiology Tree app to read full this article<
Get Radiology Tree app to read full this article<
Get Radiology Tree app to read full this article<
Get Radiology Tree app to read full this article<
TABLE 2
Fifteen Magnetic Resonance Imaging Indicators Were Selected and Reviewed by Five Radiologists in This Study
M1: “breast tissue: amount of fibroglandular tissue” a, Almost entirely fat
b, Scattered fibroglandular tissue
c, Heterogeneous fibroglandular tissue
d, Extreme fibroglandular tissue M2: “breast tissue: background parenchymal enhancement” a, Minimal
b, Mild
c, Moderate
d, Marked M3: “abnormal enhancement” a, None
b, Focus
c, Masses M4: “shape of the mass” a, None
b, Oval (includes lobulated)
c, Round
d, Irregular M5: “margin of the mass” a, None
b, Circumscribed
c, Not circumscribed
d, Irregular
e, Speculated M6: “internal enhancement characteristics” a, None
b, Homogeneous
c, Heterogeneous
d, Rim enhancement
e, Dark internal septations M7: “non-mass enhancement” a, None
b, Focal
c, Linear
d, Segmental
e, Regional
f, Multiple regions
g, Diffuse M8: “internal enhancement patterns (for all other types)” a, None
b, Homogeneous
c, Heterogeneous
d, Clumped
e, Clustered ring M9: “non-enhancing findings” a, None
b, Ductal precontrast high signal on T1WI
c, Cyst
d, Postoperative collections (hematoma/seroma)
e, Post-therapy skin thickening and trabecular thickening
f, Non-enhancing mass
g, Architectural distortion M10: “associated features” a, Nipple retraction
b, Nipple invasion
c, Skin retraction
d, Skin thickening
e, Skin invasion
f, Axillary adenopathy
g, Pectoralis muscle invasion
h, Chest wall invasion
i, Architectural distortion M11: “fat-containing lesions” a, None
b, Fat necrosis
c, Hamartoma
d, Postoperative seroma/hematoma with fat M12: “enhancement change” a, None
b, New
c, Larger
d, Smaller in size from previous examination M13: “initial enhancement phase—describes the enhancement pattern within the first 2 minutes or when the curve starts to change” a, Slow
b, Medium
c, Fast (when scanning in the second phase after injection of contrast agent, it is regarded as “medium” if the enhanced rate is equal to 100%, “slow” if less than 100%, and “fast” if more than 100% as fast) M14: “delayed phase—describes the enhancement pattern after 2 minutes or after the curve starts to change” a, Persistent
b, Plateau
c, Washout (2 minutes after the injection of contrast agent, it is regarded as “plateau” if the curve maintains the same level to enhancement, “persistent” if the curve continues to rise, and “washout” if the curve drops) M15: “implants” No = 0
Yes = 1
Get Radiology Tree app to read full this article<
Statistical Analysis
Get Radiology Tree app to read full this article<
Get Radiology Tree app to read full this article<
Get Radiology Tree app to read full this article<
Get Radiology Tree app to read full this article<
Results
Baseline Characteristics
Get Radiology Tree app to read full this article<
TABLE 3
Baseline Characteristics of the Study Population
Variable All Patients ( N = 300) Luminal A ( N = 144) Luminal B ( N = 85) HER2 ( N = 56) Basal-like Cancer ( N = 15) Mean age ± SD (y) 46.1 ± 10.1 46.1 ± 10.1 47.8 ± 11.2 43.5 ± 7.9 45.5 ± 10.1 Family history 84 40 15 28 1 Breast feeding history 145 92 17 34 2 Reproductive history 239 122 57 50 11 History of oral contraceptive intake 79 40 16 17 6 Nipple discharge 103 67 13 20 3 Skin abnormity 45 21 12 12 0 Palpable mass 121 57 36 26 2
HER2, human epidermal growth factor 2; SD, standard deviation.
Get Radiology Tree app to read full this article<
Association of Subtype with Baseline Characteristics
Get Radiology Tree app to read full this article<
Multivariate Logistic Regression Analysis
Get Radiology Tree app to read full this article<
Get Radiology Tree app to read full this article<
Get Radiology Tree app to read full this article<
Get Radiology Tree app to read full this article<
Get Radiology Tree app to read full this article<
Get Radiology Tree app to read full this article<
TABLE 4
Summary of Variables Significantly Associated with Molecular Subtypes by Parameter Estimation
Molecular Subtypes \* B Standard Error Wald df Significance Exp (B) Exp (B) 95% Confidence Interval Upper Limit Lower Limit Luminal A Mass internal reinforced edge enhancement feature −3.753 1.832 4.195 1 0.041 0.023 0.001 0.851 Subsidiary found violations of the nipple 8.606 1.635 27.710 1 0.000 5466.147 221.831 134691.309 Subsidiary found violations of the skin 6.016 1.621 13.774 1 0.000 409.998 17.099 9830.961 Delayed phase:persistent −5.024 1.627 9.531 1 0.002 0.007 0.000 0.160 Distribution of calcification clusters 6.481 3.064 4.476 1 0.034 652.874 1.611 264604.083 Exogenous hormone therapy (degree = 1/0) 2.373 1.163 4.165 1 0.041 10.734 1.099 104.890 (Lactation history [degree = 1/0]) −4.545 1.408 10.428 1 0.001 0.011 0.001 0.168 (Oral contraceptives [degree = 1/0]) 2.549 1.085 5.517 1 0.019 12.799 1.525 107.410 Subsidiary found violations of the nipple 7.652 2.322 10.859 1 0.001 2104.690 22.216 199397.111 Luminal B Subsidiary found violations of the skin 9.868 2.242 19.374 1 0.000 19302.080 238.380 1562924.458 Delayed phase:persistent −5.499 1.648 11.133 1 0.001 0.004 0.000 0.103 Calcification distribution area −3.878 1.743 4.952 1 0.026 0.021 0.001 0.630 Exogenous hormone therapy (degree =1/0) 2.898 1.191 5.917 1 0.015 18.131 1.756 187.230 HER2 overexpressed Delayed phase:persistent −5.859 1.718 11.634 1 0.001 0.003 9.848E-5 0.083 Distribution of calcification clusters 7.628 3.148 5.874 1 0.015 2055.459 4.303 981930.182 (Lactation history [degree = 1/0]) −3.659 1.448 6.384 1 0.012 0.026 0.002 0.440
HER2, human epidermal growth factor 2.
Get Radiology Tree app to read full this article<
Get Radiology Tree app to read full this article<
Get Radiology Tree app to read full this article<
Get Radiology Tree app to read full this article<
Get Radiology Tree app to read full this article<
Association of Subtype with Mammography Features
Get Radiology Tree app to read full this article<
Get Radiology Tree app to read full this article<
Discussion
Get Radiology Tree app to read full this article<
Get Radiology Tree app to read full this article<
Get Radiology Tree app to read full this article<
Get Radiology Tree app to read full this article<
Get Radiology Tree app to read full this article<
Acknowledgment
Get Radiology Tree app to read full this article<
References
1. Siegel R.L., Miller K.D., Jemal A.: Cancer statistics. CA Cancer J Clin 2015; 65: pp. 5-29.
2. Toss A., Cristofanilli M.: Molecular characterization and targeted therapeutic approaches in breast cancer. Breast Cancer Res 2015; 17: pp. 60.
3. Cancer Genome Atlas Network : Comprehensive molecular portraits of human breast tumours. Nature 2012; 490: pp. 61-70.
4. Perou C.M., Sorlie T., Eisen M.B., et. al.: Molecular portraits of human breast tumours. Nature 2000; 406: pp. 747-752.
5. Huber K.E., Carey L.A., Wazer D.E.: Breast cancer molecular subtypes in patients with locally advanced disease: impact on prognosis, patterns of recurrence, and response to therapy. Semin Radiat Oncol 2009; 19: pp. 204-210.
6. Bhooshan N., Giger M.L., Jansen S.A., et. al.: Cancerous breast lesions on dynamic contrast-enhanced MR images: computerized characterization for image-based prognostic markers. Radiology 2010; 254: pp. 680-690.
7. Agner S.C., Rosen M.A., Englander S., et. al.: Computerized image analysis for identifying triple-negative breast cancers and differentiating them from other molecular subtypes of breast cancer on dynamic contrast-enhanced MR images: a feasibility study. Radiology 2014; 272: pp. 91-99.
8. Bae M.S., Seo M., Kim K.G., et. al.: Quantitative MRI morphology of invasive breast cancer: correlation with immunohistochemical biomarkers and subtypes. Acta Radiol 2015; 56: pp. 269-275.
9. Bitencourt A.G., Pereira N.P., Franca L.K., et. al.: Role of MRI in the staging of breast cancer patients: does histological type and molecular subtype matter?. Br J Radiol 2015; 88: pp. 20150458.
10. Chiacchio S., Evangelista L., AlSharif A., et. al.: Association between semiquantitative Pet parameters and molecular subtypes of breast invasive ductal carcinoma. Q J Nucl Med Mol Imaging 2015; [Epub ahead of print] PMID: 26329496
11. Yamamoto S., Maki D.D., Korn R.L., et. al.: Radiogenomic analysis of breast cancer using MRI: a preliminary study to define the landscape. AJR Am J Roentgenol 2012; 199: pp. 654-663.
12. Ha R., Jin B., Mango V., et. al.: Breast cancer molecular subtype as a predictor of the utility of preoperative MRI. AJR Am J Roentgenol 2015; 204: pp. 1354-1360.
13. Sutton E.J., Dashevsky B.Z., Oh J.H., et. al.: Breast cancer molecular subtype classifier that incorporates MRI features. J Magn Reson Imaging 2016; 44: pp. 122-129.
14. Chen W., Giger M.L., Lan L., et. al.: Computerized interpretation of breast MRI: investigation of enhancement-variance dynamics. Med Phys 2004; 31: pp. 1076-1082.
15. Grimm L.J., Zhang J., Mazurowski M.A.: Computational approach to radiogenomics of breast cancer: Luminal A and luminal B molecular subtypes are associated with imaging features on routine breast MRI extracted using computer vision algorithms. J Magn Reson Imaging 2015; 42: pp. 902-907.
16. Mazurowski M.A., Zhang J., Grimm L.J., et. al.: Radiogenomic analysis of breast cancer: luminal B molecular subtype is associated with enhancement dynamics at MR imaging. Radiology 2014; 273: pp. 365-372.
17. Austin S.B., Pazaris M.J., Rosner B., et. al.: Application of the Rosner-Colditz risk prediction model to estimate sexual orientation group disparities in breast cancer risk in a U.S. cohort of premenopausal women. Cancer Epidemiol Biomarkers Prev 2012; 21: pp. 2201-2208.
18. Armstrong K., Handorf E.A., Chen J., et. al.: Breast cancer risk prediction and mammography biopsy decisions: a model-based study. Am J Prev Med 2013; 44: pp. 15-22.
19. Timmers J.M., Verbeek A.L., IntHout J., et. al.: Breast cancer risk prediction model: a nomogram based on common mammographic screening findings. Eur Radiol 2013; 23: pp. 2413-2419.
20. Boggs D.A., Rosenberg L., Adams-Campbell L.L., et. al.: Prospective approach to breast cancer risk prediction in African American women: the black women’s health study model. J Clin Oncol 2015; 33: pp. 1038-1044.
21. MacInnis R.J., Bickerstaffe A., Apicella C., et. al.: Prospective validation of the breast cancer risk prediction model BOADICEA and a batch-mode version BOADICEACentre. Br J Cancer 2013; 109: pp. 1296-1301.
22. Anothaisintawee T., Teerawattananon Y., Wiratkapun C., et. al.: Risk prediction models of breast cancer: a systematic review of model performances. Breast Cancer Res Treat 2012; 133: pp. 1-10.