
Rationale and Objectives
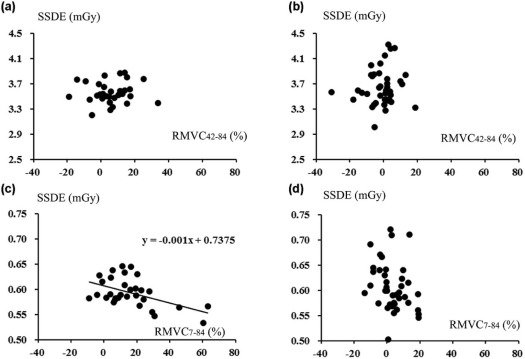
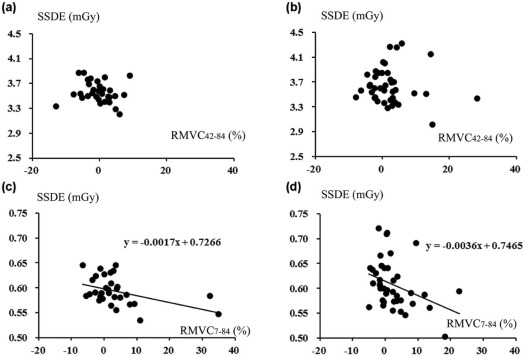
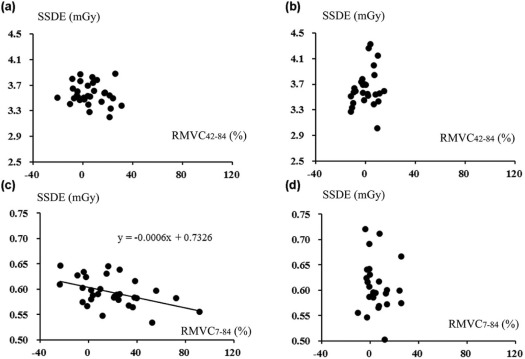
The objectives of this study were to compare the visibility and quantification of subsolid nodules (SSNs) on computed tomography (CT) using adaptive iterative dose reduction using three-dimensional processing between 7 and 42 mAs and to assess the association of size-specific dose estimate (SSDE) with relative measured value change between 7 and 84 mAs (RMVC 7–84 ) and relative measured value change between 42 and 84 mAs (RMVC 42–84 ).
Materials and Methods
As a Japanese multicenter research project (Area-detector Computed Tomography for the Investigation of Thoracic Diseases [ACTIve] study), 50 subjects underwent chest CT with 120 kV, 0.35 second per location and three tube currents: 240 mA (84 mAs), 120 mA (42 mAs), and 20 mA (7 mAs). Axial CT images were reconstructed using adaptive iterative dose reduction using three-dimensional processing. SSN visibility was assessed with three grades (1, obscure, to 3, definitely visible) using CT at 84 mAs as reference standard and compared between 7 and 42 mAs using t test. Dimension, mean CT density, and particular SSDE to the nodular center of 71 SSNs and volume of 58 SSNs (diameter >5 mm) were measured. Measured values (MVs) were compared using Wilcoxon signed-rank tests among CTs at three doses. Pearson correlation analyses were performed to assess the association of SSDE with RMVC 7–84 : 100 × (MV at 7 mAs − MV at 84 mAs)/MV at 84 mAs and RMVC 42–84 .
Results
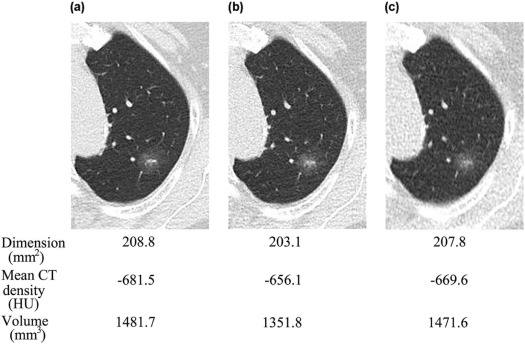
SSN visibilities were similar between 7 and 42 mAs (2.76 ± 0.45 vs 2.78 ± 0.40) ( P = .67). For larger SSNs (>8 mm), MVs were similar among CTs at three doses ( P > .05). For smaller SSNs (<8 mm), dimensions and volumes on CT at 7 mAs were larger and the mean CT density was smaller than 42 and 84 mAs, and SSDE had mild negative correlations with RMVC 7–84 ( P < .05).
Conclusions
Comparable quantification was demonstrated irrespective of doses for larger SSNs. For smaller SSNs, nodular exaggerating effect associated with decreased SSDE on CT at 7 mAs compared to 84 mAs could result in comparable visibilities to CT at 42 mAs.
Introduction
Persistent subsolid nodules (SSNs) are often an early sign of lung cancer , and pure ground-glass nodules should be followed up at 6–12 months to confirm their persistence and every 2 years until 5 years; part-solid nodules should be followed up at 3–6 months to confirm their persistence and annually for 5 years, if unchanged and solid component size remain less than 6 mm by chest computed tomography (CT) from their initial detections in cases with a diameter of 6 mm or more according to the latest management guidelines by the Fleischner Society . Dependable quantitative assessment of changes in SSN volume or density on CT images supports the feasibility of subjective visual inspection of changes in SSN size, which is typically applicable in routine clinical settings, and could be useful to determine an appropriate choice of treatment . The accuracy of the volume measurement of lung nodules, including SSNs, is influenced by some mutually related factors, such as characteristics of the nodular margin, algorithm of the measurement tool, data acquisition, and reconstruction parameters . Among these factors, radiation dose has a considerable effect on SSN quantification and should be as low as possible for CT to be applicable as the follow-up tool in terms of the exaggerating influence of radiation dose on carcinogenesis probability .
In combination with an iterative reconstruction (IR) algorithm, ultra–low-dose CT (0.16–0.29 mSv) has recently demonstrated comparable detection performance of lung nodules to low-dose computed tomography (LDCT) (0.92–1.74 mSv) regardless of the different IR techniques developed by different manufacturers . Furthermore, in addition to lung nodule detectability, simulated SSNs placed in an anthropomorphic phantom have been shown to be measured on ultra–low-dose CT images obtained with an IR algorithm as reliably as on LDCT images obtained with an IR algorithm despite the different acquisition and reconstruction techniques . However, simulated nodules in an anthropomorphic phantom lack the diversity and complexity of clinical nodules and background lung fields modified by dependent effects and respiratory levels. In contrast, the size-specific dose estimate (SSDE) corresponding to an individual image plane has been recently introduced as one of the more practicable dose adjustments on body cross sections , and SSDEs in the transaxial plane, including SSNs, can vary among nodular locations even in an individual patient and have an association with SSN detection performance.
Get Radiology Tree app to read full this article<
Materials and Methods
Get Radiology Tree app to read full this article<
Patients’ Populations
Get Radiology Tree app to read full this article<
Image Data Acquisition and Reconstruction
Get Radiology Tree app to read full this article<
Get Radiology Tree app to read full this article<
Get Radiology Tree app to read full this article<
Get Radiology Tree app to read full this article<
Subsolid Nodule Visibility Evaluation
Get Radiology Tree app to read full this article<
Measurement of the Dimension, Density, and Volume of Subsolid Nodules
Get Radiology Tree app to read full this article<
Get Radiology Tree app to read full this article<
Get Radiology Tree app to read full this article<
Association of SSDE with Relative Measured Value Change and Image Noise
Get Radiology Tree app to read full this article<
Get Radiology Tree app to read full this article<
Statistical Analyses
Get Radiology Tree app to read full this article<
Get Radiology Tree app to read full this article<
Get Radiology Tree app to read full this article<
Results
Radiation Dose and Total Lung Volume Measurement
Get Radiology Tree app to read full this article<
Get Radiology Tree app to read full this article<
Get Radiology Tree app to read full this article<
Subsolid Nodule Visibility
Get Radiology Tree app to read full this article<
TABLE 1
Comparison in SSN Visibility Between 42 and 7 mAs with Reference to 84 mAs
Number 42 mAs 7 mAs_P_ Value Total SSNs (5 mm ≤ LD) 71 2.78 ± 0.40 2.66 ± 0.45 .658 Smaller SSNs (5 mm ≤ LD ≤ 8 mm) 31 2.66 ± 0.45 2.67 ± 0.48 .856 Larger SSNs (8 mm ≤ LD) 40 2.88 ± 0.33 2.83 ± 0.41 .323
LD, longest diameter; SSN, subsolid nodule.
Get Radiology Tree app to read full this article<
Measurement of the Dimension, Density, and Volume of Subsolid Nodules
Get Radiology Tree app to read full this article<
TABLE 2
Bland-Altman Plots for Interobserver Variation in the Measured Values for SSN Dimension, Mean Density, and Volume
SSN Dimension (mm 2 ) Difference in the Measured Value Slope of the Regression Line with the Mean Value Distribution Mean 95% Level of Confidence LOA_r_ Value_P_ Value 84 mAs 3.5 −50.4 to 57.3 −39.1 to 55.4 0.049 .682 42 mAs 3.4 −57.3 to 64.1 −44.6 to 62.1 0.084 .485 7 mAs 3.3 −62.6 to 69.2 −48.7 to 67.2 0.132 .272
SSN Volume (mm 3 ) Difference in the Measured Value Slope of the Regression Line with the Mean Value Distribution Mean 95% Level of Confidence LOA_r_ Value_P_ Value 84 mAs 12.2 −252.8 to 277.3 −191.3 to 270.3 0.079 .510 42 mAs 17.0 −289.9 to 323.8 −218.7 to 314.6 0.021 .860 7 mAs 9.2 −308.6 to 327.0 −234.8 to 321.3 0.207 .084
SSN Mean CT Density (HU) Difference in the Measured Value Slope of the Regression Line with the Mean Value Distribution Mean 95% Level of Confidence MDC_r_ Value_P_ Value 84 mAs −1.1 −67.6 to 65.3 66.5 0.023 .667 42 mAs 0.9 −69.1 to 71.1 70.1 −0.246 .063 7 mAs 1.3 −71.7 to 74.3 73.0 −0.036 .788
CT, computed tomography; LOA, limit of agreement; MDC, minimal detectable change; SSN, subsolid nodule.
Get Radiology Tree app to read full this article<
Get Radiology Tree app to read full this article<
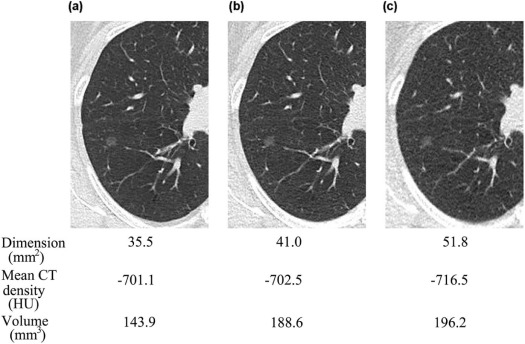
TABLE 3
Comparison of SSN Dimensions Among 84, 42, and 7 mAs
Number 84 mAs (mm 2 ) 42 mAs (mm 2 ) 7 mAs (mm 2 )P Value Total SSNs (5 mm ≤ LD) 71 80.3 ± 67.5 80.3 ± 67.5 84.7 ± 68.8 .001 \* Smaller SSNs (5 mm ≤ LD ≤ 8 mm) 31 31.9 ± 8.6 33.9 ± 10.1 37.0 ± 10.8 <.001 † Larger SSNs (8 mm ≤ LD) 40 117.7 ± 69.6 116.4 ± 68.9 121.8 ± 72.0 .088
LD, longest diameter; SSN, subsolid nodule.
Get Radiology Tree app to read full this article<
Get Radiology Tree app to read full this article<
Get Radiology Tree app to read full this article<
Get Radiology Tree app to read full this article<
Get Radiology Tree app to read full this article<
Get Radiology Tree app to read full this article<
TABLE 4
Comparison of SSN Mean Densities Among 84, 42, and 7 mAs
Number 84 mAs (HU) 42 mAs (HU) 7 mAs (HU)P Value Total SSNs (5 mm ≤ LD) 71 −613.2 ± 117.1 −618.1 ± 115.7 −626.8 ± 107.3 .089 Smaller SSNs (5 mm ≤ LD ≤ 8 mm) 31 −635.6 ± 115.7 −634.2 ± 123.2 −651.8 ± 101.6 .050 \* Larger SSNs (8 mm ≤ LD) 40 −595.9 ± 116.7 −605.7 ± 108.2 −607.4 ± 108.9 .294
LD, longest diameter; SSN, subsolid nodule.
Get Radiology Tree app to read full this article<
Get Radiology Tree app to read full this article<
Get Radiology Tree app to read full this article<
TABLE 5
Comparison in SSN Volumes Among 84, 42, and 7 mAs
Number 84 mAs (mm 3 ) 42 mAs (mm 3 ) 7 mAs (mm 3 )P Value Total SSNs (5 mm ≤ LD) 58 536.0 ± 672.6 530.6 ± 628.8 565.9 ± 676.1 .001 \* Smaller SSNs (5 mm ≤ LD ≤ 8 mm) 31 139.3 ± 67.4 146.6 ± 70.0 164.0 ± 80.7 <.001 † Larger SSNs (8 mm ≤ LD) 27 991.5 ± 763.9 971.5 ± 695.3 1027.2 ± 762.3 .097
LD, longest diameter; SSN, subsolid nodule.
Get Radiology Tree app to read full this article<
Get Radiology Tree app to read full this article<
Get Radiology Tree app to read full this article<
Association of SSDE with Relative Measured Value Change and Image Noise
Get Radiology Tree app to read full this article<
Get Radiology Tree app to read full this article<
Get Radiology Tree app to read full this article<
Get Radiology Tree app to read full this article<
Get Radiology Tree app to read full this article<
Get Radiology Tree app to read full this article<
Get Radiology Tree app to read full this article<
Discussion
Get Radiology Tree app to read full this article<
Get Radiology Tree app to read full this article<
Get Radiology Tree app to read full this article<
Get Radiology Tree app to read full this article<
Get Radiology Tree app to read full this article<
Get Radiology Tree app to read full this article<
Get Radiology Tree app to read full this article<
Get Radiology Tree app to read full this article<
The Extent of Patients’ Overlap Between This Study and Our Previous Ones
Get Radiology Tree app to read full this article<
Get Radiology Tree app to read full this article<
Get Radiology Tree app to read full this article<
The ACTIve Study Group
Get Radiology Tree app to read full this article<
Get Radiology Tree app to read full this article<
References
1. Sone S., Kasuga T., Sakai F., et. al.: Development of a high resolution digital tomosynthesis system and its clinical application. Radiographics 1991; 11: pp. 807-881.
2. MacMahon H., Naidich D.P., Goo J.M., et. al.: Guidelines for management of incidental pulmonary nodules detected on CT images: from the Fleischner Society 2017. Radiology 2017; 284: pp. 228-243.
3. Takahashi M., Shigamatsu Y., Ohta M., et. al.: Tumor invasiveness as defined by the newly proposed JASLC/ATS/ERS classification has prognostic significance for pathologic stage IA lung adenocarcinoma and can be predicted by radiologic parameters. J Thorac Cardiovasc Surg 2014; 147: pp. 54-59.
4. Gavrielides M.A., Kinnard L.M., Myers K.J., et. al.: Non-calcified lung nodules: volumetric assessment with thoracic CT. Radiology 2009; 251: pp. 26-37.
5. Christe A., Brönnimann A., Vock P.: Volumetric analysis of lung nodules in computed tomography (CT): comparison of two different segmentation algorithm softwares and two different reconstruction filters on automated volume calculation. Acta Radiol 2014; 55: pp. 54-61.
6. Wender R., Fontham E.T., Barrera E., et. al.: American Cancer Society lung cancer screening guidelines. CA Cancer J Clin 2013; 63: pp. 107-117. Early view, article first published online
7. Brenner D.J.: Radiation risks potentially associated with low-dose CT screening of adult smokers for lung cancer. Radiology 2004; 231: pp. 440-445.
8. Neroladaki A., Botsikas D., Boudabbous S., et. al.: Computed tomography of the chest with model-based iterative reconstruction using a radiation exposure similar to chest X-ray examination: preliminary observations. Eur Radiol 2013; 23: pp. 360-366.
9. Nagatani Y., Takahashi M., Murata K., et. al.: Lung nodule detection performance in five observers on computed tomography (CT) with adaptive iterative dose reduction using three-dimensional processing (AIDR 3D) in a Japanese multicenter study: comparison between ultra-low-dose CT and low-dose CT by receiver-operating characteristics analysis. Eur J Radiol 2015; 84: pp. 1401-1412.
10. Katsura M., Matsuda I., Akahane M., et. al.: Model-based iterative reconstruction technique for ultralow-dose chest CT: comparison of pulmonary nodule detectability with the adaptive statistical iterative reconstruction technique. Invest Radiol 2013; 48: pp. 206-212.
11. Yoon H.J., Chung M.J., Hwang H.S., et. al.: Adaptive statistical iterative reconstruction-applied ultra-low-dose CT with radiography-comparable radiation dose: usefulness for lung nodule detection. Korean J Radiol 2015; 16: pp. 1132-1141.
12. Shrimpton P.C., Hillier M.C., Lewis M.A., et. al.: National survey of doses from CT in the UK: 2003. Br J Radiol 2006; 79: pp. 968-980.
13. Kim H., Park C.M., Song Y.S., et. al.: Influence of radiation dose and iterative reconstruction algorithms for measurement accuracy and reproducibility of pulmonary nodule volumetry: a phantom study. Eur J Radiol 2014; 83: pp. 848-857.
14. Leng S., Shiung M., Duan X., et. al.: Size-specific dose estimates for chest, abdominal, and pelvic CT: effect of intrapatient variability in water-equivalent diameter. Radiology 2015; 276: pp. 184-190.
15. Christner J.A., Braun N.N., Jacobsen M.C., et. al.: Size-specific dose estimates for adult patients at CT of the torso. Radiology 2012; 265: pp. 841-847.
16. Moore B.M., Brady S.L., Mirro A.E., et. al.: Size-specific dose estimate (SSDE) provides a simple method to calculate organ dose for pediatric CT examinations. Med Phys 2014; 41: pp. 071917.
17. Nagatani Y., Takahashi M., Ikeda M., et. al.: Sub-solid nodule detection performance on reduced dose computed tomography with iterative reduction: comparison between 20 mA (7 mAs) and 120 mA (42 mAs) regarding nodular size and characteristics and association with size specific dose estimate. Acad Radiol 2017; 24: pp. 995-1007.
18. Juri H., Matsuki M., Itou Y., et. al.: Initial experience with adaptive iterative dose reduction 3D to reduce radiation dose in computed tomographic urography. J Comput Assist Tomogr 2013; 37: pp. 52-57.
19. Funabashi N., Irie R., Aiba M., et. al.: Adaptive-iterative-dose-reduction 3D with multisector-reconstruction method in 320-slice CT may maintain accurate-measurement of the Agatston-calcium-score of severe-calcification even at higher pulsating-beats and low tube-current in vitro. Int J Cardiol 2013; 168: pp. 601-603.
20. Ohno Y., Yaguchi A., Okazaki T., et. al.: Comparative evaluation of newly developed model-based and commercially available hybrid-type iterative reconstruction methods and filter back projection method in terms of accuracy of computer-aided volumetry (CADv) for low-dose CT protocols in phantom study. Eur J Radiol 2016; 85: pp. 1375-1382.
21. McCollough C., Bakalyar D.M., Bostani M., et. al.: Use of water equivalent diameter for calculating patient size and size-specific dose estimates (SSDE) in CT. AAPM Rep 2014; 2014: pp. 6-23. The Report of AAPM Task Group 220
22. Bland J.M., Altman D.G.: Statistical methods for assessing agreement between two methods of clinical measurement. Lancet 1986; 1: pp. 307-310.
23. Kobayashi Y., Sakao Y., Desphande G.A., et. al.: The association between baseline clinical–radiological characteristics and growth of pulmonary nodules with ground-glass opacity. Lung Cancer 2014; 83: pp. 61-66.
24. Karla M.K., Maher M.M., Toth T.L., et. al.: Strategies for CT radiation dose optimization. Radiology 2004; 230: pp. 619-628.
25. Karla M., Rizzo S.M., Novelline R.A.: Reducing radiation dose in emergency computed tomography with automatic exposure control techniques. Emerg Radiol 2005; 11: pp. 267-274.
26. Hein P.A., Romano V.C., Rogalla P., et. al.: Variability of semiautomated lung nodule volumetry on ultralow-dose CT: comparison with nodule volumetry on standard-dose CT. J Digit Imaging 2010; 23: pp. 8-17.
27. Willemink M.J., Leiner T., Budde R.P., et. al.: Systematic error in lung nodule volumetry: effect of iterative reconstruction versus filtered back projection at different CT parameters. AJR Am J Roentgenol 2012; 199: pp. 1241-1246.