
Rationale and Objectives
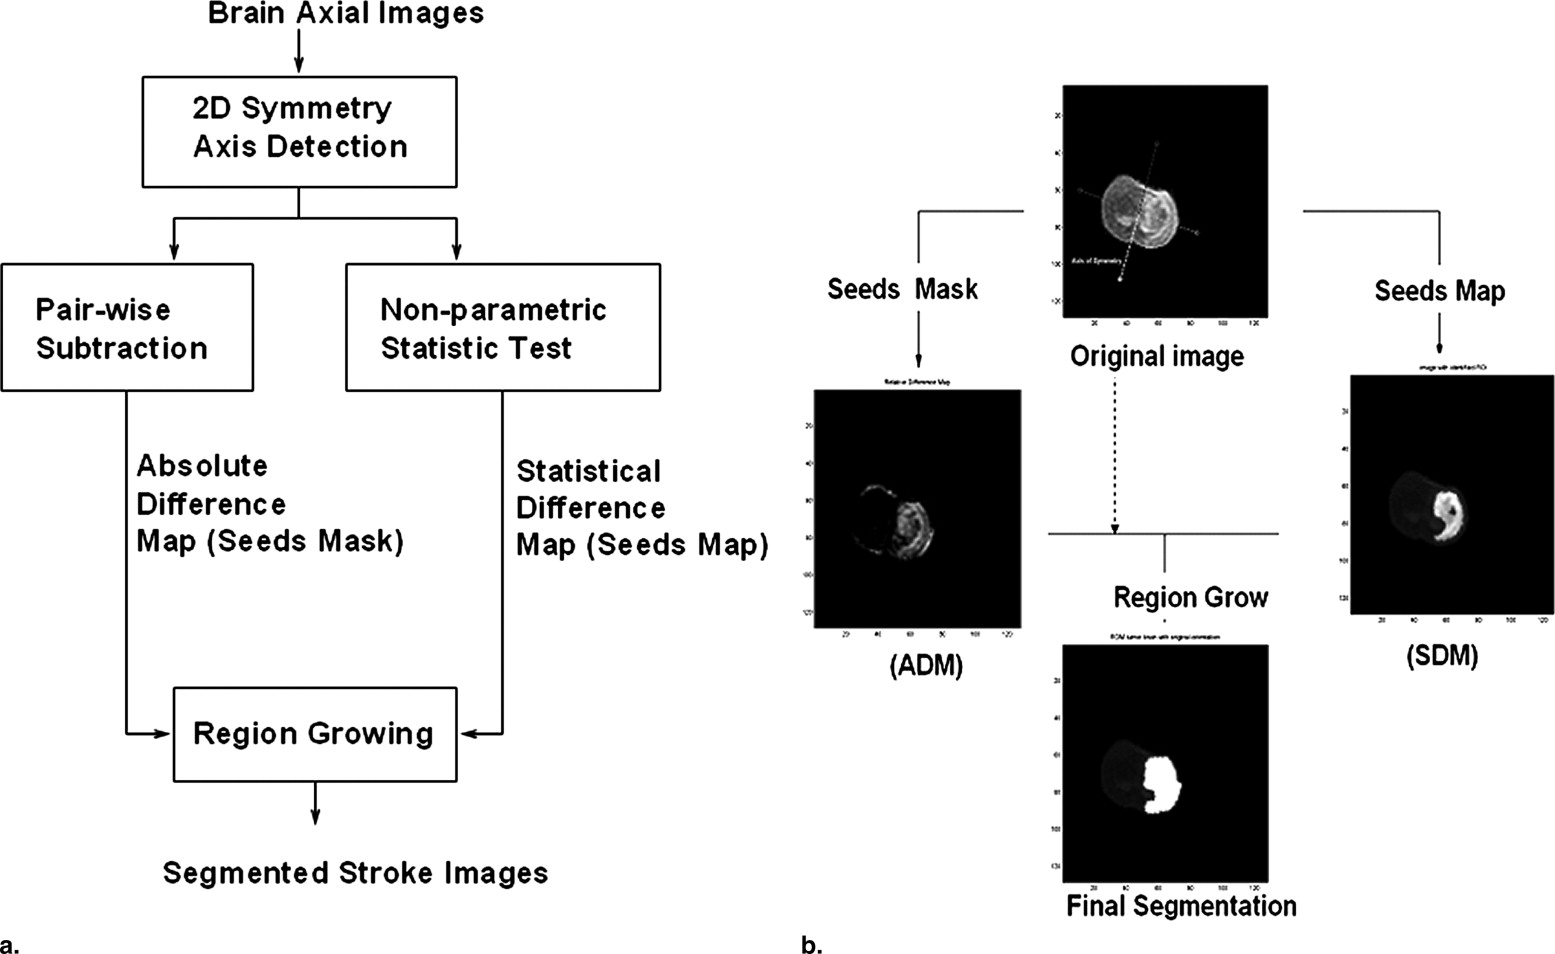
An automated method for identification and segmentation of acute/subacute ischemic stroke, using the inherent bi-fold symmetry in brain images, is presented. An accurate and automated method for localization of acute ischemic stroke could provide physicians with a mechanism for early detection and potentially faster delivery of effective stroke therapy.
Materials and Methods
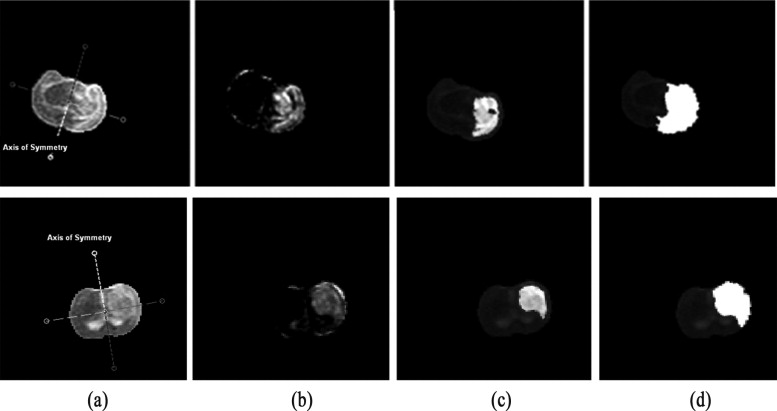
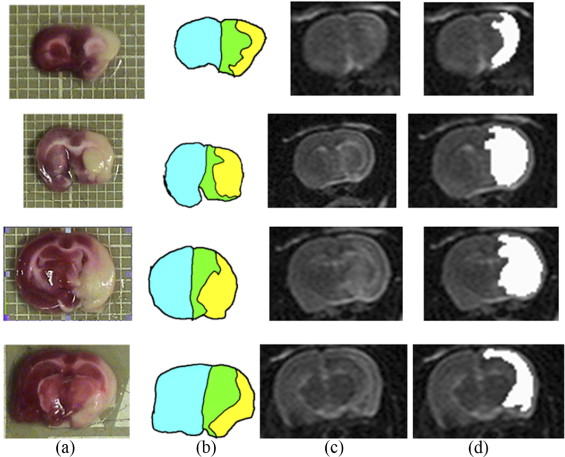
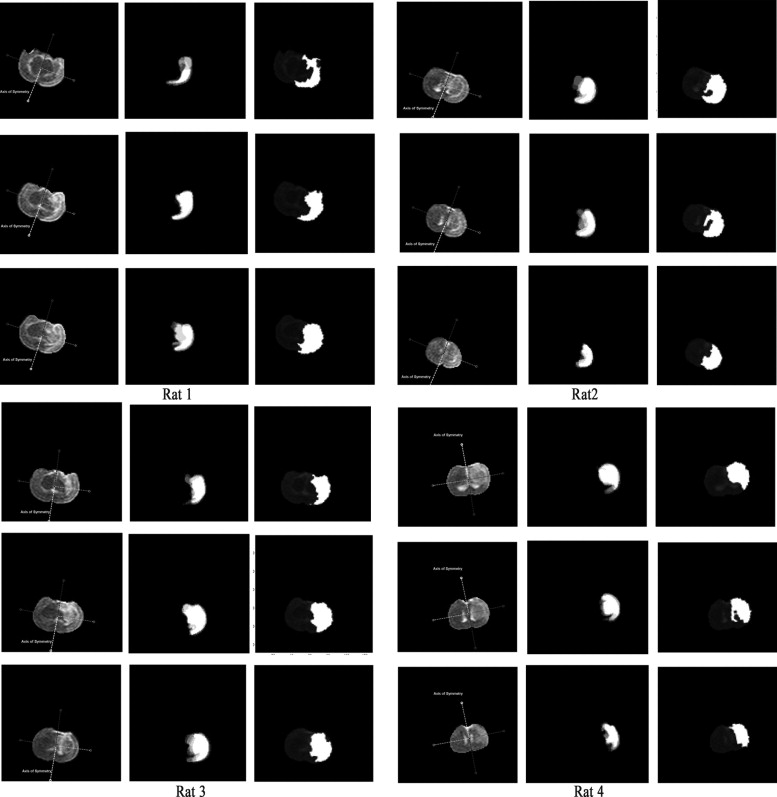
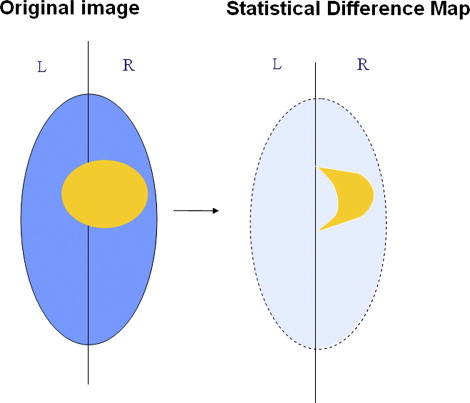
Segmentation of ischemic stroke was performed on magnetic resonance (MR) images of subacute rodent cerebral ischemia. Eight adult male Wistar rats weighing 225–300 g were anesthetized with halothane in a mix of 70% nitrous oxide/30% oxygen. Animal core temperature was maintained at 37°C during the entire surgical procedure, including occlusion of the middle cerebral artery (MCA) and the 90-minute post-reperfusion period. To confirm cerebral ischemia, transcranial measurements of cerebral blood flow were performed with laser-Doppler flowmetry, using 15-mm flexible fiberoptic Doppler probes attached to the skull over the MCA territory. Animal MR scans were performed at 1.5 T using a knee coil. Three experts performed manual tracing of the stroke regions for each rat, using the histologic-stained slices to guide delineation of stroke regions. A strict tracing protocol was followed that included multiple (three) tracings of each stroke region. The volumetric MR image data were processed for each rat by computing the axis of symmetry and extracting statistical dissimilarities. A nonparametric Wilcoxon rank sum test operating on paired windows in opposing hemispheres identified seeds in the pixels exhibiting statistically significant bi-fold mirror asymmetry. Two brain reference maps were used for analysis: an absolute difference map (ADM) and a statistical difference map (SDM). Although an ADM simply displays the absolute difference by subtracting one brain hemisphere from its reflection, SDM highlights regions by labeling pixels exhibiting statistically significant asymmetry.
Results
To assess the accuracy of the proposed segmentation method, the surrogate ground truth (the stroke tracing data) was compared to the results of our proposed automated segmentation algorithm. Three accuracy segmentation metrics were utilized: true-positive volume fraction (TPVF), false-positive volume fraction (FPVF), and false-negative volume fraction (FNVF). The mean value of the TPVF for our segmentation method was 0.8877; 95% CI 0.7254 to 1.0500; the mean FPVF was 0.3370, 95% CI –0.0893 to 0.7633; the mean FNVF was 0.1122, 95% CI –0.0502 to 0.2747.
Conclusions
Unlike most segmentation methods that require some degree of manual intervention, our segmentation algorithm is fully automated and highly accurate in identifying regions of brain asymmetry. This approach is attractive for numerous neurologic applications where the operator’s intervention should be minimal or null.
Stroke is the third leading cause of death in the United States, resulting in approximately 150,000 deaths per year ( ). Building a computer-aided diagnostic tool that detects the presence or absence of an acute/subacute ischemic infarct could improve patient outcomes through earlier detection. An accurate, automated, and efficient method that identifies acute/subacute brain ischemia with magnetic resonance (MR) imaging could provide physicians with an additional tool for delivering fast and effective stroke therapy.
Automated detection and segmentation of brain abnormalities spans several decades of research ( ). To facilitate fully automated segmentation, it is known that image information alone is insufficient to successfully differentiate among target organs, abnormal tissue, and the background ( ). For example, the active contour classification ( ) and simple fuzzy connectedness ( ) methods require manual selection of seeds to initialize the segmentation process. Some existing fully automated methods experience other shortcomings. For example, statistical classification methods ( ) may fail when a brain lesion shows insufficient contrast against its background or presents highly inhomogeneous patterns. Inhomogeneity results in overlapping intensity distributions between healthy tissue and abnormal tissue.
Get Radiology Tree app to read full this article<
Get Radiology Tree app to read full this article<
Get Radiology Tree app to read full this article<
Get Radiology Tree app to read full this article<
Get Radiology Tree app to read full this article<
Materials and methods
Get Radiology Tree app to read full this article<
Approach Overview
Get Radiology Tree app to read full this article<
Get Radiology Tree app to read full this article<
Get Radiology Tree app to read full this article<
Detection of the Symmetry Axis for each Individual Scan
Get Radiology Tree app to read full this article<
Get Radiology Tree app to read full this article<
XR(x,y)={10if(x,y)∈R:I(x,y)>δotherwise. X
R
(
x
,
y
)
=
{
1
i
f
(
x
,
y
)
∈
R
:
I
(
x
,
y
)
δ
0
otherwise
.
Get Radiology Tree app to read full this article<
Get Radiology Tree app to read full this article<
Get Radiology Tree app to read full this article<
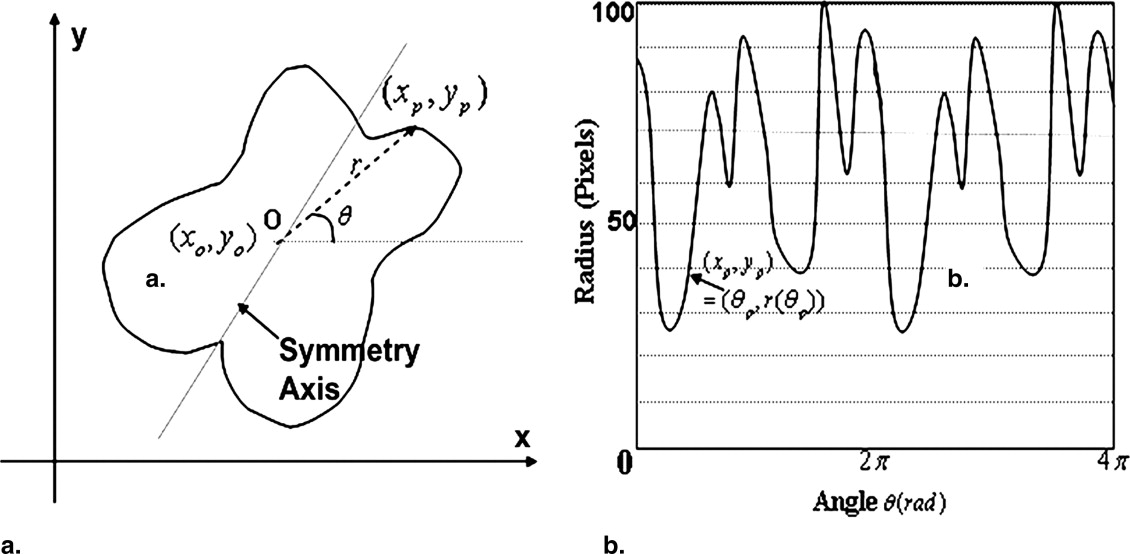
d(R0,L0)=∫π=0|r(φ+)−r(φ−)|d d
(
R
0
,
L
0
)
=
∫
=
0
π
|
r
(
φ
+
)
−
r
(
φ
−
)
|
d
with the symmetry axis being φτ=argmind(R0,L0) φ
τ
=
arg
min
d
(
R
0
,
L
0
) .
Get Radiology Tree app to read full this article<
Get Radiology Tree app to read full this article<
Generation of the SDM and ADM
Get Radiology Tree app to read full this article<
Get Radiology Tree app to read full this article<
The Statistical Difference Map
Get Radiology Tree app to read full this article<
Get Radiology Tree app to read full this article<
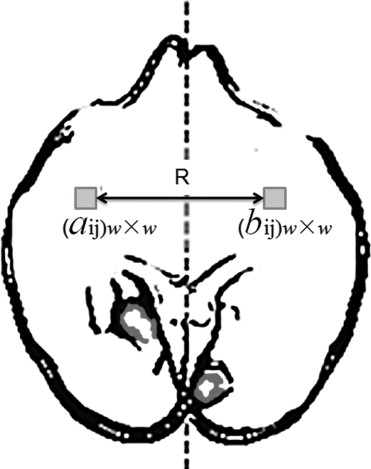
SN:X(rx,cy)={X(rx,cy):(rx+Δr,cy+Δc),×(Δr,Δc)∈N}. S
N
:
X
(
r
x
,
c
y
)
=
{
X
(
r
x
,
c
y
)
:
(
r
x
+
Δ
r
,
c
y
+
Δ
c
)
,
×
(
Δ
r
,
Δ
c
)
∈
N
}.
Get Radiology Tree app to read full this article<
Get Radiology Tree app to read full this article<
[h(rx,cy),p(rx,cy)]=k({SN:XL(rx,cy),SN:XR(rx,cy),α}). [
h
(
r
x
,
c
y
)
,
p
(
r
x
,
c
y
)
]
=
k
(
{
S
N
:
X
L
(
r
x
,
c
y
)
,
S
N
:
X
R
(
r
x
,
c
y
)
,
α
}
).
Get Radiology Tree app to read full this article<
Get Radiology Tree app to read full this article<
Xα(rx,cy)={1,∀(rx,cy):h(rx,cy)=1givenα0,otherwise. X
α
(
r
x
,
c
y
)
=
{
1
,
∀
(
r
x
,
c
y
)
:
h
(
r
x
,
c
y
)
=
1
g
i
v
e
n
α
0
,
o
t
h
e
r
w
i
s
e
.
If there is a significant normal variation between hemispheres, it is highly likely that the method will capture both pathologic abnormalities and artifacts coming from normal asymmetries. The presence of normal and pathologic asymmetries makes it essential to introduce an additional threshold that will allow for differentiation between these two types of asymmetries.
Get Radiology Tree app to read full this article<
Get Radiology Tree app to read full this article<
Xα(rx,cy)=0,ifXα(rx,cy)=1∩X(rx,cy)<ε X
α
(
r
x
,
c
y
)
=
0
,
i
f
X
α
(
r
x
,
c
y
)
=
1
∩
X
(
r
x
,
c
y
)
<
ε
Get Radiology Tree app to read full this article<
Get Radiology Tree app to read full this article<
SDM(rx,cy)={Xα(rx,cy),ISN:X(r,c)>ISN:Xopp(r,c)0otherwise}. S
D
M
(
r
x
,
c
y
)
=
{
X
α
(
r
x
,
c
y
)
,
I
S
N
:
X
(
r
,
c
)
I
S
N
:
X
o
p
p
(
r
,
c
)
0
o
t
h
e
r
w
i
s
e
}
.
Get Radiology Tree app to read full this article<
The ADM
Get Radiology Tree app to read full this article<
ADM(rx,cy)=[∥XL−XR∥,f(∥XL−XR∥)]. A
D
M
(
r
x
,
c
y
)
=
[
∥
X
L
−
X
R
∥
,
f
(
∥
X
L
−
X
R
∥
)
].
Get Radiology Tree app to read full this article<
Get Radiology Tree app to read full this article<
Region growing within the difference map
Get Radiology Tree app to read full this article<
Get Radiology Tree app to read full this article<
Get Radiology Tree app to read full this article<
Results
Get Radiology Tree app to read full this article<
Development of Expert-based Ground Truth
Get Radiology Tree app to read full this article<
SD=1n−1∑ni=1(Si−S0)−−−−−−−−−−−−−−−√ S
D
=
1
n
−
1
∑
i
=
1
n
(
S
i
−
S
0
)
therefore, the CV, CV = SD/S__0 , where S__0 is the mean area of n trials and CV is coefficient of variation.
Get Radiology Tree app to read full this article<
Get Radiology Tree app to read full this article<
Table 1
The Intra- and Interoperator Variabilities Between the Hand-segmented Delineations of the Stroke Region Affects the Reliability of the Resulting Surrogate Ground Truth
Intra- and Interoperator Variabilities for One Rat Scan Operator 1 Operator 2 Operator 3 Segmentation Trial 1 Trial 2 Trial 3 Trial 1 Trial 2 Trial 3 Trial 1 Trial 2 Trial 3 Ground truth area (pixel) 476.3 Segmented area (pixel) 534 475 514 577 666 459 419 390 396 Area of difference 12.1% 0.29% 7.91% 21.13% 39.8% 6.39% 12.0% 18.1% 16.8% TPVF 0.935 0.899 0.933 0.954 1 0.872 0.838 0.798 0.779 Intra CV 6.30% 21.80% 3.21% Inter CV 19.08%
CV: coefficient of variation; TPVF: true-positive volume fraction.
The accuracy assessment of the automated segmentations is affected. The “experts” used in this project were trained medical students who have showed noticeable intra- and interoperator discrepancies quantified by CV. For a given rat scan, operator 1 has shown 6.30% intraoperator variability; this value is 21.80% and 3.21% for operator 2 and 3, respectively. The interoperator variability is 19.08%.
Table 2
Intra- and Interoperator Variabilities for 12 Scans
Slice 10 Slice 11 Slice 12 Intraoperator Interoperator Intraoperator Interoperator Intraoperator Interoperator Exp_A Exp_B Exp_C Exp_A Exp_B Exp_C Exp_A Exp_B Exp_C Rat 1 43.96% 42.80% 20.45% 37.98% 9.10% 17.07% 13.44% 13.98% 12.15% 20.00% 11.20% 16.51% Rat 2 8.38% 14.81% 22.77% 19.92% 9.92% 15.30% 12.19% 12.67% 18.07% 18.07% 16.39% 15.18% Rat 3 22.44% 12.03% 17.18% 19.67% 6.12% 11.65% 2.79% 9.38% 10.21% 9.01% 19.25% 12.58% Rat 4 6.50% 11.63% 4.18% 12.98% 3.49% 11.96% 8.59% 11.13% 15.19% 10.18% 6.13% 15.21%
The mean coefficient of intraoperator variation of is 13.74%; the mean coefficient of interoperator variation 16.43%.
Each expert (Exp) A, B, and C segmented the stroke area three times on different days. Intra- and inter-coefficient of variations are computed.
Get Radiology Tree app to read full this article<
Get Radiology Tree app to read full this article<
Assessment of Accuracy
Get Radiology Tree app to read full this article<
TPVF(S,ST)=|ST∩S|/|ST|, T
P
V
F
(
S
,
S
T
)
=
|
S
T
∩
S
|
/
|
S
T
|
,
FPVF(S,ST)=|S−ST|/|ST|, F
P
V
F
(
S
,
S
T
)
=
|
S
−
S
T
|
/
|
S
T
|
,
FNVF(S,ST)=|ST−S|/|ST|. F
N
V
F
(
S
,
S
T
)
=
|
S
T
−
S
|
/
|
S
T
|.
Get Radiology Tree app to read full this article<
Get Radiology Tree app to read full this article<
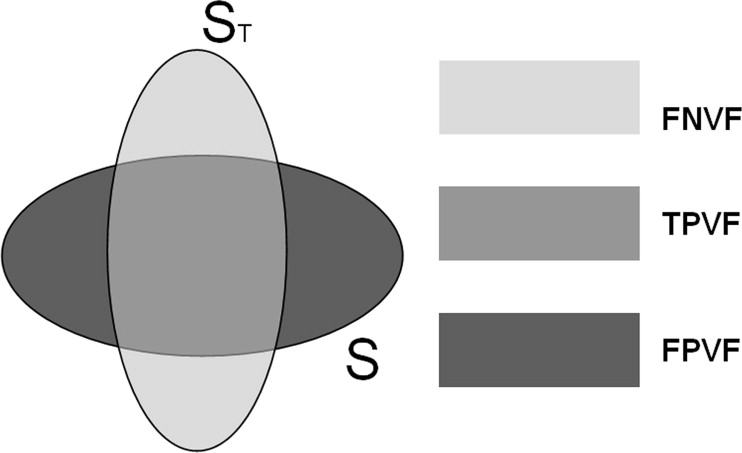
Table 3
Accuracy Measurement of the Automated Segmentation Method
Slice 10 Slice 11 Slice 12 TPVF FPVF FNVF TPVF FPVF FNVF TPVF FPVF FNVF Rat 1 (S2) 0.822 0.7787 0.1779 0.962 0.2697 0.0382 0.993 0.3563 0.0067 Rat 2 (S2) 0.948 0.7526 0.0515 0.803 0.1375 0.1973 0.722 0.2997 0.2776 Rat 3 (S2) 0.880 0.3622 0.1199 0.847 0.1549 0.1530 0.974 0.3689 0.0256 Rat 4 (S2) 0.915 0.1451 0.0848 0.837 0.1757 0.1634 0.949 0.2431 0.0510
FPVF: false-positive volume fraction; TPVF: true-positive volume fraction;
Get Radiology Tree app to read full this article<
Assessment of Efficiency
Get Radiology Tree app to read full this article<
Discussion
Get Radiology Tree app to read full this article<
Get Radiology Tree app to read full this article<
Get Radiology Tree app to read full this article<
Get Radiology Tree app to read full this article<
Get Radiology Tree app to read full this article<
Get Radiology Tree app to read full this article<
Get Radiology Tree app to read full this article<
Get Radiology Tree app to read full this article<
Get Radiology Tree app to read full this article<
Get Radiology Tree app to read full this article<
Get Radiology Tree app to read full this article<
Get Radiology Tree app to read full this article<
Get Radiology Tree app to read full this article<
Get Radiology Tree app to read full this article<
Get Radiology Tree app to read full this article<
∂∂t=δt()[μdiv(∇|∇|)−ν+λ1|u0−c1|2−λ2|u0−c2|2]. ∂
∂
t
=
δ
t
(
)
[
μ
d
i
v
(
∇
|
∇
|
)
−
ν
+
λ
1
|
u
0
−
c
1
|
2
−
λ
2
|
u
0
−
c
2
|
2
].
where c1 is object value, c2 is the background value, and μ,ν,λ1,λ2 are fixed parameters.
Get Radiology Tree app to read full this article<
Get Radiology Tree app to read full this article<
Get Radiology Tree app to read full this article<
Conclusion
Get Radiology Tree app to read full this article<
Acknowledgments
Get Radiology Tree app to read full this article<
Get Radiology Tree app to read full this article<
References
1. American Heart Association: Heart disease and stroke statistics, 2006. http://www.americanheart.org/presenter.jhtml?identifier=1928 Accessed December 20, 2006
2. Pham D., Xu C., Prince J.: Current methods in medical image segmentation. Ann Rev Biomed Engineering 2000; 2: pp. 315-337.
3. Kaus M.R., Warfield S.K., Nabavi A., et. al.: Automated segmentation of MR images of brain tumors. Radiology 2001; 218: pp. 586-591.
4. McInerney T., Terzopoulos D.: Deformable models in medical image analysis: a survey. Med Image Anal 1996; 1: pp. 91-108.
5. Udupa J., Leblanc V., Schmidt H., et. al.: Methodology for evaluating image-segmentation algorithms. SPIE 2002; pp. 266-277.
6. Clarke L.P., Velthuizen R.P., Phuphanich S., et. al.: MRI: stability of three supervised segmentation techniques. Magn Reson Imaging 1993; 11: pp. 95-106.
7. Clark M.C., Hall L.O., Goldgof D.B., et. al.: Automatic tumor segmentation using knowledge-based techniques. IEEE Trans Med Imaging 1998; 17: pp. 187-201.
8. Thirion J.P., Prima S., Subsol G., et. al.: Statistical analysis of normal and abnormal dissymmetry in volumetric medical images. Med Image Anal 2000; 4: pp. 111-121.
9. Volkau I., Prakash B., Ananthasubramaniam A., et. al.: Quantitative analysis of brain asymmetry by using the divergence measure: normal-pathological brain discrimination. Acad Radiol 2006; 13: pp. 752-758.
10. Bederson J.B., Pitts L.H., Germano S.M., et. al.: Evaluation of 2,3,5-triphenyltetrazolium chloride as a stain for detection and quantification of experimental cerebral infarction in rats. Stroke 1986; 17: pp. 1304-1308.
11. Harvard apparatus. http://www.harvardapparatus.com/ Accessed June 10, 2004
12. Imielinska C., Rosiene J., Jin Y.: Ground truth for evaluation of ischemic stroke hybrid segmentation in a rat model of temporary middle cerebral artery. Comp Assist Radiol Surg 2005; 1281: pp. 74-79.
13. Bigun J.: Recognition of local symmetries in gray value images by harmonic functions. ICPR 1988; 1: pp. 345-347.
14. Gofman Y., Kiryati N.: Detecting symmetry in grey level images: the global optimization approach. Proceedings of the 13th International Conference on Pattern Recognition 1996; A94.2
15. Reisfeld D., Wolfson H., Yeshurun Y.: Context free attentional operators: the generalized symmetry transform. IJCV 1995; 14: pp. 119-130.
16. Liu X., Imielinska C., Rosiene J.: A novel quantification method for determining previously undetected MR perfusion changes in patients with cognitive deficits following carotid endarterectomy. SPIE 2005; 5747: pp. 796-805.
17. B.Klaus P.H.: Robot vision.1986.MIT PressCambridge, MA
18. Imielinska C., Liu X., Sughrue M., et. al.: Objective quantification of perfusion-weighted computer tomography in the setting of acute aneurysmal subarachnoid hemorrhage. Comp Assist Radiol Surg 2004; 1268: pp. 34-43.
19. Imielinska C., Liu X., Rosiene J.: Towards objective quantification of perfusion- weighted computed tomography in the setting of subarachnoid hemorrhage: quantification of symmetry and automated delineation of vascular territories. Acad Radiol 2005; 12: pp. 874-887.
20. Lehmann E.L.: Nonparametric statistical methods based on ranks.1975.McGraw-HillNew York
21. Rafael C., Gonzalez R.E.W.: Digital image processing.Ed 22002.Prentice HallNew York
22. Imielinska C., Jin Y., Liu X., et. al.: Evaluation of ischemic stroke hybrid segmentation in a rat model of temporary middle cerebral artery occlusion using ground truth from histologic and MR data. SPIE 2005;
23. Udupa J.K., Leblanc V.R., Zhuge Y., et. al.: A framework for evaluating image segmentation algorithms. Comp Med Imaging Graph 2006; 30: pp. 75-87.
24. Tulipano P.K., Millar W., Imielinska C., et. al.: Quantification of diffusion weighted images (dwi and apparent diffusion coefficient maps (ADC) in detection of acute stroke. SPIE 2006;
25. Periaswamy S., Weaver J.B., Healy D.M., et. al.: Differential affine motion estimation for medical image registration. SPIE 2000; pp. 1066-1075.
26. Liu X., Ogden R.T., Imielinska C., et. al.: Statistical bilateral asymmetry measurement in brain images.2006. IEEE 2006 International Conference of the Engineering in Medicine and Biology Society. New York. p. 1441–1145
27. Liu X., Imielinska C., Laine A., et. al.: Symmetry identification using partial surface matching and tilt correction in 3D brain images.2006.pp. 1056-1060. IEEE 2006 International Conference of the Engineering in Medicine and Biology Society. New York
28. Udupa J.K., Samarasekera S.: Fuzzy connectedness and object definition. SPIE 1995; pp. 2-11.
29. Angelini E., Song T., Mensh B., et. al.: Brain MRI segmentation with multiphase minimal partitioning: a comparative study. Intl J Biomed Imaging 2007; 2007: pp. 10526.