
Rationale and Objectives
Atherothrombosis usually occurs on macrophage- and lipid-rich unstable plaque, but rarely on smooth muscle cell (SMC)-rich stable plaque. Magnetic resonance imaging (MRI) has been extensively applied for noninvasive vascular imaging. We therefore investigated whether MRI provides valuable information about the characteristics of atherosclerotic vessels using rabbit models of macrophage-rich or SMC-rich atherosclerotic arteries.
Materials and Methods
Rabbits were fed with a conventional (CD group, n = 3) or 0.5% cholesterol (ChD group, n = 3) diet for 1 week before and 3 weeks after balloon injury of the left iliac arteries. Three weeks later, these arteries were investigates by 1.5 T MRI and by conventional angiographic imaging, followed by histological and immunohistochemical analyses.
Results
Three weeks after balloon injury, injured iliac arteries of both groups formed neointima with luminal stenosis. Conventional and MRI angiographic findings of the luminal diameter significantly and positively correlated. T1 relaxation time was significantly shorter and the lipid content was much higher in injured arteries from the ChD than from the CD group. The injured arteries from the ChD also contained more macrophages and less SMCs that those from the CD group. The T1 relaxation time and lipid content in injured arteries negatively and positively correlated with the degree of macrophage accumulation, respectively.
Conclusion
These results showed that MRI could provide valuable information about luminal stenosis and the characteristics of atherosclerotic vessels in rabbits.
Thrombus formation after atherosclerotic plaque disruption is a major cause of acute coronary syndrome and stroke. Atherothrombosis usually occurs on macrophage- and lipid-rich unstable plaque, but rarely on smooth muscle cell (SMC)-rich stable plaque . Beside luminal stenosis, plaque composition and morphology are key determinants of whether a plaque will cause cardiovascular events. Despite major advances in treatment, a high ratio of apparently healthy and asymptomatic patients dies of atherosclerosis . Therefore the development of screening and diagnostic methods to identify and characterize plaque composition is very important to determine the patient-specific risk of cardiovascular events and improve treatment strategies.
Magnetic resonance imaging (MRI) is used extensively for noninvasive vascular imaging, because it can identify components of atherosclerotic plaques such as a lipid-rich/necrotic core, calcification, and hemorrhage . It can also visualize and quantify lipid-rich human carotid plaque and the rabbit aorta . However, whether or not MRI can distinguish between stable and unstable atherosclerotic vessels in vivo is unknown. The aim of the study is to investigate whether MRI can distinguish between rabbit iliac arteries with macrophage-rich and SMC-rich atherosclerotic lesions.
Materials and methods
Experimental Design
Get Radiology Tree app to read full this article<
Get Radiology Tree app to read full this article<
MRI
Get Radiology Tree app to read full this article<
Ex vivo Study
Get Radiology Tree app to read full this article<
Image and Data Analysis
Get Radiology Tree app to read full this article<
T1=TRln(sinα⋅cosβ⋅Iβ−sinβ⋅cosα⋅Iαsinα⋅Iβ−sinβ⋅Iα) T
1
=
T
R
ln
(
sin
α
⋅
cos
β
⋅
I
β
−
sin
β
⋅
cos
α
⋅
I
α
sin
α
⋅
I
β
−
sin
β
⋅
I
α
)
T2=TE2−TE1ln(I1I2) T
2
=
T
E
2
−
T
E
1
ln
(
I
1
I
2
)
Lipid content by percentage (%) was derived from the following respective equations :
Lipid content(%)=I(T1WIwithoutfatsaturation)−I(T1WIwithfatsaturation)I(T1WIwithoutfatsaturation)×100 Lipid content
(
%
)
=
I
(
T
1
W
I
without
fat
saturation
)
−
I
(
T
1
W
I
with
fat
saturation
)
I
(
T
1
W
I
without
fat
saturation
)
×
100
Get Radiology Tree app to read full this article<
Serum Lipid Marker Sampling and Analysis
Get Radiology Tree app to read full this article<
Light Microscopy and Immunohistochemistry
Get Radiology Tree app to read full this article<
Statistical Analysis
Get Radiology Tree app to read full this article<
Results
Serum Concentrations of TC and TG 4 Weeks after Diets
Get Radiology Tree app to read full this article<
Magnetic Resonance Angiography 3 Weeks after Balloon Injury
Get Radiology Tree app to read full this article<
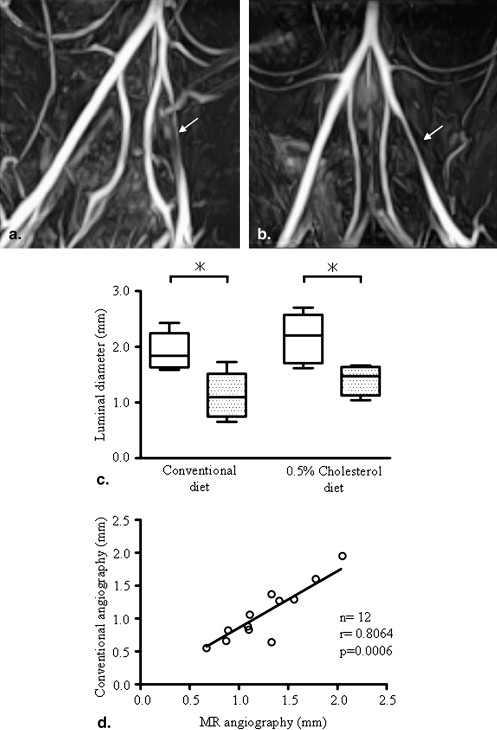
Get Radiology Tree app to read full this article<
MRI in vivo 3 Weeks after Balloon Injury
Get Radiology Tree app to read full this article<
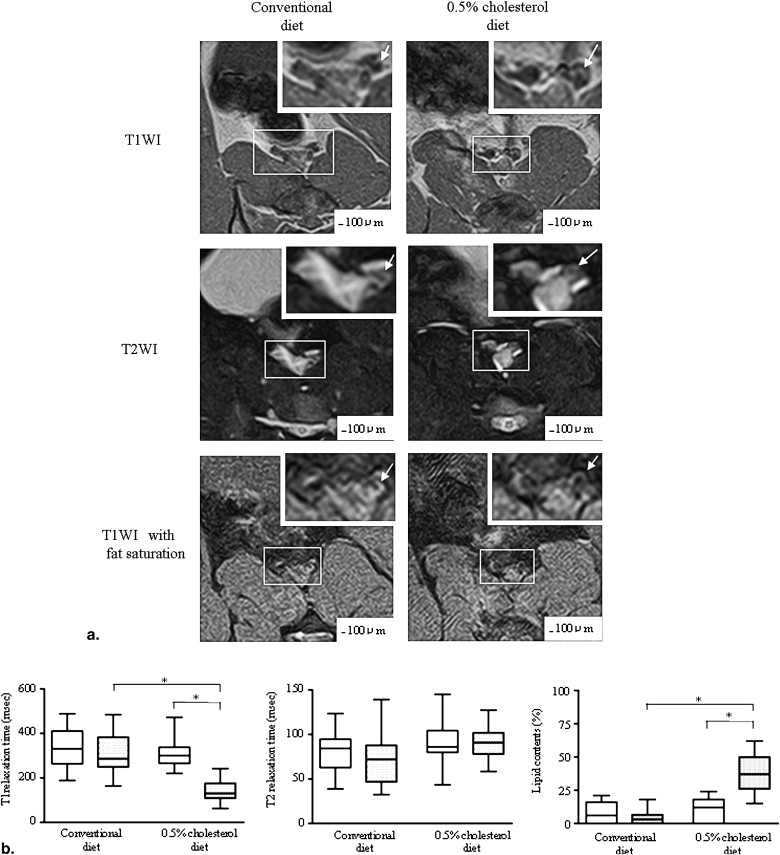
Get Radiology Tree app to read full this article<
Histopathological Correlation
Get Radiology Tree app to read full this article<
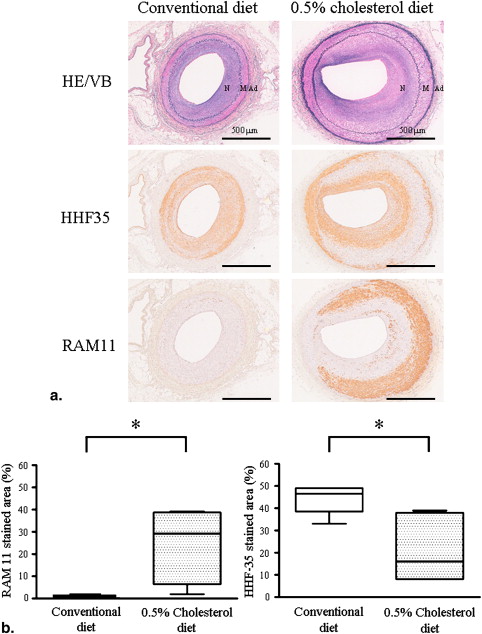
Get Radiology Tree app to read full this article<
Ex vivo MRI and Histopathological Correlation
Get Radiology Tree app to read full this article<
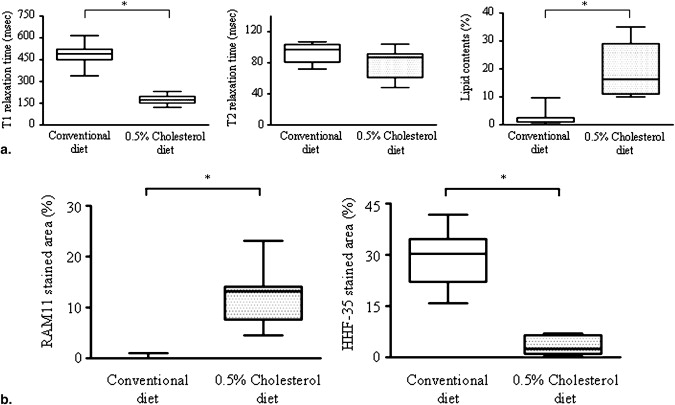
Get Radiology Tree app to read full this article<
Discussion
Get Radiology Tree app to read full this article<
Get Radiology Tree app to read full this article<
Get Radiology Tree app to read full this article<
Get Radiology Tree app to read full this article<
Get Radiology Tree app to read full this article<
References
1. Davies M.J.: Stability and instability: two faces of coronary atherosclerosis. Circulation 1996; 94: pp. 2013-2020.
2. Morteza N., Libby L., Falk E., et. al.: From vulnerable plaque to vulnerable patient. Circulation 2003; 108: pp. 1664-1672.
3. Fayad Z.A., Fuster V.: Characterization of atherosclerotic plaques by magnetic resonance imaging. Ann NY Acad Sci 2000; 902: pp. 173.
4. Saam T., Hatsukami T.S., Takaya N., et. al.: The vulnerable, or high-risk, atherosclerotic plaque: noninvasive MR imaging for characterization and assessment. Radiology 2007; 244: pp. 64-77.
5. Yuan C., Mitsumori L.M., Ferguson M.S., et. al.: In vivo accuracy of multispectral magnetic resonance imaging for identifying lipid-rich necrotic cores and intraplaque hemorrhage in advanced human carotid plaques. Circulation 2001; 104: pp. 2051-2056.
6. Cai J.M., Hatsukami T.S., Ferguson M.S., et. al.: Classification of human carotid atherosclerotic lesions with in vivo multicontrast magnetic resonance imaging. Circulation 2002; 106: pp. 1368-1373.
7. Saam T., Ferguson M.S., Yarnykh V.J., et. al.: Quantitative evaluation of carotid plaque composition by in vivo MRI. Arterioscler Thromb Vasc Biol 2005; 25: pp. 234-239.
8. Helt G., Worthley S.G., Fuster V., et. al.: Atherosclerotic aortic component quantification by noninvasive magnetic resonance imaging: an in vivo study in rabbits. J Am Coll Cardiol 2001; 37: pp. 1149-1154.
9. Yamashita A., Furukoji E., Marutsuka K., et. al.: Increased vascular wall thrombogenicity combined with reduced blood flow promotes occlusive thrombus formation in rabbit femoral artery. Arterioscler Thromb Vasc Biol 2004; 24: pp. 2420-2424.
10. Rasband, W.S., ImageJ, US National Institutes of Health, Bethesda, MD. http://rsb.info.nih.gov/ij/ , 1997–2008.
11. Ishimori Y., Kimura H., Uematsu H., et. al.: Dynamic T1 estimation of brain tumors using double-echo dynamic MR imaging. J Magn Reson Imaging 2003; 18: pp. 113-120.
12. Griffin J.F., Yeung D., Antonio G.E., et. al.: Vertebral marrow fat content and diffusion and perfusion indexes in woman with varying bone density: MR evaluation. Radiology 2006; 241: pp. 831-838.
13. Yamashita A., Shoji K., Tsuruda T., et. al.: Medial and adventitial macrophages are associated with expansive atherosclerotic remodeling in rabbit femoral artery. Histol Histopathol 2008; 23: pp. 127-136.
14. Fayad Z.A., Fuster V.: Clinical imaging of the high-risk or vulnerable atherosclerotic plaque. Circ Res 2001; 89: pp. 305-316.
15. Fuster V., Moreno P.R., Fayad Z.A., et. al.: Atherothrombosis and high-risk plaque. J Am Coll Cardiol 2005; 46: pp. 937-954.
16. Cappendijk V.C., Heeneman S., Kessels A., et. al.: Comparison of single-sequence T1w TFE MRI with multisequence MRI for the quantification of lipid-rich necrotic core in atherosclerotic plaque. J Magn Reson Imaging 2008; 27: pp. 1347-1355.
17. Katz S.S., Shipley G.G., Small D.M.: Physical chemistry of the lipids of human atherosclerotic lesions. Demonstration of a lesion intermediate between fatty streaks and advanced plaques. J Clin Invest 1976; 58: pp. 200-211.
18. Small D.M., Shipley G.G.: Physical-chemical basis of lipid deposition in atherosclerosis. Science 1974; 185: pp. 222-229.
19. Yuan C., Petty C., O’Brien K.D., et. al.: In vitro and in situ magnetic resonance imaging signal features of atherosclerotic plaque-associated lipids. Arterioscler Thromb Vasc Biol 1997; 17: pp. 1496-1503.
20. Yuan C., Tsuruda J.S., Beach K.N., et. al.: Techniques for high-resolution MR imaging of atherosclerotic plaque. J Magn Reson Imaging 1994; 4: pp. 43-49.
21. Toussaint J.F., Southern J.F., Fuster V., et. al.: T2 contrast for NMR characterization of human atherosclerosis. Arterioscler Thromb Vasc Biol 1995; 15: pp. 1533-1542.
22. Serfaty J.M., Chaabane L., Tabib A., et. al.: Atherosclerotic plaques: classification and characterization with T2-weighted high-spatial-resolution MR imaging-an in vitro study. Radiology 2001; 219: pp. 403-410.
23. Saam T., Hatsukami T.S., Takaya N., et. al.: The vulnerable, or high-risk, atherosclerotic plaque: noninvasive MR imaging for characterization and assessment. Radiology 2007; 244: pp. 64-77.
24. Helft G., Worthley S.G., Fuster V., et. al.: Progression and regression of atherosclerotic lesions: monitoring with serial noninvasive magnetic resonance imaging. Circulation 2002; 105: pp. 993-998.
25. Kerwin W.S., O’brien K.D., Ferguson M.S., et. al.: Inflammation in carotid atherosclerotic plaque: a dynamic contrast-enhanced MR imaging study. Radiology 2006; 241: pp. 459-468.