
Rationale and Objectives
Discrepancy rates for interpretations produced in a call situation are one metric to evaluate residents during training. Current benchmarks, reported in previous studies, do not consider the effects of practice pattern variability among attending radiologists. This study aims to investigate the impact of attending variability on resident discrepancy rates to determine if the current benchmarks are an accurate measure of resident performance and, if necessary, update discrepancy benchmarks to accurately identify residents performing below expectations.
Materials and Methods
All chest radiographs, musculoskeletal (MSK) radiographs, chest computed tomographies (CTs), abdomen and pelvis CTs, and head CTs interpreted by postgraduate year-3 residents in a call situation over 5 years were reviewed for the presence of a significant discrepancy and composite results compared to prior findings. Simulations of the expected discrepancy distribution for an “average resident” were then performed using Gibbs sampling, and this distribution was compared to the actual resident distribution.
Results
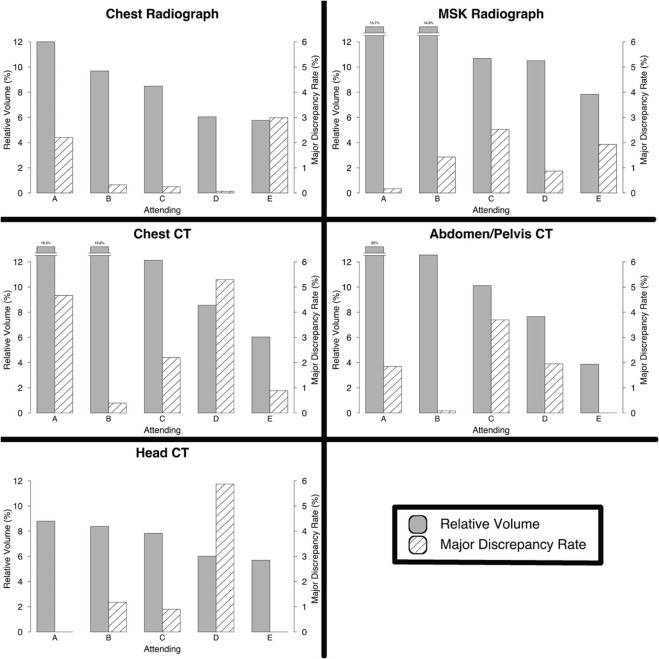
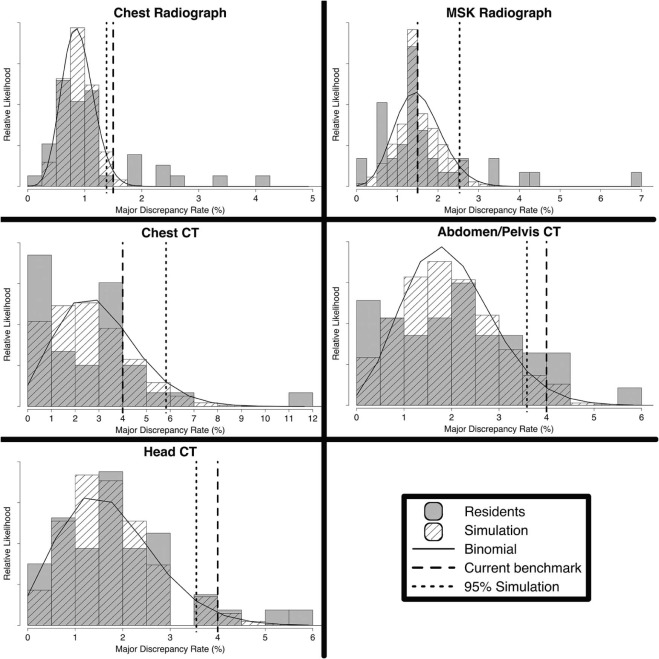
A strong inverse correlation between resident volume and discrepancy rates was found. There was wide variability among attendings in both overread volume and propensity to issue a discrepancy, although there was no significant correlation. Simulations show that previous benchmarks match well for chest radiographs, abdomen and pelvis CTs, and head CTs but not for MSK radiographs and chest CTs. The simulations also demonstrate a large effect of attending practice patterns on resident discrepancy rates.
Conclusions
The large variability in attending practice patterns suggests direct comparison of residents using discrepancy rates is unlikely to reflect true performance. Current benchmarks for chest radiographs, abdomen and pelvis CTs, and head CTs are appropriate and correctly flag residents whose performance may benefit from additional attention, whereas those for MSK radiographs and chest CTs are likely too strict.
Introduction
There is increasing use of metrics to demonstrate competency and measure performance of trainees across all specialties of medicine . Within radiology, discrepancy rates for study interpretations made in call situations, without immediate attending input or oversight, are commonly incorporated into resident feedback . This feedback may be occasional, in the form of missed case conferences or a semiannual meeting with the program director, or in near real-time implemented in a dashboard that residents can access via a web interface .
Many radiology residency programs calculate on-call discrepancy rates of trainees to understand trainee performance . At our institution, a previous study investigated the distribution of individual discrepancy rates across all residents . Although many factors contribute to trainee discrepancies, rates greater than anticipated, falling above 1.5% for radiographs and 4.0% for computed tomographies (CTs) (approximately two standard deviations above the mean), are considered outliers and indicate the potential need for intervention to ensure the resident performs at a level adequate for training . These values are in line with discrepancy rates reported elsewhere . To ensure adequate sampling of an individual resident, the cutoffs were applied only after residents had interpreted greater than 200 radiographs and 50 CTs in total.
Get Radiology Tree app to read full this article<
Get Radiology Tree app to read full this article<
Get Radiology Tree app to read full this article<
Materials and Methods
Get Radiology Tree app to read full this article<
Resident Call Structure
Get Radiology Tree app to read full this article<
Get Radiology Tree app to read full this article<
Preliminary Report Overreading
Get Radiology Tree app to read full this article<
Get Radiology Tree app to read full this article<
Discrepancy Data Analysis
Get Radiology Tree app to read full this article<
Get Radiology Tree app to read full this article<
Simulations
Get Radiology Tree app to read full this article<
Get Radiology Tree app to read full this article<
Updated Benchmarks
Get Radiology Tree app to read full this article<
Results
Measured Discrepancy Data
Get Radiology Tree app to read full this article<
Table 1
Volume and Discrepancy Rate Information for PGY-3 Residents. The Correlation of the Resident Volume and Resident Discrepancy Rate Was Performed Using Pearson Product Moment Correlation
Study Type Residents Meeting Minimum Volume Average Volume Resident Discrepancy Rate Volume/Rate Correlation Volume/Rate P Value Chest radiograph 41 1157 ± 523 1.11 ± 0.82% −0.651P < .0001 MSK radiograph 38 474 ± 130 1.73 ± 1.32% −0.613P < .0001 Chest CT 33 103 ± 31 3.01 ± 2.31% −0.297P = .093 Abdominal and pelvis CT 42 223 ± 78 2.13 ± 1.26% −0.381P = .013 Head CT 42 169 ± 58 1.86 ± 1.33% −0.354P = .021
CT, computed tomography; PGY, postgraduate years.
Get Radiology Tree app to read full this article<
Get Radiology Tree app to read full this article<
Get Radiology Tree app to read full this article<
Get Radiology Tree app to read full this article<
Simulation Data
Get Radiology Tree app to read full this article<
Get Radiology Tree app to read full this article<
Get Radiology Tree app to read full this article<
Discussion
Get Radiology Tree app to read full this article<
Get Radiology Tree app to read full this article<
Get Radiology Tree app to read full this article<
Get Radiology Tree app to read full this article<
Get Radiology Tree app to read full this article<
Table 2
Discrepancy Rate Information for Residents and the Simulated Distribution. The 95th Percentile of the Binomial Distribution Was Calculated from a Fit of the Simulated Data
Study Type Resident Discrepancy Rate %) Simulated Discrepancy Rate (%) Current Benchmark (%) Binomial 95th Percentile (%) Chest radiograph 1.11 ± 0.82 0.88 ± 0.28 1.5 1.38 MSK radiograph 1.73 ± 1.32 1.53 ± 0.56 1.5 2.53 Chest CT 3.01 ± 2.31 2.96 ± 1.67 4.0 5.83 Abdominal and pelvis CT 2.13 ± 1.26 1.97 ± 0.93 4.0 3.59 Head CT 1.86 ± 1.33 1.71 ± 1.00 4.0 3.55
CT, computed tomography; MSK, musculoskeletal.
Get Radiology Tree app to read full this article<
Get Radiology Tree app to read full this article<
Conclusions
Get Radiology Tree app to read full this article<
Get Radiology Tree app to read full this article<
References
1. Schmitt J.E., Scanlon M.H., Servaes S., et. al.: Milestones on a shoestring: a cost-effective, semi-automated implementation of the new ACGME requirements for radiology. Acad Radiol 2015; 22: pp. 1287-1293.
2. Carraccio C., Englander R., Holmboe E.S., et. al.: Driving care quality: aligning trainee assessment and supervision through practical application of entrustable professional activities, competencies, and milestones. Acad Med 2015; 91: pp. 199-203.
3. Cooney C.M., Cooney D.S., Bello R.J., et. al.: Comprehensive observations of resident evolution: a novel method for assessing procedure-based residency training. Plast Reconstr Surg 2016; 137: pp. 673-678.
4. Issa G., Taslakian B., Itani M., et. al.: The discrepancy rate between preliminary and official reports of emergency radiology studies: a performance indicator and quality improvement method. Acta Radiol 2015; 56: pp. 598-604.
5. Itri J.N., Kang H.C., Krishnan S., et. al.: Using focused missed-case conferences to reduce discrepancies in musculoskeletal studies interpreted by residents on call. Am. J. Roentgenol 2011; 197: pp. W696-W705.
6. Chen P.H., Chen Y.J., Cook T.S.: Capricorn—a web-based automatic case log and volume analytics for diagnostic radiology residents. Acad Radiol 2015; 22: pp. 1242-1251.
7. Kalaria A.D., Filice R.W.: Comparison-Bot: an automated preliminary-final report comparison system. J Digit Imaging 2016; 29: pp. 325-330.
8. Platon A., Becker M., Perneger T., et. al.: Emergency computed tomography: what is missed at first reading?. J Comput Assist Tomogr 2016; 40: pp. 177-182.
9. Mellnick V., Raptis C., McWilliams S., et. al.: On-call radiology resident discrepancies: categorization by patient location and severity. J Am Coll Radiol 2016; 13: pp. 1233-1238.
10. Ruutiainen A.T., Scanlon M.H., Itri J.N.: Identifying benchmarks for discrepancy rates in preliminary interpretations provided by radiology trainees at an academic institution. J Am Coll Radiol 2011; 8: pp. 644-648.
11. Sistrom C., Deitte L.: Factors affecting attending agreement with resident early readings of computed tomography and magnetic resonance imaging of the head, neck, and spine. Acad Radiol 2008; 15: pp. 934-941.
12. Ruutiainen A.T., Durand D.J., Scanlon M.H., et. al.: Increased error rates in preliminary reports issued by radiology residents working more than 10 consecutive hours overnight. Acad Radiol 2013; 20: pp. 305-311.
13. Bruni S.G., Bartlett E., Yu E.: Factors involved in discrepant preliminary radiology resident interpretations of neuroradiological imaging studies: a retrospective analysis. AJR Am J Roentgenol 2012; 198: pp. 1367-1374.
14. Walls J., Hunter N., Brasher P.M.A., et. al.: The DePICTORS Study: discrepancies in preliminary interpretation of CT scans between on-call residents and staff. Emerg Radiol 2009; 16: pp. 303-308.
15. Cooper V.F., Goodhartz L.A., Nemcek A.A., et. al.: Radiology resident interpretations of on-call imaging studies: the incidence of major discrepancies. Acad Radiol 2008; 15: pp. 1198-1204.
16. Huntley J.H., Carone M., Yousem D.M., et. al.: Opportunities for targeted education: critical neuroradiologic findings missed or misinterpreted by residents and fellows. Am. J. Roentgenol 2015; 205: pp. 1155-1159.
17. Ruma J., Klein K.A., Chong S., et. al.: Cross-sectional examination interpretation discrepancies between on-call diagnostic radiology residents and subspecialty faculty radiologists: analysis by imaging modality and subspecialty. J Am Coll Radiol 2011; 8: pp. 409-414.
18. Harrison R.L.: Introduction to Monte Carlo simulation. AIP Conf Proc 2010; 1204: pp. 17-21.
19. Pow R.E., Mello-Thoms C., Brennan P.: Evaluation of the effect of double reporting on test accuracy in screening and diagnostic imaging studies: a review of the evidence. J Med Imaging Radiat Oncol 2016; 60: pp. 306-314.
20. Wu M.Z., McInnes M.D.F., Macdonald D.B., et. al.: CT in adults: systematic review and meta-analysis of interpretation discrepancy rates. Radiology 2014; 270: pp. 717-735.
21. R Core Team : R: A language and environment for statistical computing.2016.R Foundation for Statistical ComputingVienna, Austria. Available at: https://www.R-project.org/ Accessed January 18, 2017
22. Hines K.E.: A primer on Bayesian inference for biophysical systems. Biophys J 2015; 108: pp. 2103-2113.
23. Brown J.M., Dickerson E.C., Rabinowitz L.C., et. al.: “Concordance” revisited: a multispecialty appraisal of “concordant” preliminary abdominopelvic CT reports. J Am Coll Radiol 2016; 13: pp. 1111-1117.