
Rationale and Objectives
To develop a computerized system for segmentation of bladder lesions on computed tomography urography (CTU) scans for detection and characterization of bladder cancer.
Materials and Methods
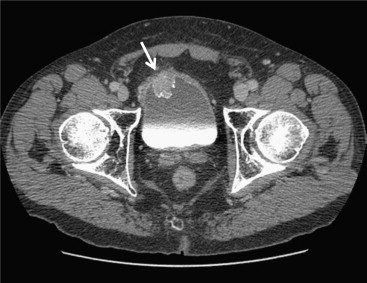
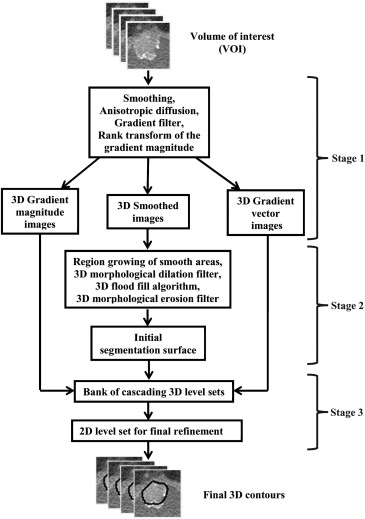
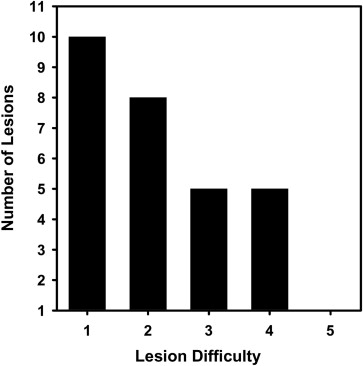
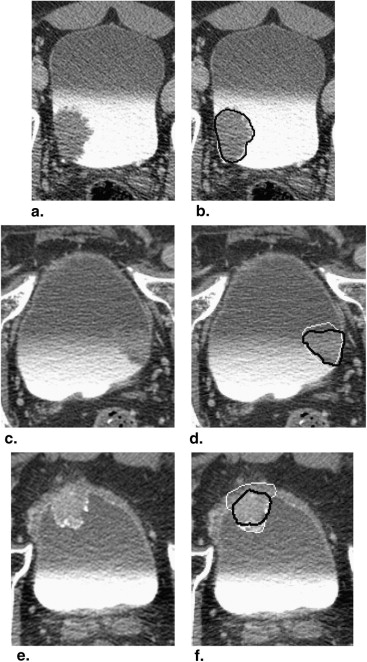
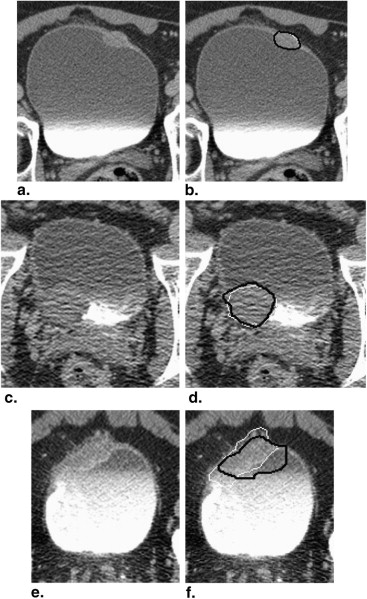
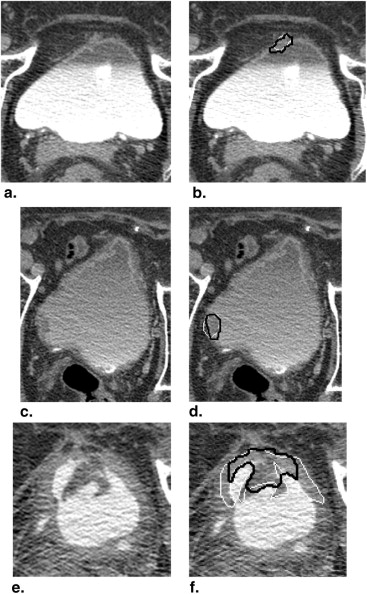
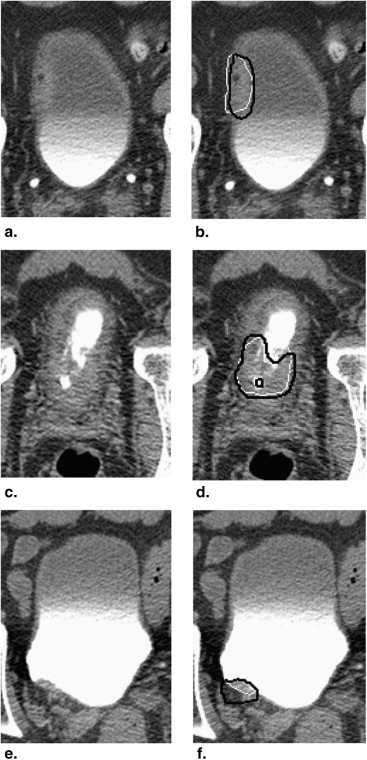
We have developed an auto-initialized cascaded level set method to perform bladder lesion segmentation. The segmentation performance was evaluated on a preliminary dataset including 28 CTU scans from 28 patients collected retrospectively with institutional review board approval. The bladders were partially filled with intravenous contrast material. The lesions were located fully or partially within the contrast-enhanced area or in the non–contrast-enhanced area of the bladder. An experienced abdominal radiologist marked 28 lesions (14 malignant and 14 benign) with bounding boxes that served as input to the automated segmentation system and assigned a difficulty rating on a scale of 1 to 5 (5 = most subtle) to each lesion. The contours from automated segmentation were compared to three-dimensional contours manually drawn by the radiologist. Three performance metric measures were used for comparison. In addition, the automated segmentation quality was assessed by an expert panel of two experienced radiologists, who provided quality ratings of the contours on a scale from 1 to 10 (10 = excellent).
Results
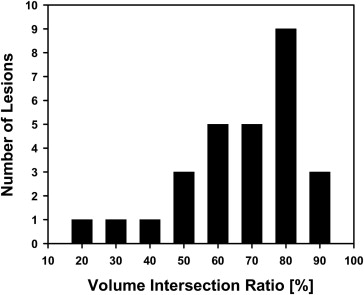
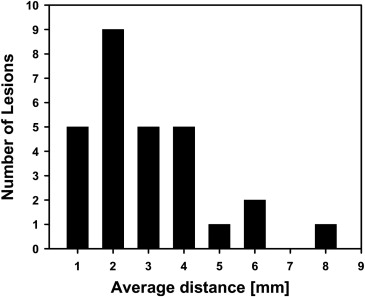
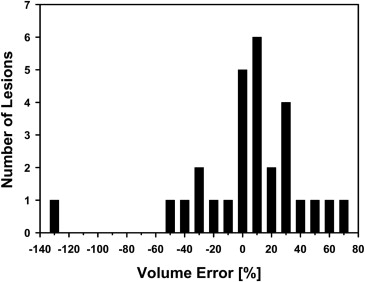
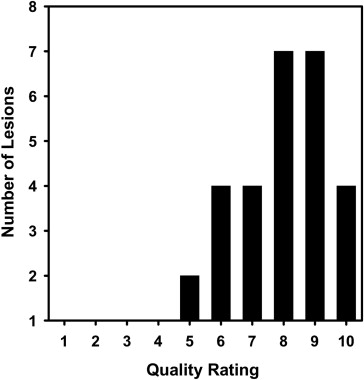
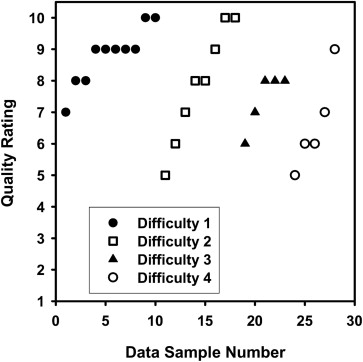
The average volume intersection ratio, the average absolute volume error, and the average distance measure were 67.2 ± 16.9%, 27.3 ± 26.9%, and 2.89 ± 1.69 mm, respectively. Of the 28 segmentations, 18 were given quality ratings of 8 or above. The average rating was 7.9 ± 1.5. The average quality ratings for lesions with difficulty ratings of 1, 2, 3, and 4 were 8.8 ± 0.9, 7.9 ± 1.8, 7.4 ± 0.9, and 6.6 ± 1.5, respectively.
Conclusion
Our preliminary study demonstrates the feasibility of using the three-dimensional level set method for segmenting bladder lesions in CTU scans.
Introduction
Bladder cancer is a common type of cancer that can cause substantial morbidity and mortality among both men and women. Bladder cancer causes 14,880 deaths per year in the United States . Early detection of bladder cancers is very important. The survival rate for patients whose cancers were detected and treated early is high . Early diagnosis and treatment of these lesions can improve the morbidity, mortality, and their attendant costs compared to diagnosis at a later stage when muscularis mucosa invasion and/or regional or distant metastases have developed. However, at the present time, only 75% of cancers are detected in the early localized stage.
Multidetector row computed tomography (MDCT) urography is a very promising new imaging modality for evaluation of patients with known or suspected urothelial neoplasms . It offers the distinct advantage of providing essentially complete imaging of the urinary tract and of the remainder of the abdomen and pelvis in a single study. With MDCT urography, it is expected that the need for other imaging studies (such as intravenous urography, ultrasonography, or magnetic resonance imaging) will be substantially reduced. Computed tomography urography (CTU), therefore, may spare the patient the considerable effort of undergoing a potentially large number of alternative imaging studies and also reduce health care costs.
Get Radiology Tree app to read full this article<
Get Radiology Tree app to read full this article<
Get Radiology Tree app to read full this article<
Get Radiology Tree app to read full this article<
Materials and methods
Get Radiology Tree app to read full this article<
Get Radiology Tree app to read full this article<
Level Set Segmentation
Get Radiology Tree app to read full this article<
Get Radiology Tree app to read full this article<
Get Radiology Tree app to read full this article<
Get Radiology Tree app to read full this article<
x∈C˜:{|I(x)−μ|≤3.0σ,I(x)>−400HU}, x
∈
C
˜
:
{
|
I
(
x
)
−
μ
|
≤
3.0
σ
,
I
(
x
)
−
400
H
U
}
,
where I ( x ) is the voxel value. A morphological dilation filter, 3D flood fill algorithm, and morphological erosion filter are applied to C˜ C
˜ to connect neighboring components and extract an initial segmentation surface C .
Get Radiology Tree app to read full this article<
Get Radiology Tree app to read full this article<
Dataset
Get Radiology Tree app to read full this article<
Get Radiology Tree app to read full this article<
Evaluation Methods
Get Radiology Tree app to read full this article<
AVDIST(G,U)=12(∑x∈Gmin{d(x,y):y∈U}NG+∑y∈Umin{d(x,y):x∈G}NU), A
V
D
I
S
T
(
G
,
U
)
=
1
2
(
∑
x
∈
G
min
{
d
(
x
,
y
)
:
y
∈
U
}
N
G
+
∑
y
∈
U
min
{
d
(
x
,
y
)
:
x
∈
G
}
N
U
)
,
where G is the gold standard 3D surface contour marked by the radiologist and U is the 3D contour being evaluated. N G and N U denote the number of points (voxels) on G and U , respectively. The function d is the Euclidean distance. For a given voxel along the contour G , the distance to the closest point along the contour U is determined. The minimum distances for all points in G are averaged. This process is repeated by switching the roles of G and U . The two average minimum distances are then averaged.
Get Radiology Tree app to read full this article<
Get Radiology Tree app to read full this article<
R3D=VG∩VUVG, R
3
D
=
V
G
∩
V
U
V
G
,
where V__G is the volume enclosed by the gold standard contour G and V__U is the volume enclosed by the contour U . A value of 1 indicates that V__U completely overlap with V__G , whereas a value of 0 implies V__U and V__G are disjoint.
Get Radiology Tree app to read full this article<
Get Radiology Tree app to read full this article<
E3D=VG−VUVG, E
3
D
=
V
G
−
V
U
V
G
,
where negative error indicates oversegmentation and vice versa. Because the over- and undersegmentation tend to mask the actual deviations from the gold standard when the average is taken, the absolute (unsigned) errors | E__3D | is also calculated.
Get Radiology Tree app to read full this article<
Get Radiology Tree app to read full this article<
Results
Get Radiology Tree app to read full this article<
Get Radiology Tree app to read full this article<
Get Radiology Tree app to read full this article<
Get Radiology Tree app to read full this article<
Get Radiology Tree app to read full this article<
Get Radiology Tree app to read full this article<
Discussion
Get Radiology Tree app to read full this article<
Get Radiology Tree app to read full this article<
Get Radiology Tree app to read full this article<
Conclusion
Get Radiology Tree app to read full this article<
Get Radiology Tree app to read full this article<
References
1. American Cancer Society. www.cancer.org 2012. Cancer Facts & Figures 2012.
2. McCarthy C.L., Cowan N.C.: Multidetector CT urography (MD-CTU) for urothelial imaging. Radiology 2002; 225: pp. 237.
3. Noroozian M., Cohan R.H., Caoili E.M., et. al.: Multislice CT urography: state of the art. Br J Radiol 2004; 77: pp. S74-S86.
4. Akbar S.A., Mortele K.J., Baeyens K., et. al.: Multidetector CT urography: Techniques, clinical applications, and pitfalls. Semin Ultrasound CT MRI 2004; 25: pp. 41-54.
5. Liu W.C., Mortele K.J., Silverman S.G.: Incidental extraurinary findings at MDCT urography in patients with hematuria: prevalence and impact on imaging costs. AJR Am J Roentgenol 2005; 185: pp. 1051-1056.
6. Caoili E.M., Cohan R.H., Korobkin M., et. al.: Urinary tract abnormalities: initial experience with multi-detector row CT urography. Radiology 2002; 222: pp. 353-360.
7. Sudakoff G.S., Dunn D.P., Guralnick M.L., et. al.: Multidetector computerized tomography urography as the primary imaging modality for detecting urinary tract neoplasms in patients with asymptomatic hematuria. J Urol 2008; 179: pp. 862-867.
8. Park S.B., Kim J.K., Lee H.J., et. al.: Hematuria: portal venous phase multi detector row CT of the bladder—a prospective study. Radiology 2007; 245: pp. 798-805.
9. Li L., Wang Z., Li X., et. al.: A new partial volume segmentation approach to extract bladder wall for computer aided detection in virtual cystoscopy. Proc SPIE 2004; 5369: pp. 199-206.
10. Duan C., Liang Z., Bao S., et. al.: A coupled level set framework for bladder wall segmentation with application to MR cystography. IEEE Trans Med Imaging 2010; 29: pp. 903-915.
11. Duan C.J., Yuan K.H., Liu F.H., et. al.: Volume-based features for detection of bladder wall abnormal regions via MR cystography. IEEE Trans Biomed Engin 2011; 58: pp. 2506-2512.
12. Duan C.J., Yuan K.H., Liu F.H., et. al.: An adaptive window-setting scheme for segmentation of bladder tumor surface via MR cystography. IEEE Trans Inform Technol Biomed 2012; 16: pp. 720-729.
13. Hadjiiski L, Chan H-P, Caoili E, et al. Segmentation of malignant and benign bladder lesions on multidetector row CT urography using 3D level set. Presented at: Radiological Society of North America 2010 Scientific Assembly and Annual Meeting. Chicago, IL, November 28–December 3, 2010.
14. Street E., Hadjiiski L., Sahiner B., et. al.: Automated volume analysis of head and neck lesions on CT scans using 3D level set segmentation. Med Phys 2007; 34: pp. 4399-4408.
15. Sahiner B., Petrick N., Chan H.P., et. al.: Computer-aided characterization of mammographic masses: accuracy of mass segmentation and its effects on characterization. IEEE Trans Med Imaging 2001; 20: pp. 1275-1284.
16. Way T.W., Hadjiiski L.M., Sahiner B., et. al.: Computer-aided diagnosis of pulmonary nodules on CT scans: segmentation and classification using 3D active contours. Med Phys 2006; 33: pp. 2323-2337.