
Rationale and Objectives
Multimodality evaluation of the aortic annulus is generally advocated to plan for transcatheter aortic valve replacement (TAVR). We compared aortic annular measurements by cardiac computed tomography angiography (cCTA) to three-dimensional transesophageal echocardiography (3D-TEE), and also evaluated the use of semi-automated software for cCTA annular measurements.
Materials and Methods
A retrospective cohort of 74 patients underwent 3D-TEE and electrocardiogram-gated cCTA of the heart within 30 days for TAVR planning. 3D-TEE measurements were obtained during mid-systole; cCTA measurements were obtained during late-systole (40% of R-R interval) and mid-diastole (80% of R-R interval). Annular area was measured independently by manual planimetry and with semi-automated software.
Results
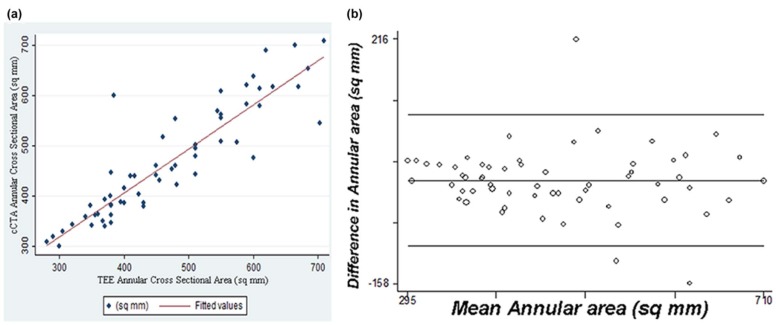
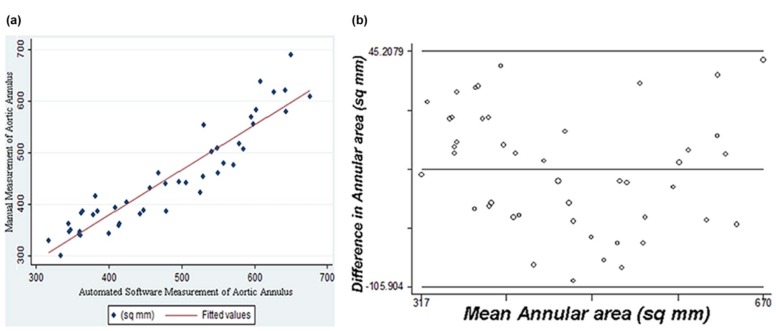
cCTA measurements in systole and diastole were highly correlated for short-axis diameter ( r = 0.91), long-axis diameter ( r = 0.92), and annular area ( r = 0.96), although systolic measurements were significantly larger ( P < 0.001), most notably for the short-axis diameter. Good correlation was observed between 3D-TEE and cCTA for short-axis diameter ( r = 0.84–0.90), long-axis diameter ( r = 0.77–0.79), and annular area ( r = 0.89–0.90). As compared to 3D-TEE, annular area is overmeasured by 28 mm 2 on systolic phase cCTA ( P < 0.008), but nearly identical with 3D-TEE on diastolic phase cCTA. Semi-automated and manual cCTA annulus measurements were highly correlated in systole ( r = 0.94) and diastole ( r = 0.93), although the semi-automated annular area measured 11–30 mm 2 greater than manual planimetry. Of note, the 95% limits of agreement in our Bland-Altman analysis suggest that the variability in annular area estimates for individual patients between cCTA and 3D-TEE (−100.9 to 99.6 mm 2 ), as well as the variability between manual and automated measurements with cCTA (−105.9 to 45.2 mm 2 ), may be sufficient to alter size selection for an aortic prosthesis.
Conclusions
Although all cCTA measurements are highly correlated with measurements by 3D-TEE, diastolic phase cCTA measurements tend to be closer to standard mid-systolic 3D-TEE measurements. Semi-automated measurement of the aortic annulus with cCTA is highly correlated with manual planimetry. Nonetheless, annular contours derived by semi-automated software should be visually inspected, as the variability in area estimates for individual cases between manual and automated measurements may alter the sizing of an aortic prosthesis.
Introduction
Transcatheter aortic valve replacement (TAVR) has emerged as an established nonsurgical treatment option for severe aortic stenosis. Accurate preprocedural planning for TAVR is essential, with an important role for the radiologist in selecting the appropriately sized prosthesis to ensure procedural success . In particular, optimal sizing of the prosthesis is essential to limit postprocedural complications. A prosthesis that is too small for the native annulus canresult in paravalvular aortic regurgitation, device migration, and possible valve embolization. A prosthesis that is too large can result in decreased durability of the valve due to unequal tensile forces or even annular rupture—a complication that can prove fatal. Accurate prosthesis positioning is also important to ensure valve stability and proper valve function. Imaging guidance is therefore essential not only for proper prosthesis selection but also for precise placement within the left ventricular outflow tract.
Although measurements throughout the aorta and iliac system are performed prior to TAVR, measurement of the aortic annulus is the most critical, as this measurement determines the size of the prosthesis. Previous research has demonstrated that the oval shape of the aortic annulus results in underestimation of the annular area based on anteroposterior measurement on 2D echocardiography relative to 3D measurements on transesophageal echocardiography (TEE) and cardiac computed tomography angiography (cCTA) . Furthermore, the aortic annulus is now understood to be a dynamic structure, as the shape and dimensions of the oval structure vary throughout the cardiac cycle . Accurate three-dimensional (3D) measurements of asymmetric cardiac structures with integrated multimodality imaging are, therefore, now considered a critical component for procedural success . It has been suggested in previous studies that sizing of the prosthesis during systole is preferable to diastole, to minimize the risk of paravalvular aortic regurgitation . At our institution, imaging guidance for the TAVR procedure is undertaken with both electrocardiogram (ECG)-gated cCTA that is performed prior to the TAVR procedure as well as with 3D-TEE that is also employed in real time during the procedure.
Get Radiology Tree app to read full this article<
Materials and Methods
Patient Population
Get Radiology Tree app to read full this article<
Cardiac Tomography
Get Radiology Tree app to read full this article<
Get Radiology Tree app to read full this article<
TAVI Semi-Automated Software
Get Radiology Tree app to read full this article<
TEE
Get Radiology Tree app to read full this article<
Statistical Analysis
Get Radiology Tree app to read full this article<
Results
Get Radiology Tree app to read full this article<
Get Radiology Tree app to read full this article<
Table 1
cCTA and 3D-TEE Measurements of the Aortic Annulus
Annular Diameter Minimum (mm) Annular Diameter Maximum (mm) Annular Area (mm 2 ) cCTA systole 22.6 ± 0.4 27.9 ± 0.4 495 ± 14 cCTA diastole 21.5 ± 0.4 27.2 ± 0.4 466 ± 13 3D-TEE 22.1 ± 0.4 26.5 ± 0.5 467 ± 15
3D-TEE, three-dimensional transesophageal echocardiography; cCTA, cardiac computed tomography angiography.
See text for statistical comparisons and P values.
Table 2
Bland-Altman Analysis for Measurements of Aortic Annular Area (mm 2 )
Mean Difference (Bias) 95% CI for the Bias 95% Limits of Agreement cCTA diastole vs cCTA systole 31.576 −39.958 to −23.193 −99.772 to 36.620 cCTA systole vs 3D-TEE 30.083 16.071 to 44.096 −78.405 to 138.571 cCTA diastole vs 3D-TEE −0.672 −13.508 to 12.164 −100.912 to 99.567 cCTA systole vs semi-automated −11.356 −22.418 to −0.293 −85.001 to 62.290 cCTA diastole vs semi-automated −30.348 −41.566 to −19.129 −105.904 to 45.208
3D-TEE, three-dimensional transesophageal echocardiography; cCTA, cardiac computed tomography angiography.
Get Radiology Tree app to read full this article<
Get Radiology Tree app to read full this article<
Get Radiology Tree app to read full this article<
Get Radiology Tree app to read full this article<
Get Radiology Tree app to read full this article<
Discussion
Get Radiology Tree app to read full this article<
Get Radiology Tree app to read full this article<
Get Radiology Tree app to read full this article<
Get Radiology Tree app to read full this article<
Get Radiology Tree app to read full this article<
Get Radiology Tree app to read full this article<
Limitations
Get Radiology Tree app to read full this article<
Get Radiology Tree app to read full this article<
Get Radiology Tree app to read full this article<
Get Radiology Tree app to read full this article<
Get Radiology Tree app to read full this article<
Conclusions
Get Radiology Tree app to read full this article<
References
1. Litmanovich D.E., Ghersin E., Burke D.A., et. al.: Imaging in transcatheter aortic valve replacement (TAVR): role of the radiologist. Insights Imaging 2014; 5: pp. 123-145.
2. Altiok E., Koos R., Schröder J., et. al.: Comparison of two-dimensional and three-dimensional imaging techniques for measurement of aortic annulus diameters before transcatheter aortic valve implantation. Heart 2011; 97: pp. 1578-1584.
3. Suchá D., Tuncay V., Prakken N.H., et. al.: Does the aortic annulus undergo conformational change throughout the cardiac cycle? A systematic review. Eur Heart J Cardiovasc Imaging 2015; 16: pp. 1307-1317.
4. Bloomfield G.S., Gillam L.D., Hahn R.T., et. al.: A practical guide to multimodality imaging of transcatheter aortic valve replacement. JACC Cardiovasc Imaging 2012; 5: pp. 441-455.
5. Willson A.B., Webb J.G., Labounty T.M., et. al.: 3-Dimensional aortic annular assessment by multidetector computed tomography predicts moderate or severe paravalvular regurgitation after transcatheter aortic valve replacement. J Am Coll Cardiol 2012; 59: pp. 1287-1294.
6. Détaint D., Lepage L., Himbert D., et. al.: Determinants of significant paravalvular regurgitation after transcatheter aortic valve: implantation impact of device and annulus discongruence. JACC Cardiovasc Interv 2009; 2: pp. 821-827.
7. Halpern E.J., Mallya R., Sewell M., et. al.: Differences in aortic valve area measured with CT planimetry and echocardiography (continuity equation) are related to divergent estimates of left ventricular outflow tract area. AJR Am J Roentgenol 2009; 192: pp. 1668-1673.
8. Husser O., Holzamer A., Resch M., et. al.: Prosthesis sizing for transcatheter aortic valve implantation—comparison of three dimensional transesophageal echocardiography with multislice computed tomography. Int J Cardiol 2013; 168: pp. 3431-3438.
9. Mehrotra P., Flynn A.W., Jansen K., et. al.: Differential left ventricular outflow tract remodeling and dynamics in aortic stenosis. J Am Soc Echocardiogr 2015; 28: pp. 1259-1266.
10. Boroumand G., White H., Patel P., et. al.: Morphology of left ventricular outflow from the left ventricular outflow tract to the sinotubular junction: comparison of patients with normal aortic valves to those with severe aortic stenosis. Presented at the 100th Annual Meeting of the Radiological Society of North America. Chicago, December2014.
11. Leber A.W., Eichinger W., Rieber J., et. al.: MSCT guided sizing of the Edwards Sapien XT TAVI device: impact of different degrees of oversizing on clinical outcome. Int J Cardiol 2013; 168: pp. 2658-2664.
12. Murphy D.T., Blanke P., Alaamri S., et. al.: Dynamism of the aortic annulus: effect of diastolic versus systolic CT annular measurements on device selection in transcatheter aortic valve replacement (TAVR). J Cardiovasc Comput Tomogr 2016; 10: pp. 37-43.