
Rationale and Objectives
Nephrosclerosis occurs with aging and is characterized by increased kidney subcapsular surface irregularities at autopsy. Assessments of cortical roughness in vivo could provide an important measure of nephrosclerosis. The purpose of this study was to develop and validate an image-processing algorithm for quantifying renal cortical surface roughness in vivo and determine its association with age.
Materials and methods
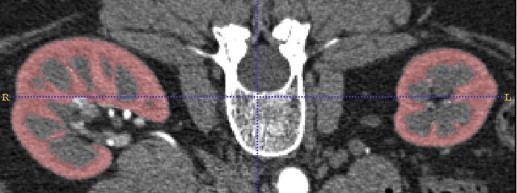
Renal cortical surface roughness was measured on contrast-enhanced abdominal computed tomography (CT) images of potential living kidney donors. A roughness index was calculated based on geometric curvature of each kidney from three-dimensional images and compared to visual observation scores. Cortical roughness was compared between the oldest and youngest donors, and its interaction with cortical volume and age assessed.
Results
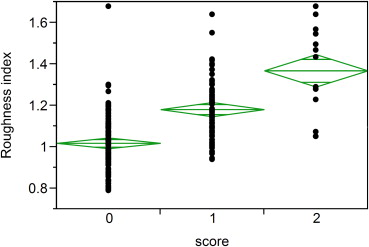
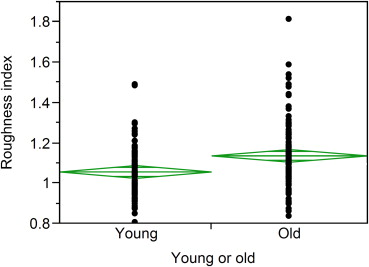
The developed quantitative roughness index identified significant differences in kidneys with visual surface roughness scores of 0 (minimal), 1 (mild), and 2 (moderate; P < .001) in a random sample of 200 potential kidney donors. Cortical roughness was significantly higher in the 94 oldest (64–75 years) versus 91 youngest (18–25 years) potential kidney donors ( P < .001). Lower cortical volume was associated with older age but not with roughness (r = −0.03, P = .75). The association of oldest age group with roughness (odds ratio [OR] = 1.8 per standard deviation [SD] of roughness index) remained significant after adjustment for total cortex volume (OR = 2.0 per SD of roughness index).
Conclusions
A new algorithm to measure renal cortical surface roughness from CT scans detected rougher surface in older compared to younger kidneys, independent of cortical volume loss. This novel index may allow quantitative evaluation of nephrosclerosis in vivo using contrast-enhanced CT.
Nephrosclerosis (glomerulosclerosis, tubular atrophy, interstitial fibrosis, and arteriosclerosis) occurs with normal aging, hypertension, and chronic kidney disease (CKD) . Detection of nephrosclerosis in vivo requires a renal biopsy. Autopsy studies have characterized nephrosclerosis by a rough irregular cortical surface . The detection of these morphologic surface changes in the kidney may help clinicians identify nephrosclerosis. However, the ability to assess cortical surface roughness in vivo has not been previously demonstrated.
Volume computed tomography (CT) imaging with contrast agent enhancement provides submillimeter spatial resolution and good image contrast for kidney anatomy. Kidney volume decreases with older age, whereas kidney function and other CKD risk factors can be associated with either increased or decreased volume . The decline in cortical volume that occurs with older age has been attributed to underlying atrophy and sclerosis of nephrons (nephrosclerosis). However, it is not known whether changes in cortical surface morphology are detectable with CT imaging or whether such changes, if observed, relate to clinical characteristics.
Get Radiology Tree app to read full this article<
Methods
Study Population
Get Radiology Tree app to read full this article<
Get Radiology Tree app to read full this article<
Get Radiology Tree app to read full this article<
Image Acquisition
Get Radiology Tree app to read full this article<
Kidney Segmentation
Get Radiology Tree app to read full this article<
Renal Cortical Surface Roughness Algorithm
Get Radiology Tree app to read full this article<
Get Radiology Tree app to read full this article<
Statistical Analysis
Get Radiology Tree app to read full this article<
Results
Get Radiology Tree app to read full this article<
Table 1
Demographic Characteristics for Each Data Set Analyzed
Set Age, Years (Mean ± Standard Deviation) Female White 1 44 ± 12 53% 100% 2 44 ± 13 61% 97% 3 48 ± 11 57% 100% 4 Old group: 67 ± 3
Young group: 22 ± 2 Old group: 57%
Young group: 40% Old group: 100%
Young group: 93%
Get Radiology Tree app to read full this article<
Get Radiology Tree app to read full this article<

Get Radiology Tree app to read full this article<
Get Radiology Tree app to read full this article<
Get Radiology Tree app to read full this article<
Get Radiology Tree app to read full this article<
Discussion
Get Radiology Tree app to read full this article<
Get Radiology Tree app to read full this article<
Get Radiology Tree app to read full this article<
Get Radiology Tree app to read full this article<
Get Radiology Tree app to read full this article<
Conclusions
Get Radiology Tree app to read full this article<
Get Radiology Tree app to read full this article<
References
1. Rule A.D., Amer H., Cornell L.D., et. al.: The association between age and nephrosclerosis on renal biopsy among healthy adults. Annals of Internal Medicine 2010; 152: pp. 561-567.
2. Tracy R.E., Ishii T.: What is ‘nephrosclerosis’? Lessons from the US, Japan, and Mexico. Nephrol Dial Transplant 2000; 15: pp. 1357-1366.
3. Howie A.J., Ferreira M.A., Adu D.: Prognostic value of simple measurement of chronic damage in renal biopsy specimens. Nephrol Dial Transplant 2001; 16: pp. 1163-1169.
4. Takebayashi S., Kiyoshi Y., Hisano S., et. al.: Benign nephrosclerosis: incidence, morphology and prognosis. Clinical nephrology 2001; 55: pp. 349-356.
5. Robbins S.L., Kumar V.: Robbins and Cotran pathologic basis of disease.8th ed.2010.Saunders/ElsevierPhiladelphia, PA
6. Wang X., Vrtiska T.J., Avula R.T., et. al.: Age, kidney function, and risk factors associate differently with cortical and medullary volumes of the kidney. Kidney Int 2013;
7. Johnson S., Rishi R., Andone A., et. al.: Determinants and functional significance of renal parenchymal volume in adults. Clin J Am Soc Nephrol 2011; 6: pp. 70-76.
8. Paivansalo M.J., Merikanto J., Savolainen M.J., et. al.: Effect of hypertension, diabetes and other cardiovascular risk factors on kidney size in middle-aged adults. Clinical nephrology 1998; 50: pp. 161-168.
9. Yushkevich P.A., Piven J., Hazlett H.C., et. al.: User-guided 3D active contour segmentation of anatomical structures: significantly improved efficiency and reliability. Neuroimage 2006; 31: pp. 1116-1128.
10. Alliez P., Cohen-Steiner D., Devillers O., et. al.: Anisotropic polygonal remeshing. Acm T Graphic 2003; 22: pp. 485-493.
11. Cohen-Steiner D., Morvan J.-M.: Restricted delaunay triangulations and normal cycle.Book restricted delaunay triangulations and normal cycle.2003.ACMBarcelona:pp. 312-321.
12. Dyn N., Hormann K., Kim S.-J., et. al.: Optimizing 3D triangulations using discrete curvature analysis.Tom L.Larry L.S.Mathematical methods for curves and surfaces.2001.Vanderbilt UniversityNashville:pp. 135-146.
13. Griffiths G.J., Robinson K.B., Cartwright G.O., et. al.: Loss of renal tissue in the elderly. Br J Radiol 1976; 49: pp. 111-117.
14. Dorai C., Jain A.K.: COSMOS—a representation scheme for 3D free-form objects. IEEE T Pattern Anal 1997; 19: pp. 1115-1130.
15. Yoshida H., Masutani Y., MacEneaney P., et. al.: Computerized detection of colonic polyps at CT colonography on the basis of volumetric features: pilot study. Radiology 2002; 222: pp. 327-336.
16. Yoshida H., Nappi J., MacEneaney P., et. al.: Computer-aided diagnosis scheme for detection of polyps at CT colonography. Radiographics 2002; 22: pp. 963-979.
17. Tan M., Deklerck R., Jansen B., et. al.: A novel computer-aided lung nodule detection system for CT images. Med Phys 2011; 38: pp. 5630-5645.
18. Ye X., Lin X., Dehmeshki J., et. al.: Shape-based computer-aided detection of lung nodules in thoracic CT images. IEEE Trans Biomed Eng 2009; 56: pp. 1810-1820.
19. Harrison L.H., Flye M.W., Seigler H.F.: Incidence of anatomical variants in renal vasculature in the presence of normal renal function. Ann Surg 1978; 188: pp. 83-89.
20. Stacul F., van der Molen A.J., Reimer P., et. al.: Contrast induced nephropathy: updated ESUR Contrast Media Safety Committee guidelines. European radiology 2011; 21: pp. 2527-2541.