
Rationale and Objectives
The study aimed to compare the breast density estimates from two algorithms on full-field digital mammography (FFDM) and digital breast tomosynthesis (DBT) and to analyze the clinical implications.
Materials and Methods
We selected 561 FFDM and DBT examinations from patients without breast pathologies. Two versions of a commercial software (Quantra 2D and Quantra 3D) calculated the volumetric breast density automatically in FFDM and DBT, respectively. Other parameters such as area breast density and total breast volume were evaluated. We compared the results from both algorithms using the Mann-Whitney U non-parametric test and the Spearman’s rank coefficient for data correlation analysis. Mean glandular dose (MGD) was calculated following the methodology proposed by Dance et al.
Results
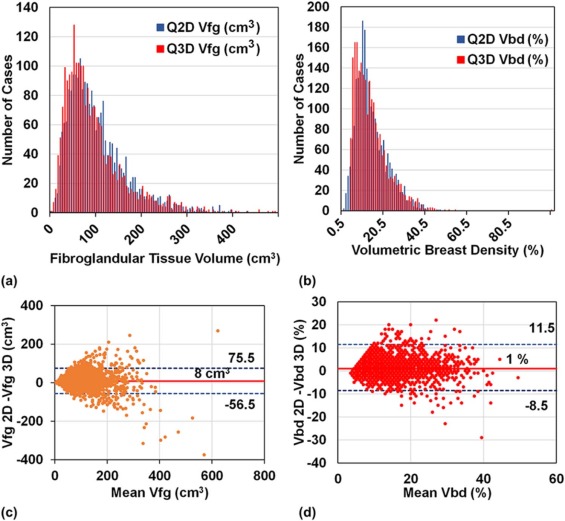
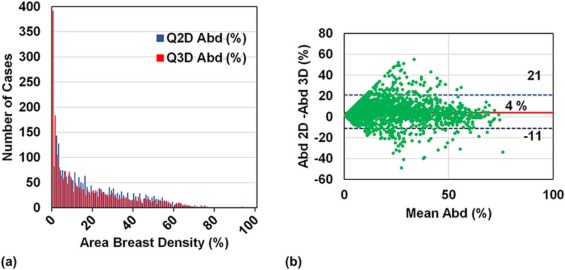
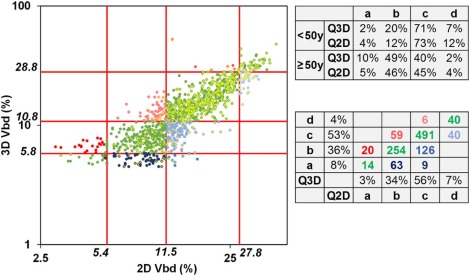
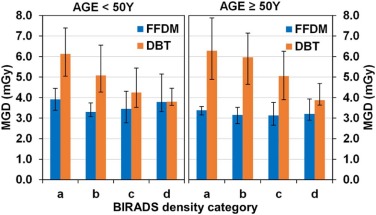
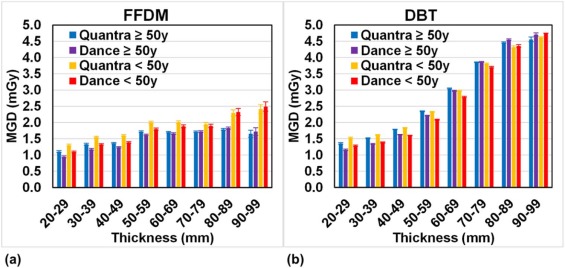
Measurements with both algorithms are well correlated (r ≥ 0.77). However, there are statistically significant differences between the medians ( P < 0.05) of most parameters. The volumetric and area breast density median values from FFDM are, respectively, 8% and 77% higher than DBT estimations. Both algorithms classify 35% and 55% of breasts into BIRADS (Breast Imaging-Reporting and Data System) b and c categories, respectively. There are no significant differences between the MGD calculated using the breast density from each algorithm. DBT delivers higher MGD than FFDM, with a lower difference (5%) for breasts in the BIRADS d category. MGD is, on average, 6% higher than values obtained with the breast glandularity proposed by Dance et al.
Conclusions
Breast density measurements from both algorithms lead to equivalent BIRADS classification and MGD values, hence showing no difference in clinical outcomes. The median MGD values of FFDM and DBT examinations are similar for dense breasts (BIRADS d category).
Introduction
Millions of women undergo breast cancer screening with full-field digital mammography (FFDM) every year. The assessment of breast density has been an important component of mammography screening reports that provides information on mammographic sensitivity and relative risk of breast cancer. Recently, legislation in several US states requires that patients be informed about breast density and the potential for decreased mammographic sensitivity and increased cancer risk . Lately, digital breast tomosynthesis (DBT) has been proposed as an imaging modality to overcome the limitations of the conventional mammography regarding thicker or dense breasts. The inclusion of DBT as a screening tool is currently under debate , and the higher dose delivered in DBT with respect to digital mammography is a matter of great concern .
The breast is one of the most radiosensitive organs, and the estimation of radiation dose delivered to breast tissue is critical in screening programs. It is generally assumed that glandular tissue is the most radiosensitive component in the breast, with adipose tissue presenting a minimal risk of cancer development . Therefore, the mean dose delivered to the glandular tissue within the breast has been established as the standard risk metric in mammographic examinations . Because of the intricacy of having reliable information about breast glandular distribution, the mean glandular dose (MGD) was estimated for a long time by assuming in all patients a breast tissue composition of 50% fibroglandular (or dense) and 50% adipose.
Get Radiology Tree app to read full this article<
Get Radiology Tree app to read full this article<
Get Radiology Tree app to read full this article<
Get Radiology Tree app to read full this article<
Materials and Methods
Image Acquisition
Get Radiology Tree app to read full this article<
Study Population
Get Radiology Tree app to read full this article<
Breast Density Estimations
Get Radiology Tree app to read full this article<
Get Radiology Tree app to read full this article<
Get Radiology Tree app to read full this article<
Get Radiology Tree app to read full this article<
Get Radiology Tree app to read full this article<
Get Radiology Tree app to read full this article<
Get Radiology Tree app to read full this article<
Dosimetric Calculations
Get Radiology Tree app to read full this article<
Get Radiology Tree app to read full this article<
Statistical Analysis
Get Radiology Tree app to read full this article<
Get Radiology Tree app to read full this article<
Results
Breast Density Per Image and Per Breast
Get Radiology Tree app to read full this article<
Get Radiology Tree app to read full this article<
TABLE 1
Summary of Results of All Women in the Study
Per image Per breast Cases (n) 2244 1122 Quantra 2D Quantra 3D Spearman Coefficient (p value) Quantra 2D Quantra 3D Spearman coefficient (p value) Median (Q1-Q3) Median (Q1-Q3) Total breast volume 667 670 0.997 664 666 1.0 (Vb) (cm3) (432–1037) (433–1027) (<0.001) (442–1029) (447–1034) (<0.001) Fibroglandular tissue 91 77 0.82 91 79 0.89 volume (Vfg) (cm3) (59–136) (50–120) (<0.001) (61–134) (52–116) (<0.001) Volumetric breast 13 12 0.77 13 12 0.84 density (Vbd) (%) (10–19) (8–17) (<0.001) (10–19) (8–17) (<0.001) Area breast density 16 9 0.82 16 11 0.88 (Abd) (%) (0.1–78) (0–93) (<0.001) (7–33) (3–26) (<0.001)
For each parameter, the first row denotes the median values, with the first (Q1) and third (Q3) quartiles within parentheses. The second row numbers are Spearman coefficients for the correlation between Quantra 2D and Quantra 3D. P values for the Spearman correlation with a confidence level of 99.999%.
Get Radiology Tree app to read full this article<
Get Radiology Tree app to read full this article<
Get Radiology Tree app to read full this article<
Get Radiology Tree app to read full this article<
Get Radiology Tree app to read full this article<
Get Radiology Tree app to read full this article<
Get Radiology Tree app to read full this article<
Left and Right Breast Density Comparison
Get Radiology Tree app to read full this article<
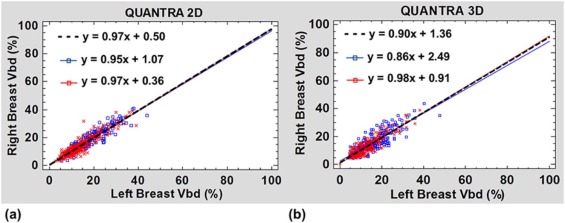
Get Radiology Tree app to read full this article<
Dependence of Breast Density Estimates on Age and Breast Thickness
Get Radiology Tree app to read full this article<
TABLE 2
Median Values of Per-Image Volumetric Breast Density and Per-Image Area Breast Density Estimated with Quantra 2D and Quantra 3D Algorithms for the Whole Sample and for Women Aged <50 Years and ≥50 Years
Age Group Q2D Vbd (%) Q3D Vbd (%) Q2D Abd (%) Q3D Abd (%) Dance Glandularity (%) All women 13(10–19) 12(8–17) 16(6–33) 9(1–27) 30(17–48) 50–60 mm 14.5 ± 0.3 13.3 ± 0.3 20.0 ± 0.6 14.6 ± 0.6 33.9 ± 0.4 <50 years 17(13–23) 15(11–21) 28(15–43) 20(7–43) 47(34–60) 50–60 mm 16.2 ± 0.4 15.1 ± 0.5 25 ± 1 18 ± 1 43.1 ± 0.2 ≥50 years 12(9–15) 10(7–15) 11(4–23) 5(1–17) 21(13–33) 50–60 mm 13.0 ± 0.3 11.9 ± 0.4 16.4 ± 0.7 11.9 ± 0.8 27.2 ± 0.2
Abd, area breast density; Q2D, Quantra 2D; Q3D, Quantra 3D; Vbd, volumetric breast density.
Breast density values for women with the most frequent thickness are the average(50–60 mm) ± 1 sem (standard error of the mean). The last column shows the median values for the Dance glandularity. Values in parentheses are the first and third quartiles.
Get Radiology Tree app to read full this article<
Get Radiology Tree app to read full this article<
Get Radiology Tree app to read full this article<
Get Radiology Tree app to read full this article<
2D and 3D Breast Density: BIRADS Categories
Get Radiology Tree app to read full this article<
Get Radiology Tree app to read full this article<
MGD
Get Radiology Tree app to read full this article<
Get Radiology Tree app to read full this article<
Get Radiology Tree app to read full this article<
Get Radiology Tree app to read full this article<
Get Radiology Tree app to read full this article<
Get Radiology Tree app to read full this article<
Get Radiology Tree app to read full this article<
Discussion
Get Radiology Tree app to read full this article<
Get Radiology Tree app to read full this article<
Get Radiology Tree app to read full this article<
Get Radiology Tree app to read full this article<
Get Radiology Tree app to read full this article<
Get Radiology Tree app to read full this article<
Get Radiology Tree app to read full this article<
Get Radiology Tree app to read full this article<
Get Radiology Tree app to read full this article<
Conclusions
Get Radiology Tree app to read full this article<
Get Radiology Tree app to read full this article<
Get Radiology Tree app to read full this article<
Acknowledgments
Get Radiology Tree app to read full this article<
References
1. Lee C.I., Bassett L.W., Lehman C.D.: Breast density legislation and opportunities for patient-centered outcomes research. Radiology 2012; 264: pp. 632-636.
2. Skaane P.: Chapter 2: breast cancer screening with digital breast tomosynthesis.Tagliafico A.Houssami N.Calabrese M.Digital breast tomosynthesis a practical approach.2016.Springer International PublishingSwitzerland:pp. 11-28.
3. Svahn T.M., Houssami N., Sechopoulos I., et. al.: Review of radiation dose estimates in digital breast tomosynthesis relative to those in two-view full-field digital mammography. Breast 2015; 24: pp. 93-99.
4. Garayoa J., Hernandez-Giron I., Castillo M., et. al.: Digital breast tomosynthesis: image quality and dose saving of the synthesized image.Fujita H.Hara T.Muramatsu C.Proceedings of the 12th International Workshop on Digital Mammography.2014.Springer International PublishingSwitzerland:pp. 150-157.
5. Rodríguez-Ruiz A., Castillo M., Garayoa J., et. al.: Evaluation of the technical performance of three different commercial digital breast tomosynthesis systems in the clinical environment. Phys Med 2016; 32: pp. 767-777.
6. Hammerstein G.R., Miller D.W., White D.R., et. al.: Absorbed radiation dose in mammography. Radiology 1979; 130: pp. 485-491.
7. ICRU—International Commission on Radiation Units and Measurements : Mammography—assessment of image quality. Report 82, Bethesda.2009.
8. Geise R.A., Palchevsky A.: Composition of mammographic phantom materials. Radiology 1996; 198: pp. 347-350.
9. Young K.C., Ramsdale M.L., Bignall F.: Review of dosimetric methods for mammography in the UK breast screening programme. Radiat Prot Dosimetry 1998; 80: pp. 183-186.
10. Klein R., Aichinger H., Dierker J., et. al.: Determination of average glandular dose with modern mammography units for two large groups of patients. Phys Med Biol 1997; 42: pp. 651-671.
11. Beckett J., Kotre C.J.: Dosimetric implications of age related glandular changes in screening mammography. Phys Med Biol 2000; 45: pp. 801-813.
12. Dance D.R., Skinner C.L., Young K.C., et. al.: Additional factors for the estimation of mean glandular breast dose using the UK mammography dosimetry protocol. Phys Med Biol 2000; 45: pp. 3225-3240.
13. McCormack V.A., dos Santos Silva I.: Breast density and parenchymal patterns as markers of breast cancer risk: a meta-analysis. Cancer Epidemiol Biomarkers Prev 2006; 15: pp. 1159-1169.
14. Boyd N.F., Guo H., Martin L.J., et. al.: Mammographic density and the risk and detection of breast cancer. N Engl J Med 2007; 356: pp. 227-236.
15. Boyd N.F., Byng J.W., Jong R.A., et. al.: Quantitative classification of mammographic densities and breast cancer risk: results from the Canadian National Breast Screening Study. J Natl Cancer Inst 1995; 87: pp. 670-675.
16. Torres-Mejía G., De Stavola B., Allen D.S., et. al.: Mammographic features and subsequent risk of breast cancer: a comparison of qualitative and quantitative evaluations in the Guernsey prospective studies. Cancer Epidemiol Biomarkers Prev 2005; 14: pp. 1052-1059.
17. Wolfe J.N., Saftlas A.F., Salane M.: Mammographic parenchymal patterns and quantitative evaluation of mammographic densities: a case-control study. AJR Am J Roentgenol 1987; 148: pp. 1087-1092.
18. Huo Z., Giger M.L., Wolverton D.E., et. al.: Computerized analysis of mammographic parenchymal patterns for breast cancer risk assessment: feature selection. Med Phys 2000; 27: pp. 4-12.
19. Alonzo-Proulx O., Jong R., Yaffe M.: Volumetric breast density characteristics as determined from digital mammograms. Phys Med Biol 2012; 57: pp. 7443.
20. Van Engeland S., Snoeren P.R., Huisman H., et. al.: Volumetric breast density estimation from full-field digital mammograms. IEEE Trans Med Imaging 2006; 25: pp. 273-282.
21. Pawluczyk O., Augustine B.J., Yaffe M.J., et. al.: A volumetric method for estimation of breast density on digitized screen-film mammograms. Med Phys 2003; 30: pp. 352-364.
22. Yaffe M.J.: Mammographic density. Measurement of mammographic density. Breast Cancer Res 2008; 10: pp. 209.
23. Ekpo E.U., McEntee M.F.: Measurement of breast density with digital breast tomosynthesis—a systematic review. Br J Radiol 2015; 87: pp. 1043.
24. Yaffe M.J., Boone J.M., Packard N., et. al.: The myth of the 50-50 breast. Med Phys 2009; 36: pp. 5437-5443.
25. Hartman K., Highnam R., Warren R., et. al.: Volumetric assessment of breast tissue composition from FFDM images.Krupinsky E.Digital Mammography. Proceedings of 9th International Workshop.2008.Springer International PublishingSwitzerland:pp. 33-39.
26. Highnam R., Brady M., Yaffe M.J., et. al.: Robust breast composition measurement—Volpara.Martí J.Oliver A.Freixenet J. et. al.Digital Mammography. Proceedings of 10th International Workshop.2010.Springer International PublishingSwitzerland:pp. 342-349.
27. Ren B.R., Smith A., Jing Z.X.: Measurement of breast density with digital breast tomosynthesis.Pelc N.J.Nishikawa R.M.Whiting B.R.SPIE Proceedings Vol. 8313: Medical Imaging 2012: Physics of Medical Imaging.2012. Bellingham, WA; 831340Q1-6
28. Dance D.R., Young K.C., van Engen R.E.: Further factors for the estimation of mean glandular dose using the United Kingdom, European and IAEA dosimetry protocols. Phys Med Biol 2009; 54: pp. 4361-4372.
29. Dance D.R., Young K.C., van Engen R.E.: Estimation of mean glandular dose for breast tomosynthesis: factors for use with the UK, European and IAEA breast dosimetry protocols. Phys Med Biol 2011; 56: pp. 453-471.
30. Understanding Quantra™ 2.0.User Manual Hologic Inc : MAN-02004 Rev 004. Bedford, MA: Hologic, Inc2012.
31. D’Orsi C.J., Sickles E.A., Mendelson E.B., et. al.: Breast imaging reporting and data system: ACR 81-RADS atlas.2013.American College of RadiologyResten, VA
32. Food and Drug Administration : Document K142037. Available at: https://www.accessdata.fda.gov/cdrh_docs/pdf14/K142037.pdf Accessed July 2016
33. Østerås B.H., Martinsen A.C., Brandal S.H., et. al.: BI-RADS density classification from areometric and volumetric automatic breast density measurements. Acad Radiol 2016; 23: pp. 468-478.
34. Wang J., Azziz A., Fan B., et. al.: Agreement of mammographic measures of volumetric breast density to MRI. PLoS ONE 2013; 8: pp. e81653.
35. Tagliafico A., Tagliafico G., Astengo D., et. al.: Mammographic density estimation: one-to-one comparison of digital mammography and digital breast tomosynthesis using fully automated software. Eur Radiol 2012; 22: pp. 1265-1270.
36. Winkler N.S., Raza S., Mackesy M., et. al.: Breast density: clinical implications and assessment methods. Radiographics 2015; 35: pp. 316-324.
37. Gilbert F., Tucker L., Gillan M.G.C., et. al.: TOMMY trial: a comparison of tomosynthesis with digital mammography in the UK NHS Breast Screening Programme. Health Technol Assess 2015; 19: pp. i-xxv. 1–136 http://dx.doi.org/10.3310/hta19040
38. Morrish O.W., Tucker L., Black R., et. al.: Mammographic breast density: comparison of methods for quantitative evaluation. Radiology 2015; 275: pp. 356-365.
39. Ciatto S., Bernardi D., Calabrese M., et. al.: A first evaluation of breast radiological density assessment by QUANTRA software as compared to visual classification. Breast 2012; 21: pp. 503-506.
40. Weigel S., Heindel W., Heidrich J., et. al.: Digital mammography screening: sensitivity of the programme dependent on breast density. Eur Radiol 2016; 07 November 2016; Epub ahead of print
41. Berg W.A.: Tailored supplemental screening for breast cancer: what now and what next?. AJR Am J Roentgenol 2009; 192: pp. 390-399.
42. Melnikow J., Fenton J.J., Whitlock E.P., et. al.: Supplemental screening for breast cancer in women with dense breasts: a systematic review for the U.S. preventive services task force. Ann Intern Med 2016; 164: pp. 268-278.
43. Tagliafico A., Calabrese M., Mariscotti G., et. al.: Adjunct screening with tomosynthesis or ultrasound in women with mammography-negative dense breasts: interim report of a prospective comparative trial. J Clin Oncol 2016; 34: pp. 1882-1888.
44. Skaane P., Bandos A.I., Eben E., et. al.: Two-view digital breast tomosynthesis screening with synthetically reconstructed projection images: comparison with digital breast tomosynthesis with full-field digital mammographic images. Radiology 2014; 271: pp. 655-663.