
Rationale and Objectives
Reported error rates for initial clinical diagnosis of idiopathic Parkinson’s disease (IPD) against other Parkinson Plus Syndromes (PPS) can reach up to 35%. Reducing this initial error rate is an important research goal. We evaluated the ability of an automated technique, based on structural, cross-sectional T1-weighted (T1w) magnetic resonance imaging, to perform differential classification of IPD patients versus those with either progressive supranuclear palsy (PSP) or multiple systems atrophy (MSA).
Materials and Methods
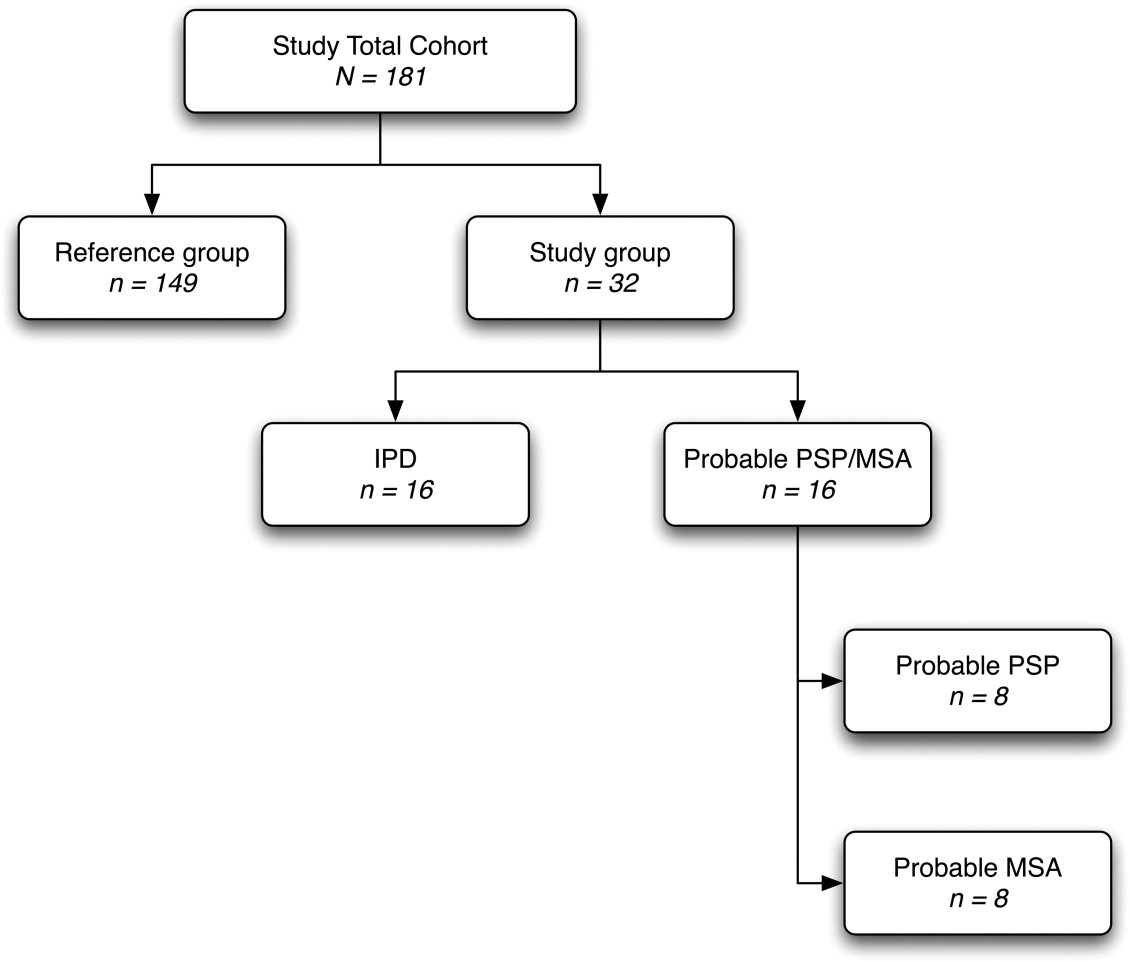
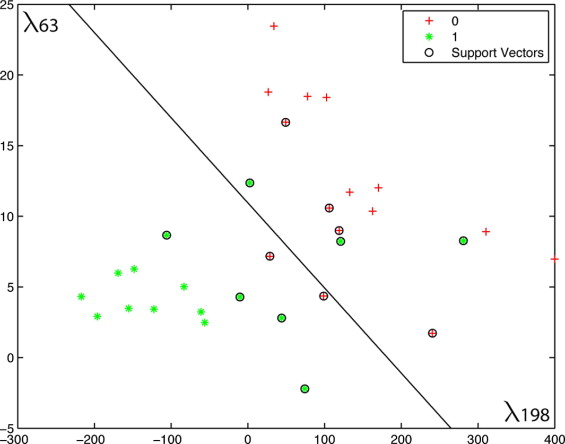
A total of 181 subjects were included in this retrospective study: 149 healthy controls, 16 IPD patients, and 16 patients diagnosed with either probable PSP ( n = 8) or MSA ( n = 8). Cross-sectional T1w magnetic resonance imagers were acquired and subsequently corrected, scaled, resampled, and aligned within a common referential space. Tissue composition and deformation features in the hindbrain region were then automatically extracted. Classification of patients was performed using a support vector machine with least-squares optimization within a multidimensional composition/deformation feature space built from the healthy subjects’ data. Leave-one-out classification was used to avoid over-determination.
Results
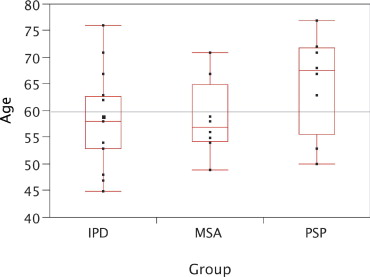
There were no age difference between groups. The automated system obtained 91% accuracy (agreement with long-term clinical follow-up), 88% specificity, and 93% sensitivity.
Conclusion
These results demonstrate that a classification approach based on quantitative parameters of three-dimensional hindbrain morphology extracted automatically from T1w magnetic resonance imaging has the potential to assist in the differential diagnosis of IPD versus PSP and MSA with high accuracy, therefore reducing the initial clinical error rate.
Multiple systems atrophy (MSA) and progressive supranuclear palsy (PSP) represent, when combined, the second most prevalent cause of degenerative parkinsonian syndromes, after idiopathic Parkinsons’ disease (IPD) ( ). Classified as Parkinsonian Plus Syndromes (PPS), these diseases primarily affect middle-aged adults with a maximum incidence at 55 years of age and a male/female ratio of 1.5 to 1 ( ).
It is difficult to differentiate PSP and MSA clinically in early stages from IPD. Clinical diagnosis is established on the basis of criteria from Gilman et al. ( ) for MSA and from Litvan et al. ( ) for PSP. Patients with MSA exhibit autonomic failure and cerebellar and pyramidal involvement. Clinical symptoms of PSP include oculomotor abnormalities, early falls, pyramidal symptoms, and frontal lobe dysfunction. Early diagnosis is crucial, as dissimilar therapy choices must be pursued depending on status. The situation is worsened by the fact that the disease course in PPS is more rapid than IPD, with lower median survival (6 vs. 18 years in IPD).
Get Radiology Tree app to read full this article<
Get Radiology Tree app to read full this article<
Get Radiology Tree app to read full this article<
 Open full size image
Figure 1
Mesencephalon atrophy in probable progressive supranuclear palsy (PSP) on sagittal T1-weighted images. (a) Absent, (b) moderate, and (c) Severe.
 Open full size image
Figure 2
Pontine atrophy, cerebellar atrophy, and enlargement of the fourth ventricle in probable multiple systems atrophy (MSA) on sagittal T1-weighted images. (a) Absent, (b) moderate, and (c) severe.
Get Radiology Tree app to read full this article<
Get Radiology Tree app to read full this article<
Get Radiology Tree app to read full this article<
Get Radiology Tree app to read full this article<
 Open full size image
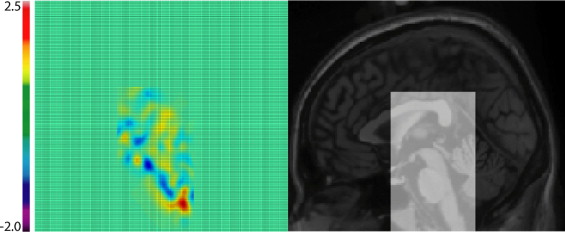
Figure 3
Prior to feature extraction, the original image ( top left ) is globally and locally aligned with the target volume of interest (VOI) ( bottom left ); the intensity is then corrected, scaled, and clamped. The resulting image ( top right ) is used as a measure of tissue composition. The determinant of the nonlinear registration field mapping the tissue composition image to the target image is then computed as a measure of tissue deformations. When the change is near zero in the neighborhood of x (in light blue/green ) the deformation is incompressible and there is no volume change. However, if the determinant is positive (towards yellow/red ), the volume increases, whereas when negative (towards dark blue ), the volume decreases after the deformation. The red arrows show corresponding areas of mesencephalon and cerebellar atrophy in this particular patient.
Get Radiology Tree app to read full this article<
Get Radiology Tree app to read full this article<
Get Radiology Tree app to read full this article<
 Open full size image
Figure 4
Views through the common target image and the volume of interest (VOI) for this study. The target is a high-contrast, high-resolution average of 27 T1-weighted magnetic resonance imaging scans of the same subject ( ). The VOI measures n = 90 × 90 × 50 = 405,000 voxels and captures structures (eg, pons, mesencephalon) irrespective of normal interindividual variability.
Get Radiology Tree app to read full this article<
Get Radiology Tree app to read full this article<
Get Radiology Tree app to read full this article<
Get Radiology Tree app to read full this article<
Materials and methods
Ethics
Get Radiology Tree app to read full this article<
Study Type
Get Radiology Tree app to read full this article<
Get Radiology Tree app to read full this article<
Subjects
Get Radiology Tree app to read full this article<
Get Radiology Tree app to read full this article<
Get Radiology Tree app to read full this article<
Get Radiology Tree app to read full this article<
Clinical Diagnosis
Get Radiology Tree app to read full this article<
Get Radiology Tree app to read full this article<
Image Data
Get Radiology Tree app to read full this article<
Image Processing
Get Radiology Tree app to read full this article<
Get Radiology Tree app to read full this article<
Automated Classification and Statistical Analysis
Get Radiology Tree app to read full this article<
Get Radiology Tree app to read full this article<
Get Radiology Tree app to read full this article<
Get Radiology Tree app to read full this article<
Get Radiology Tree app to read full this article<
Get Radiology Tree app to read full this article<
Get Radiology Tree app to read full this article<
Results
Demographics
Get Radiology Tree app to read full this article<
Group-level Distributions
Get Radiology Tree app to read full this article<
Automated Computer Classification
Get Radiology Tree app to read full this article<
Get Radiology Tree app to read full this article<
Get Radiology Tree app to read full this article<
Get Radiology Tree app to read full this article<
Discussion
Clinical Considerations
Get Radiology Tree app to read full this article<
Get Radiology Tree app to read full this article<
Get Radiology Tree app to read full this article<
Get Radiology Tree app to read full this article<
Get Radiology Tree app to read full this article<
Methodologic Considerations
Get Radiology Tree app to read full this article<
Get Radiology Tree app to read full this article<
Study Limitations
Get Radiology Tree app to read full this article<
Get Radiology Tree app to read full this article<
Get Radiology Tree app to read full this article<
Conclusion
Get Radiology Tree app to read full this article<
Acknowledgments
Get Radiology Tree app to read full this article<
Get Radiology Tree app to read full this article<
Get Radiology Tree app to read full this article<
References
1. Schrag A.Y., Ben-Shlomoy , Quinn N.P.: Prevalence of progressive supranuclear palsy and multiple system atrophy: a cross-sectional study. Lancet 1999; 354: pp. 1771-1775.
2. de Rijk M.C., Tzourio C., Breteler M.M., et. al.: Prevalence of parkinsonism and Parkinson’s disease in Europe: the EUROPARKINSON Collaborative Study. J Neurol Neurosurg Psychiatry 1997; 62: pp. 10-15.
3. Gilman S., Low P., Quinn N., et. al.: Consensus statement on the diagnosis of multiple system atrophy. Clin Auton Res 1998; 8: pp. 359-362.
4. Litvan I., Agid Y., Calne D., et. al.: Clinical research criteria for the diagnosis of progressive supranuclear palsy (Steele-Richardson-Olszewski syndrome): report of the NINDS-SPSP international workshop. Neurology 1996; 47: pp. 1-9.
5. Papp M.I., Lantos P.L.: The distribution of oligodendroglial inclusions in multiple system atrophy and its relevance to clinical symptomatology. Brain 1994; 117: pp. 235-243.
6. Costa C., Duyckaerts C.: Oligodendroglial and neuronal inclusions in multiple system atrophy. Curr Opin Neurol 1993; 6: pp. 865-871.
7. Hauw J.J., Verny M., Delaere P., et. al.: Constant neurofibrillary changes in the neocortex in progressive supranuclear palsy. Neurosci Lett 1990; 119: pp. 182-186.
8. Tolosa E., Wenning G., Poewe W.: The diagnosis of Parkinson’s disease. Lancet Neurol 2006; 5: pp. 75-86.
9. Schrag A., Good C.D., Miszkiel K., et. al.: Differentiation of atypical Parkinsonian syndromes with routine MRI. Neurology 2000; 54: pp. 697-702.
10. Yagishita A., Oda M.: Progressive supranuclear palsy: MRI and pathological findings. Neuroradiology 1996; 38: S60–S6
11. Seppi K., Schocke M.F., Wenning G.K., et. al.: How to diagnose MSA early: the role of magnetic resonance imaging. J Neural Transm 2005; 112: pp. 1625-1634.
12. Kato N., Arai K., Hattori T.: Study of the rostral midbrain atrophy in progressive supranuclear palsy. J Neurol Sci 2003; 210: pp. 57-60.
13. Nicoletti G., Fera F., Condino F., et. al.: MR imaging of middle cerebellar peduncle width: differentiation of multiple system atrophy from Parkinson disease. Radiology 2006; 239: pp. 825-830.
14. Schulz J.B., Skalej M., Wedekind D., et. al.: Magnetic resonance imaging-based volumetry differentiates idiopathic Parkinson’s syndrome from multiple system atrophy and progressive supranuclear palsy. Ann Neurol 1999; 45: pp. 65-74.
15. Pruessner J.C., Li L.M., Serles W., et. al.: Volumetry of hippocampus and amygdala with high-resolution MRI and three-dimensional analysis software: minimizing the discrepancies between laboratories. Cerebral Cortex 2000; 10: pp. 433-442.
16. Minnerop M., Specht K., Ruhlmann J., et. al.: Voxel-based morphometry and voxel-based relaxometry in multiple system atrophy—a comparison between clinical subtypes and correlations with clinical parameters. Neuroimage 2007; 36: pp. 1086-1095.
17. Brenneis C., Egger K., Sherfler C., et. al.: Progression of brain atrophy in multiple system atrophy. J Neurol 2007; 254: pp. 191-196.
18. Hauser T.K., Luft A., Skalej M., et. al.: Visualization and quantification of disease progression in multiple system atrophy. Mov Disord 2006; 21: pp. 1674-1681.
19. Josephs K.A., Whitwell J.L., Dickson D.W., et. al.: Voxel-based morphometry in autopsy proven PSP and CBD. Neurobiol Aging 2006; 29: pp. 280-289.
20. Price S., Paviour D., Scahill R., et. al.: Voxel-based morphometry detects patterns of atrophy that help differentiate progressive supranuclear palsy and Parkinson’s disease. Neuroimage 2004; 23: pp. 663-669.
21. Brenneis C., Seppi K., Schocke M., et. al.: Voxel based morphometry reveals a distinct pattern of frontal atrophy in progressive supranuclear palsy. J Neurol Neurosurg Psychiatry 2004; 75: pp. 246-249.
22. Thirion J.P., Calmon G.: Deformation analysis to detect and quantify active lesions in three-dimensional medical image sequences. IEEE Trans Med Imaging 1999; 18: pp. 429-441.
23. Duchesne S., Caroli A., Geroldi C., et. al.: MRI-based automated computer classification of probable AD versus normal controls. IEEE Trans Med Imaging 2008; 27: pp. 509-520.
24. Duchesne S., Bernasconi N., Bernasconi A., et. al.: MR-based neurological disease classification methodology: Application to lateralization of seizure focus in temporal lobe epilepsy. Neuroimage 2006; 29: pp. 557-566.
25. Davatzikos C., Fan Y., Wu Y., et. al.: Detection of prodromal Alzheimer’s disease via pattern classification of MRI. Neurobiol Aging 2006; 29: pp. 514-523.
26. Liu Y., Teverovskiy L., Carmichael O., et. al.: Discriminative MR Image Feature analysis for automatic schizophrenia and Alzheimer’s disease classification.Barillot C.Haynor D.R.Hellier P.Medical image computing and computer assisted intervention.2004.Springer-VerlagSaint-Malo, France:pp. 393-401.
27. Golland P., Grimson W.E., Shenton M.E., et. al.: Detection and analysis of statistical differences in anatomical shape. Med Image Anal 2005; 9: pp. 69-86.
28. Mazziotta J.C., Toga A.W., Evans A., et. al.: A probabilistic atlas of the human brain: theory and rationale for its development. Neuroimage 1995; 2: pp. 89-101.
29. Gibb W.R., Lees A.J.: The relevance of the Lewy body to the pathogenesis of idiopathic Parkinson’s disease. J Neurol Neurosurg Psychiatry 1988; 51: pp. 745-752.
30. Schwab R.S., England R.C.: Projection technique for evaluating surgery in Parkinson’s disease.Gillingham F.J.Donaldson I.M.L.Parkinson’s Disease.1969.E&S LivingstoneEdinburg, Scotland:pp. 152-157.
31. Hoehn M.M., Yahr M.D.: Parkinsonism: onset, progression and mortality. Neurology 1967; 17: pp. 427-442.
32. Sled J.G., Zijdenbos A.P., Evans A.C.: A nonparametric method for automatic correction of intensity nonuniformity in MRI data. IEEE Trans Med Imaging 1998; 17: pp. 87-97.
33. Collins D.L., Evans A.C.: ANIMAL: Validation and applications of non-linear registration based segmentation. Int J Pattern Recognition Artificial Intelligence 1997; 11: pp. 1271-1294.
34. Maes F., Collignon A., Vandermeulen D., et. al.: Multimodality image registration by maximization of mutual information. IEEE Trans Med Imaging 1997; 16: pp. 187-198.
35. Duda R.O., Hart P.E., Stork D.G.: Pattern Classification.2001.Wiley-InterscienceNew York
36. Duchesne S., Rolland Y., Verin M., et. al.: Computer aided differential diagnosis in movement disorders using MRI morphometry. SPIE Medical Imaging 2007;