
Rationale and Objectives
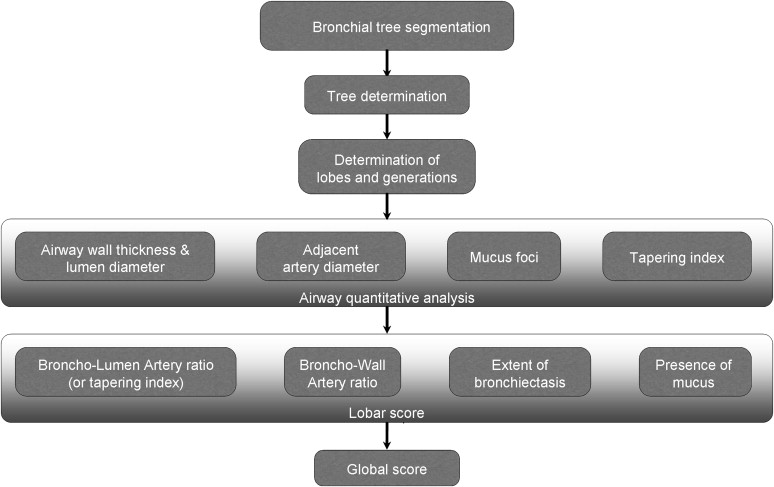
The aim of this study was to retrospectively evaluate an automated global scoring system for evaluating the extent and severity of disease in a known cohort of patients with documented bronchiectasis. On the basis of a combination of validated three-dimensional automated algorithms for bronchial tree extraction and quantitative airway measurements, global scoring combines the evaluation of bronchial lumen–to–artery ratios and bronchial wall–to–artery ratios, as well as the detection of mucoid-impacted airways. The result is an automatically generated global computed tomographic (CT) score designed to simplify and standardize the interpretation of scans in patients with chronic airway infections.
Materials and Methods
Twenty high-resolution CT data sets were used to evaluate an automated CT scoring method that combines algorithms for airway quantitative analysis that have been individually tested and validated. Patients with clinically documented atypical mycobacterial infections with visually assessed CT evidence of bronchiectasis varying from mild to severe were retrospectively selected. These data sets were evaluated by two independent experienced radiologists and by computer scoring, with the results compared statistically, including Spearman’s rank correlation.
Results
Computer evaluation required 3 to 5 minutes per data set, compared to 12 to 15 minutes for manual scoring. Initial Spearman’s rank tests showed positive correlations between automated and readers’ global scores ( r = 0.609, P = .01), extent of bronchiectasis ( r = 0.69, P = .0004), and severity of bronchiectasis ( r = 0.61, P = .01), while mucus plug detection showed a lesser extent of positive correlation between the scoring methods ( r = 0.42, P = .07) and wall thickness a negative weak correlation ( r = −0.10, P = .40). Further retrospective review of 24 lobes in which wall thickness scores showed the highest discrepancy between manual and automated methods was then performed, using electronic calipers and perpendicular cross-sections to reassess airway measurements. This resulted in an improved Spearman’s rank correlation to r = 0.62 ( P = .009), for a global score of r = 0.67 ( P = .001).
Conclusion
Automated computerized scoring shows considerable promise for providing a standardized, quantitative method, demonstrating overall good correlation with the results of experienced readers’ evaluation of the extent and severity of bronchiectasis. It is speculated that this technique may also be applicable to a wide range of other conditions associated with chronic bronchial inflammation, as well as of potential value for monitoring response to therapy in these same populations.
Visual computed tomographic (CT) scoring systems have been established for the assessment of airway disease in patients with bronchiectasis. Bhalla et al , in the most detailed method to date, used nine separate variables, including mucus plugging extent, peribronchial thickening, bronchial generations involved, number of bullae, and the presence of emphysema, plus a three-point severity scale, to create a 25-point global CT score. A number of modifications to this approach have subsequently been suggested . Generally, these modifications have encompassed differences in the definitions of bronchial dilatation, bronchial wall thickening, and disease extent as measured either by segments or lobes. Only some emphasize the presence of mucoid impaction and focal air trapping .
Despite these differences, to date, visual CT scoring systems have consistently shown good correlations with more traditional radiographic, clinical, and functional criteria . Roberts et al showed that the extent and severity of bronchial dilatation and bronchial wall thickening in patients with bronchiectasis were correlated with the severity of airflow obstruction and that decreased lung attenuation on expiratory scans had the best correlation ( r = −0.55, P < .00005). Similarly, Edwards et al showed a strong relationship between the extent of bronchiectasis, bronchial wall thickening, and air trapping on CT imaging with forced expiratory volume in 1 second and forced expiratory flow between 25% and 75% of forced vital capacity .
Get Radiology Tree app to read full this article<
Get Radiology Tree app to read full this article<
Get Radiology Tree app to read full this article<
Materials and methods
Study Design
Get Radiology Tree app to read full this article<
Scoring by Visual Inspection
Get Radiology Tree app to read full this article<
Table 1
Scoring Methodology per Lobe and Lingula by Sheehan et al
Feature Scoring Methodology per Lobe Extent of bronchial dilatation (0) No BP involved (1) One or partial BP segment involved (2) Two or more BP segments involved (3) Generalized CB Severity of bronchial dilatation (0) Normal (1) 1 < BLA ratio < 2 (2) BLA ratio ≥ 2 Severity of bronchial thickening (0) Normal (1) BWA ratio = 0.5 (2) 0.5 > BWA ratio > 1 (3) BWA > 1 Presence of mucous plug in large airways (0) None (1) Present Presence of mucous plug in small airways (0) None (1) Present Extent of decreased attenuation (0) Normal (1) <50% of lobar volume (2) ≥50% of lobar volume
BLA, bronchial lumen–to–artery; BP, bronchopulmonary; BWA, bronchial wall–to–artery; CB, cylindrical bronchiectasis.
Get Radiology Tree app to read full this article<
Automated Scoring
Get Radiology Tree app to read full this article<
Get Radiology Tree app to read full this article<
Get Radiology Tree app to read full this article<
Get Radiology Tree app to read full this article<
Get Radiology Tree app to read full this article<
Get Radiology Tree app to read full this article<
Get Radiology Tree app to read full this article<
Table 2
Scoring Method (Based on Sheehan et al’s Approach) Used by the Automated Method and Evaluated in the Experiment
Feature Scoring Methodology per Lobe Extent of bronchial dilatation (0) No BP involved (1) 0%–25% of bronchi with BLA ratio > 1 (2) 25%–50% of bronchi with BLA ratio > 1 (3) >50% of bronchi with BLA ratio > 1 Severity of bronchial dilatation (0) Normal (1) 1 < BLA ratio < 2 (2) BLA ratio ≥ 2 Severity of bronchial thickening (0) Normal (1) BWA ratio = 0.5 (2) 0.5 > BWA ratio > 1 (3) BWA > 1 Presence of mucous plug in any airway, large or small (0) None (1) Present
BLA, bronchial lumen–to–artery; BP, bronchopulmonary; BWA, bronchial wall–to–artery.
Get Radiology Tree app to read full this article<
Approach of Quantitative Analysis
Get Radiology Tree app to read full this article<
Get Radiology Tree app to read full this article<
Get Radiology Tree app to read full this article<
Get Radiology Tree app to read full this article<
Get Radiology Tree app to read full this article<
Statistical Analysis
Get Radiology Tree app to read full this article<
Get Radiology Tree app to read full this article<
Results
Get Radiology Tree app to read full this article<
Table 3
Bronchial Tree Extraction: Comparison Between Theoretical Numbers of Bronchi per Generation (Based on Boyden’s [33] Classification) and Numbers of Automatically Extracted Bronchi
Level Theoretical Number Automatically Segmented Sensitivity Trachea 20 20 100% Main bronchi 40 40 100% Lobar bronchi 100 98 100% Segmental 380 375 97.0% Subsegmental 860 799 88.4% Sub-subsegmental 1600 1458 71.4%
Get Radiology Tree app to read full this article<
Get Radiology Tree app to read full this article<
Get Radiology Tree app to read full this article<
Get Radiology Tree app to read full this article<
Get Radiology Tree app to read full this article<
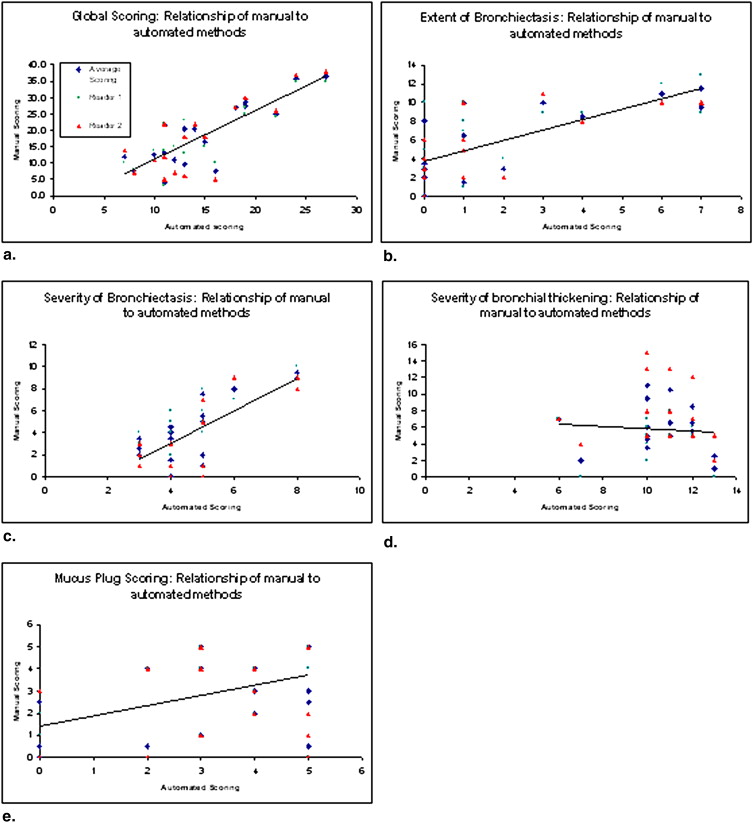
Table 4
Spearman’s Rank Correlation ( r ) and κ Values Between Patients’ Scores by Readers and Automated Approach
Computer vs Reader Average Computer vs Reader 1 Computer vs Reader 2 Reader 1 vs Reader 2 Feature_r_ κ_r_ κ_r_ κ_r_ κ Global score 0.6 ∗ 0.59 0.66 ∗ 0.62 0.57 ∗ 0.57 0.93 ∗ 0.93 Extent of bronchiectasis 0.69 ∗ 0.36 0.67 ∗ 0.31 0.72 ∗ 0.44 0.81 ∗ 0.82 Severity of bronchiectasis 0.61 ∗ 0.56 0.63 ∗ 0.61 0.55 ∗ 0.48 0.87 ∗ 0.79 BWA ratio −0.1 −0.03 −0.31 −0.03 −0.1 −0.03 0.65 ∗ 0.41 Mucus plugs 0.42 0.46 0.50 ∗ 0.53 0.31 0.33 0.75 ∗ 0.74
BWA, bronchial wall–to–artery.
Get Radiology Tree app to read full this article<
Get Radiology Tree app to read full this article<
Get Radiology Tree app to read full this article<
Get Radiology Tree app to read full this article<
Table 5
Scores on 24 Targeted Lobes with High Discrepancies Between Manual and Automated Scores
Variable RUL RML RLL LUL LLL All Number of lobes investigated 5 9 3 5 2 24 Mean score based on visual inspection 0.8 1.05 0.5 0.7 0.75 0.76 Mean score based on electronic calipers 2.6 2.8 2.6 2.8 3 2.79
LLL, left lower lobe; LUL, left upper lobe; RLL, right lower lobe; RML, right middle lobe; RUL, right upper lobe.
Scores were initially determined by visual inspection of routine axial slices and later evaluated with electronic calipers on true cross-sectional images.
Get Radiology Tree app to read full this article<
Get Radiology Tree app to read full this article<
Discussion
Get Radiology Tree app to read full this article<
Get Radiology Tree app to read full this article<
Get Radiology Tree app to read full this article<
Get Radiology Tree app to read full this article<
Get Radiology Tree app to read full this article<
Get Radiology Tree app to read full this article<
Get Radiology Tree app to read full this article<
Get Radiology Tree app to read full this article<
Get Radiology Tree app to read full this article<
Get Radiology Tree app to read full this article<
Get Radiology Tree app to read full this article<
Get Radiology Tree app to read full this article<
References
1. Bhalla M., Turcios N., Aponte V., et. al.: Cystic fibrosis: scoring system with thin-section CT. Radiology 1991; 179: pp. 783-788.
2. Cartier Y., Kavanagh P.V., Johkoh T., et. al.: Bronchiectasis: accuracy of high-resolution CT in the differentiation of specific diseases. AJR Am J Roentgenol 1999; 173: pp. 47-52.
3. Reiff D.B., Wells A.U., Carr D.H., et. al.: CT findings in bronchiectasis: limited value in distinguishing between idiopathic and specific types. AJR Am J Roentgenol 1995; 165: pp. 261-267.
4. Smith I.E., Jurriaans E., Diederich S., et. al.: Chronic sputum production: correlations between clinical features and findings on high resolution computed tomographic scanning of the chest. Thorax 1996; 51: pp. 914-918.
5. Shah R.M., Sexauer W., Ostrum B.J., et. al.: High-resolution CT in the acute exacerbation of cystic fibrosis: evaluation of acute findings, reversibility of those findings, and clinical correlation. AJR Am J Roentgenol 1997; 169: pp. 375-380.
6. Helbich T.H., Heinz-Peer G., Fleischmann D., et. al.: Evolution of CT findings in patients with cystic fibrosis. AJR Am J Roentgenol 1999; 173: pp. 81-88.
7. De Jong P.A., Ottink M.D., Robben S.G., et. al.: Pulmonary disease assessment in cystic fibrosis: comparison of CT scoring systems and value of bronchial and arterial dimension measurements. Radiology 2004; 231: pp. 434-439.
8. Maffessanti M., Candusso M., Brizzi F., et. al.: Cystic fibrosis in children: HRCT findings and distribution of disease. J Thorac Imag 1996; 11: pp. 27-38.
9. Helbich T.H., Heinz-Peer G., Eichler I., et. al.: Cystic fibrosis: CT assessment of lung involvement in children and adults. Radiology 1999; 213: pp. 537-544.
10. Roberts H.R., Wells A.U., Milne D.G., et. al.: Airflow obstruction in bronchiectasis: correlation between computed tomography features and pulmonary function tests. Thorax 2000; 55: pp. 198-204.
11. Edwards E.A., Metcalfe R., Milne D.G., et. al.: Retrospective review of children presenting with no cystic fibrosis bronchiectasis: HRCT features and clinical relationships. Pediatr Pulmonol 2003; 36: pp. 87-93.
12. Ooi G.C., Khong P.L., Chan-Yeung M., et. al.: High-resolution CT quantification of bronchiectasis: clinical and functional correlation. Radiology 2002; 225: pp. 663-672.
13. Berger P., Perot V., Desbarats P., et. al.: Airway wall thickness in cigarette smokers: quantitative thin-section CT assessment. Radiology 2005; 235: pp. 1055-1064.
14. Wiemker R., Blaffert T., Bulow T., et. al.: Automated assessment of bronchial lumen, wall thickness and bronchioarterial diameter ratio of the tracheobronchial tree using high-resolution CT. Comput Assist Radiol Surg 2004; 1268: pp. 967-972.
15. Venkatraman R., Raman R., Raman B., et. al.: Fully automated system for three-dimensional bronchial morphology analysis using volumetric multidetector computed tomography of the chest. J Digit Imaging 2006; 19: pp. 132-139.
16. Prasad M., Sowmya A., Wilson P.: Automatic detection of bronchial dilatation in HRCT lung images. J Digit Imaging 2008; 21: pp. 148-163.
17. Chabat F., Hu X., Hansell D., et. al.: ERS transform for the automated detection of bronchial abnormalities on CT of the lungs. IEEE Trans Med Imaging 2001; 20: pp. 942-952.
18. Sheehan R.E., Wells A.U., Copley S.J., et. al.: A comparison of serial computed tomography and functional change in bronchiectasis. Eur Respir J 2002; 20: pp. 581-587.
19. Kiraly A.P., Odry B.L., Godoy M.C., et. al.: Computer-aided diagnosis of the airways: beyond nodule detection. J Thorac Imaging 2008; 23: pp. 105-113.
20. Kiraly A.P., Higgins W.E., McLennan G., et. al.: 3D human airway segmentation methods for clinical virtual bronchoscopy. Acad Radiol 2002; 9: pp. 1153-1168.
21. Kiraly A.P., Higgins W.E.: Three-dimensional path planning for virtual bronchoscopy. IEEE Trans Med Imaging 2004; 23: pp. 1365-1379.
22. Fetita C.I., Preteux F., Beigelman-Aubry C., et. al.: Pulmonary airways: 3-D reconstruction from multislice CT and clinical investigation. IEEE Trans Med Imaging 2004; 23: pp. 1353-1364.
23. Kaftan J.N., Kiraly A.P., Naidich D.P., et. al.: A novel multipurpose tree and path matching algorithm with application to airway trees. Proc SPIE 2006; 6143: pp. 215-224.
24. Kiraly A.P., Reinhardt J.M., Hoffman E.A., et. al.: Virtual bronchoscopy for quantitative airway analysis. Proc SPIE 2005; 5746: pp. 369-383.
25. Amirav I., Krammer S.S., Grunstein M.M., et. al.: Assessment of methacholine-induced airway constriction by high-resolution cine computed tomography (HRCCT). J Appl Phys 1993; 75: pp. 2239-2250.
26. Kiraly AP, Odry BL, Naidich DP, et al. Bronchiectasis: a reader comparison against automated methods in assessing bronchial lumen and wall thickness. Presented at: Annual meeting of the Radiological Society of North America; Chicago, IL; November 2007.
27. Odry B.L., Kiraly A.P., Novak C.L., et. al.: Automated airway evaluation system for multi-slice computed tomography using airway lumen diameter, airway wall thickness and broncho-arterial ratio. Proc SPIE 2006; 6143: pp. 243-253.
28. Odry B.L., Kiraly A.P., Novak C.L., et. al.: An evaluation of automated broncho-arterial ratios for reliable assessment of bronchiectasis. Proc SPIE 2008; 6915: 69152M–1
29. Odry B.L., Guiliguian D., Kiraly A.P., et. al.: Automated detection of mucus plugs within bronchial tree in MSCT images. Proc SPIE 2007; 6511: 6511–10
30. McDonald J.H.: Handbook of biological statistics.2008.Sparky HouseBaltimore, MD
31. Zar J.H.: Biostatistical analysis.4th ed.1999.Prentice HallUpper Saddle River, NJ
32. Ramsey P.H.: Critical values for Spearman’s rank order correlation. J Educ Stat 1989; 14: pp. 245-253.
33. Boyden E.A.: Segmental anatomy of the lungs: a study of the patterns of the segmental bronchi and related pulmonary vessels.1955.McGraw-HillNew York
34. Naidich D.P., McCauley D.I., Khouri N.F., et. al.: Computed tomography of bronchiectasis. J Comput Assist Tomogr 1982; 6: pp. 437-444.
35. Joharjy I.A., Bashi S.A., Abdullah A.K.: Value of medium-thickness CT in the diagnosis of bronchiectasis. AJR Am J Roentgenol 1987; 149: pp. 1133-1137.
36. Cooke J.C., Currie D.C., Morgan M.P.: Role of computed tomography in the diagnosis of bronchiectasis. Thorax 1987; 42: pp. 272-277.
37. Silverman P.M., Godwin J.D.: CT/bronchographic correlations in bronchiectasis. J Comput Assist Tomogr 1987; 11: pp. 52-56.
38. Young K., Aspestrand F., Kolbenstvedt A.: High resolution CT and bronchography in the assessment of bronchiectasis. Acta Radiol 1991; 32: pp. 439-441.
39. McGuinness G., Naidich D.P., McAuley D.I.: Bronchiectasis: CT evaluation (pictorial essay). AJR Am J Roentgenol 1993; 160: pp. 253-259.
40. Kang E.Y., Miller R.R., Müller N.L.: Bronchiectasis: comparison of preoperative thin-section CT and pathologic findings in resected specimens. Radiology 1995; 195: pp. 649-654.
41. Kim J.S., Muller N.L., Park C.S., et. al.: Bronchoarterial ratio on thin section CT: comparison between high altitude and sea level. J Comput Assist Tomogr 1997; 21: pp. 306-311.
42. Diederich S., Jurriaans E., Flower C.D.R.: Interobserver variation in the diagnosis of bronchiectasis on high-resolution computed tomography. Eur Radiol 1996; 6: pp. 801-806.
43. Kim S.J., Im J.G., Kim I.O., et. al.: Normal bronchial and pulmonary arterial diameters measured by thin section CT. J Comput Assist Tomogr 1995; 19: pp. 365-369.
44. Lynch D.A., Neewell J.D., Tschomper B.A., et. al.: Uncomplicated asthma in adults: comparison of CT appearance of the lungs in asthmatic and healthy subjects. Radiology 1993; 188: pp. 829-833.