
Rationale and Objectives
Although the spiculation levels of breast mass boundaries are a primary sign of malignancy for masses detected on mammography, developing an automated computerized method to detect spiculation levels and quantitatively evaluating the performance of such a method is a difficult task. The objectives of this study were to (1) develop and test a new method to improve mass segmentation and detect mass boundary spiculation levels and (2) assess the performance of this method using a relatively large imaging data set.
Materials and Methods
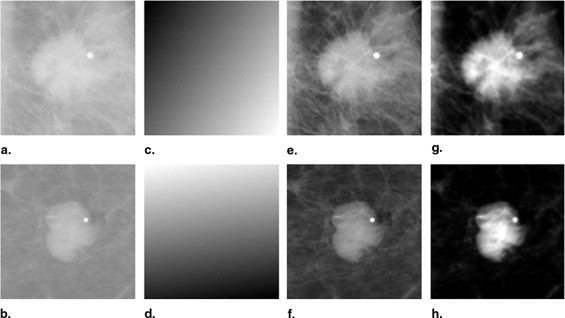
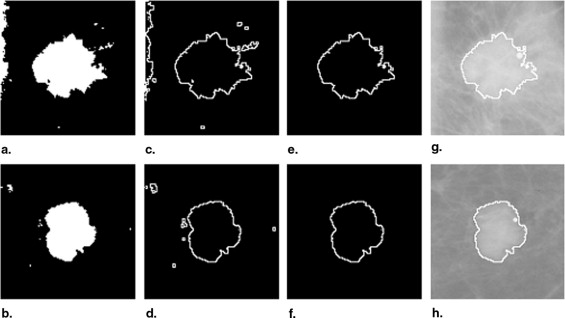
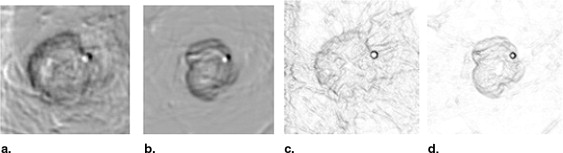
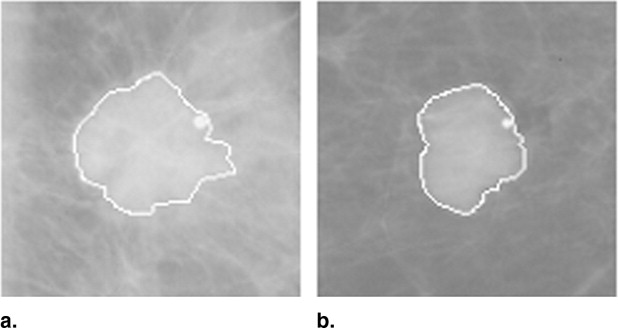
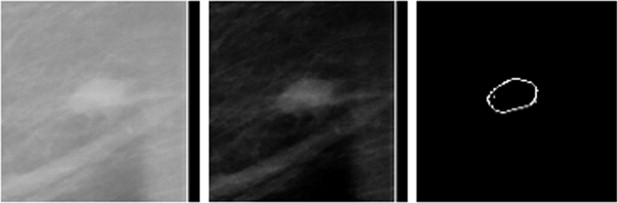
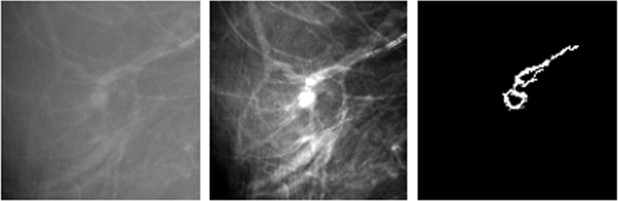
The fully automated method developed for this study includes three image-processing steps. In the first step, the principle of maximum entropy is applied in the selected region of interest (ROI) after correcting the background trend to enhance the initial outlines of a mass. In the second step, an active-contour model is used to refine the initial outlines. In the third step, spiculated lines connected to the mass boundary are detected and identified using a special line detector. A quantitative spiculation index is computed to assess the degree of spiculation. To develop and evaluate this automated method, 211 ROIs depicting masses were extracted from a publicly available image database. Among these ROIs, 106 depicted circumscribed mass regions and 105 involved spiculated mass regions. The performance of the method was evaluated using receiver-operating characteristic (ROC) analysis.
Results
The computed area under the ROC curve, when applying the method to the data set, was 0.701 ± 0.027. By setting up a threshold at a spiculation index of 5.0, the method achieved an overall classification accuracy of 66.4%, with 54.3% sensitivity and 78.3% specificity.
Conclusions
In this study, a new computerized method with a number of unique characteristics was developed to detect spiculated mass regions, and a simple spiculation index was applied to quantify mass spiculation levels. Although this quantitative index can be used to distinguish between spiculated and circumscribed masses, the results also suggest that the automated detection of mass spiculation levels remains a technical challenge.
Breast cancer is among the leading causes of death in women ( ). The early detection and treatment of breast cancer can substantially reduce patient mortality and morbidity ( ). For the early detection of breast cancer, mammography is widely used and is among the most reliable and cost-effective methods ( ). However, in the clinical environment, reading mammograms is a time-consuming and low-specificity task for most radiologists. To help improve radiologists’ reading efficiency and interpretation performance, a large number of computer-aided detection or computer-aided diagnosis (CAD) methods have been developed and tested ( ). Currently, commercialized CAD methods have achieved very high performance in detecting microcalcification clusters (eg, 98% sensitivity with 0.2 false-positive clusters per image [ ]), although their performance in mass detection remains relatively low ( ). As a result, using CAD has substantially improved radiologists’ performance and efficiency in detecting microcalcification clusters ( ). However, because of radiologists’ low confidence in CAD-cued masses, most CAD-cued false-negative masses are discarded as false-positive detections in the screening environment ( ).
A large number of studies have been conducted in an attempt to improve the performance of CAD in mass detection ( ). One approach focuses on improving mass segmentation accuracy and identifying effective image features. Previous studies have suggested that improving the accuracy of mass region segmentation could also significantly improve the performance of CAD in mass detection and characterization ( ). The segmentation of masses on original images is often difficult when the masses overlap with surrounding dense-tissue parenchyma. Several automated and semi-automated methods focusing on this problem have been developed ( ). These include using a density-weighted contrast enhancement algorithm that combines adaptive filtering and edge detection ( ), an adaptive multilayer topographic regional growth algorithm ( ), a gray-level–based iterative and linear segmentation algorithm ( ), a dynamic programming approach ( ), and dynamic contour modeling ( ) to segment mass lesions from surrounding breast tissue.
Get Radiology Tree app to read full this article<
Get Radiology Tree app to read full this article<
Get Radiology Tree app to read full this article<
Materials and methods
Selection of Image Data Set
Get Radiology Tree app to read full this article<
Get Radiology Tree app to read full this article<
Get Radiology Tree app to read full this article<
Table 1
Detailed Description of the Selected Image Data Set
Digitizer Circumscribed Masses Spiculated Masses Lumisys 70 44 Howtek 36 61 Total 106 105
Table 2
Distribution of BI-RADS Assessments of Breast Tissue Composition for All Selected Cases in the Data Set
BI-RADS Rating ⁎ Mass 1 2 3 4 Circumscribed 13 37 18 4 Spiculated 8 32 19 13 Total 21 69 37 17
BI-RADS, Breast Imaging Reporting and Data System.
Get Radiology Tree app to read full this article<
Get Radiology Tree app to read full this article<
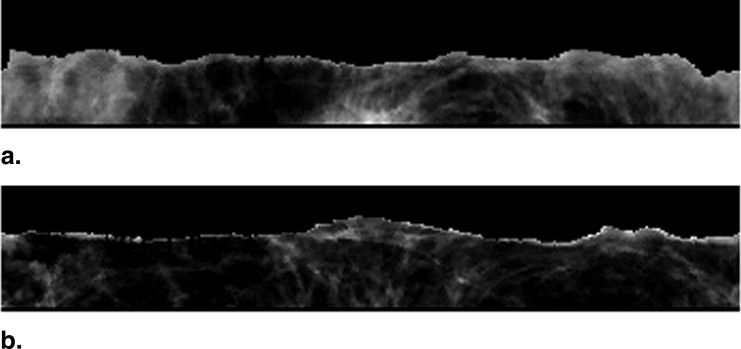
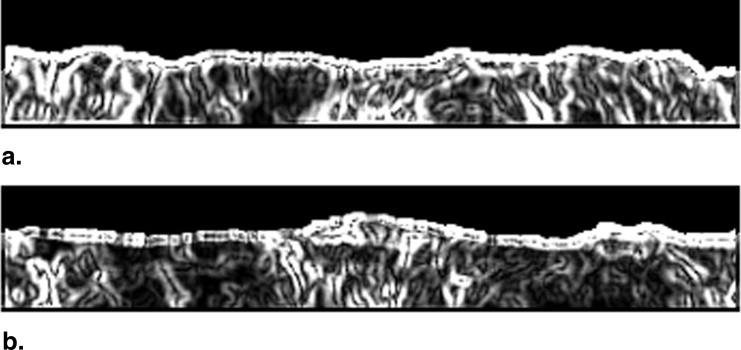
Correction of Background Trend in ROIs
Get Radiology Tree app to read full this article<
Get Radiology Tree app to read full this article<
Segmentation of Mass Region
Get Radiology Tree app to read full this article<
Step 1: Initial segmentation using the principle of maximum entropy
Get Radiology Tree app to read full this article<
H(Y)=−∑N1P(Y=yi)logP(Y=yi). H
(
Y
)
=
−
∑
1
N
P
(
Y
=
y
i
)
log
P
(
Y
=
y
i
)
.
Get Radiology Tree app to read full this article<
Get Radiology Tree app to read full this article<
H(P)=H(P1)+H(P2)+…+H(Pk). H
(
P
)
=
H
(
P
1
)
+
H
(
P
2
)
+
…
+
H
(
P
k
)
.
Get Radiology Tree app to read full this article<
Get Radiology Tree app to read full this article<
A:p0PT,p1PT,…,psPT;B:ps+11−PT,ps+21−PT,…,pn1−PT,wherePT=∑si=0pi. A
:
p
0
P
T
,
p
1
P
T
,
…
,
p
s
P
T
;
B
:
p
s
+
1
1
−
P
T
,
p
s
+
2
1
−
P
T
,
…
,
p
n
1
−
P
T
,
where
P
T
=
∑
i
=
0
s
p
i
.
The respective entropies for A and B are
H(A)=−∑si=0piPTlogpiPT;andH(B)=−∑ni=1+spi1−PTlogpi1−PT. H
(
A
)
=
−
∑
i
=
0
s
p
i
P
T
log
p
i
P
T
;
and
H
(
B
)
=
−
∑
i
=
1
+
s
n
p
i
1
−
P
T
log
p
i
1
−
P
T
.
s=arg⎧⎩⎨maxs[H(A)+H(B)]⎫⎭⎬. s
=
arg
{
max
s
[
H
(
A
)
+
H
(
B
)
]
}
.
Get Radiology Tree app to read full this article<
Get Radiology Tree app to read full this article<
Get Radiology Tree app to read full this article<
Get Radiology Tree app to read full this article<
Step 2: Segmentation refinement with active-contour model
Get Radiology Tree app to read full this article<
Get Radiology Tree app to read full this article<
Esnake=∫10Eint[v(s)]ds+Eext[v(s)]ds. E
snake
=
∫
0
1
E
int
[
v
(
s
)
]
d
s
+
E
ext
[
v
(
s
)
]
d
s
.
Get Radiology Tree app to read full this article<
Get Radiology Tree app to read full this article<
ε=∫∫μ(u2x+u2y+v2x+v2y)+∣∣∇f∣∣2∣∣V−∇f∣∣2dxdy, ε
=
∫
∫
μ
(
u
x
2
+
u
y
2
+
v
x
2
+
v
y
2
)
+
|
∇
f
|
2
|
V
−
∇
f
|
2
d
x
d
y
,
where |∇f| |
∇
f
| is the gradient of the original image. The gradient of the original image is identified as an edge map in which each pixel is assigned a value according to the edge strength. Mostly, pixels with large values represent object boundaries. The calculated edge magnitudes and capture range of the edge map directly affect the gradient vector flow field.
Get Radiology Tree app to read full this article<
Get Radiology Tree app to read full this article<
Get Radiology Tree app to read full this article<
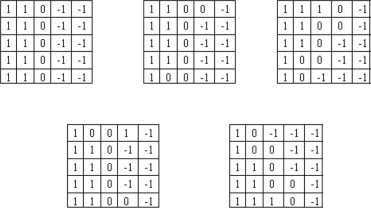
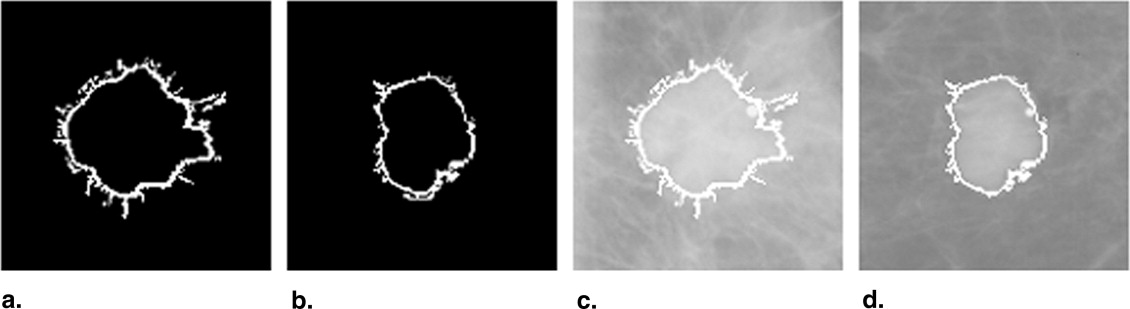
Step 3: Detection of spiculation level
Get Radiology Tree app to read full this article<
Get Radiology Tree app to read full this article<
Get Radiology Tree app to read full this article<
Get Radiology Tree app to read full this article<
Get Radiology Tree app to read full this article<
Evaluation of the Performance of the Method
Get Radiology Tree app to read full this article<
Get Radiology Tree app to read full this article<
Results
Get Radiology Tree app to read full this article<
Get Radiology Tree app to read full this article<
Discussion
Get Radiology Tree app to read full this article<
Get Radiology Tree app to read full this article<
Get Radiology Tree app to read full this article<
Get Radiology Tree app to read full this article<
Get Radiology Tree app to read full this article<
Get Radiology Tree app to read full this article<
Get Radiology Tree app to read full this article<
References
1. Rennie J., Rusting R.: Making headway against cancer. Sci Am 1996; 275: pp. 56-59.
2. Mettlin C.: Global breast cancer mortality statistics. CA Cancer J Clin 1999; 49: pp. 135-137.
3. Miller A.B.: Mammography: reviewing the evidence. Can Fam Physician 1993; 39: pp. 85-90.
4. Smith R.A.: Breast cancer screening among women younger than age 50: a current assessment of the issues. CA Cancer J Clin 2000; 50: pp. 312-336.
5. Tabar L., Vitak B., Chen H.H., et. al.: Beyond randomized controlled trials: organized mammographic screening substantially reduces breast carcinoma mortality. Cancer 2001; 91: pp. 1724-1731.
6. Nishikawa R.M.: Current status and future directions of computer-aided diagnosis in mammography. Comput Med Imaging Graph 2007; 31: pp. 224-235.
7. Brem R.F., Hoffmeister J.W., Zisman G., et. al.: A computer-aided detection system for the evaluation of breast cancer by mammographic appearance and lesion size. AJR Am J Roentgenol 2005; 184: pp. 893-896.
8. Gur D., Stalder J.S., Hardesty L.A., et. al.: Computer-aided detection performance in mammographic examination of masses: assessment. Radiology 2004; 223: pp. 418-423.
9. Freer T.M., Ulissey M.J.: Screening mammography with computer-aided detection: prospective study of 12,860 patients in a community breast center. Radiology 2001; 220: pp. 781-786.
10. Khoo L.A., Taylor P., Given-Wilson R.M.: Computer-aided detection in the United Kingdom National Breast Screening Programme: prospective study. Radiology 2005; 237: pp. 444-449.
11. Sahiner B., Petrick N., Chan H., et. al.: Computer-aided characterization of mammographic masses: accuracy of mass segmentation and its effects on characterization. IEEE Trans Med Imaging 2001; 20: pp. 1275-1284.
12. Zheng B., Mello-Thoms C., Wang X.H., et. al.: Interactive computer aided diagnosis of breast masses: computerized selection of visually similar image sets from a reference library. Acad Radiol 2007; 14: pp. 917-927.
13. Petrick N., Chan H.P., Wei D., et. al.: Automated detection of breast masses on mammograms using adaptive contrast enhancement and texture classification. Med Phys 1996; 23: pp. 1685-1696.
14. Zheng B., Chang Y.H., Gur D.: Computer detection of masses in digitized mammograms using single-image segmentation and a multilayer topographic feature analysis. Acad Radiol 1995; 2: pp. 959-966.
15. Catarious D.M., Baydush A.H., Floyd C.E.: Incorporation of an iterative, linear segmentation routine into a mammographic mass CAD system. Med Phys 2004; 31: pp. 1512-1520.
16. Timp S., Karssemeijer N.: A new 2D segmentation method based on dynamic programming applied to computer aided detection in mammography. Med Phys 2004; 31: pp. 958-971.
17. Te Brake G.M., Karssemeijer N.: Segmentation of suspicious densities in digital mammograms. Med Phys 2001; 28: pp. 259-266.
18. Vyborny C.J., Doi T., O’Shaughnessy K.F., et. al.: Breast cancer: importance of spiculation in computer-aided detection. Radiology 2000; 215: pp. 703-707.
19. Kegelmeyer W.P., Pruneda J.M., Bourland P.D., et. al.: Computer-aided mammographic screening for spiculated lesions. Radiology 1994; 191: pp. 331-337.
20. Karssemeijer N., Te Brake G.M.: Detection of stellate distortions in mammograms. IEEE Trans Med Imaging 1996; 15: pp. 611-619.
21. Huo Z., Giger M.L., Vyborny C.J.: Analysis of spiculation in the computerized classification of mammographic masses. Med Phys 1995; 22: pp. 1569-1579.
22. Sahiner B., Chan H.P., Petrick N., et. al.: Improvement of mammographic mass characterization using spiculation measures and morphological features. Med Phys 2001; 28: pp. 1455-1465.
23. Zheng B., Lu A., Hardesty L.A., et. al.: A method to improve visual similarity of breast masses for an interactive computer-aided diagnosis environment. Med Phys 2006; 33: pp. 111-117.
24. Heath M., Bowyer K., Kopans D., et. al.: The Digital Database for Screening Mammography. Presented at: 5th International Workshop on Digital Mammography2000. June; Toronto, Canada
25. Eltonsy N.H., Tourassi G.D., Elmaghraby A.S.: A concentric morphology model for the detection of masses in mammography. IEEE Trans Med Imaging 2007; 26: pp. 880-889.
26. Yuan Y., Giger M.L., Li H., et. al.: A dual-stage method for lesion segmentation on digital mammograms. Med Phys 2007; 34: pp. 4180-4193.
27. Shannon C.E.: A mathematical theory of communication. Bell Syst Tech J 1948; 27: pp. 379-423. 623–656
28. Pun T.: A new method for gray level picture thresholding using the entropy of the histogram. Signal Process 1980; 2: pp. 233-237.
29. Kass M., Witkin A., Terzopoulos D.: Snake: active contour models. Int J Comput Vision 1987; 1: pp. 321-331.
30. Xu C., Prince J.L.: Snakes, shapes, and gradient vector flow. IEEE Trans Image Processing 1998; 7: pp. 359-369.
31. Song E., Jiang L., Meng B., et. al.: Mass edge detection in mammography based on plane fitting and dynamic programming. Presented at: 2007 ACM Symposium on Applied Computing; March 11–152007. Seoul, Korea
32. GVF snake demo. http://iacl.ece.jhu.edu/projects/gvf/snakedemo/ Accessed September 2, 2006
33. Zheng B., Abrams G., Leader J.K., et. al.: Mass margins spiculations: agreement between ratings by observers and a computer scheme. Proc SPIE 2007; 6514: pp. 65141P.
34. Li L., Zheng Y., Zhang L., et. al.: False-positive reduction in CAD mass detection using a competitive classification strategy. Med Phys 2001; 28: pp. 250-258.
35. Metz C.E., Wang P.L., Kronman H.B.: Maximum-likelihood estimation of receiver operating characteristic (ROC) curves from continuously-distributed data. Stat Med 1998; 17: pp. 1033-1053.
36. Metz C.E.: ROCFIT 0.9B beta version. http://www.radiology.uchicago.edu/krl/ Accessed December 3, 2005