
Rationale and Objectives
The objective of this work was to develop and evaluate a robust algorithm that automatically detects small solid pulmonary nodules in whole lung helical CT scans from a lung cancer screening study.
Materials and Methods
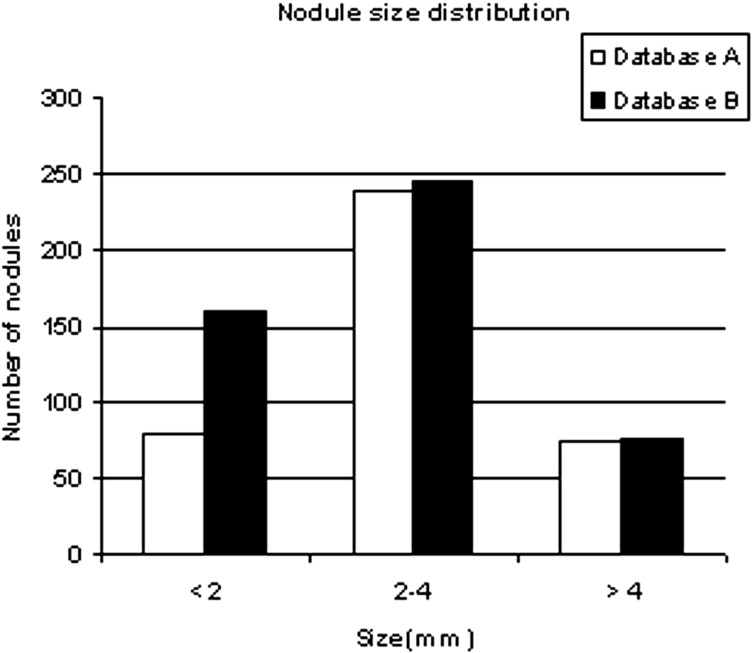
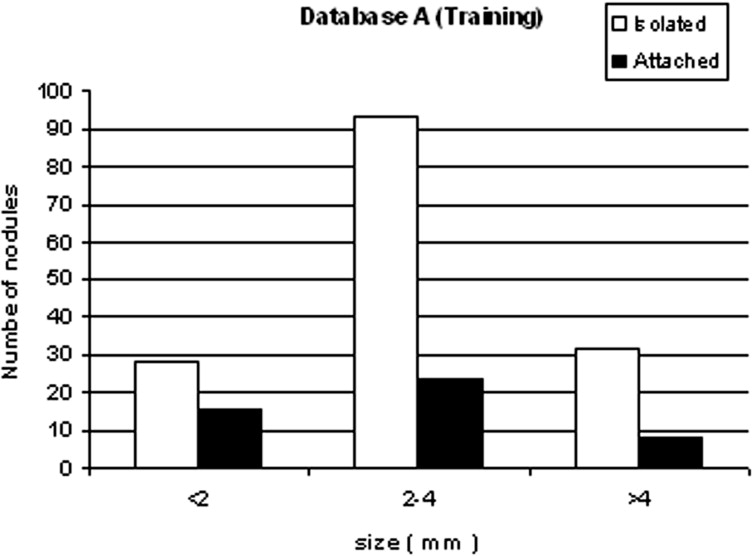
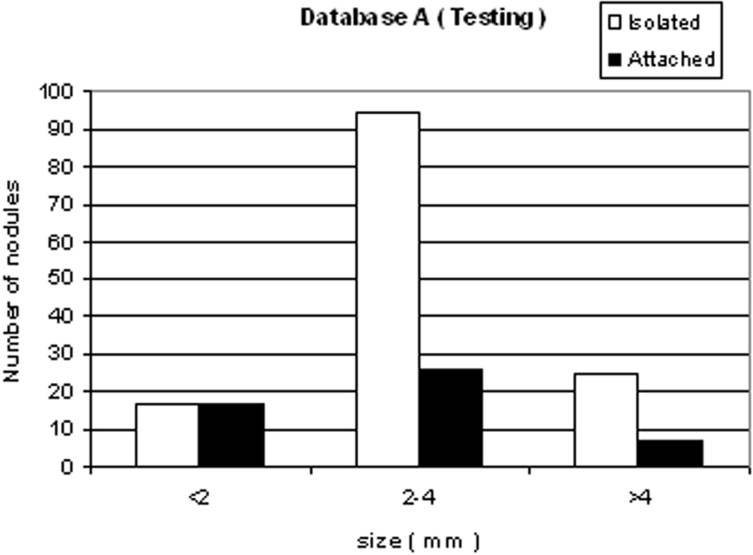
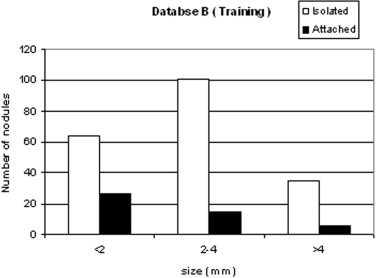
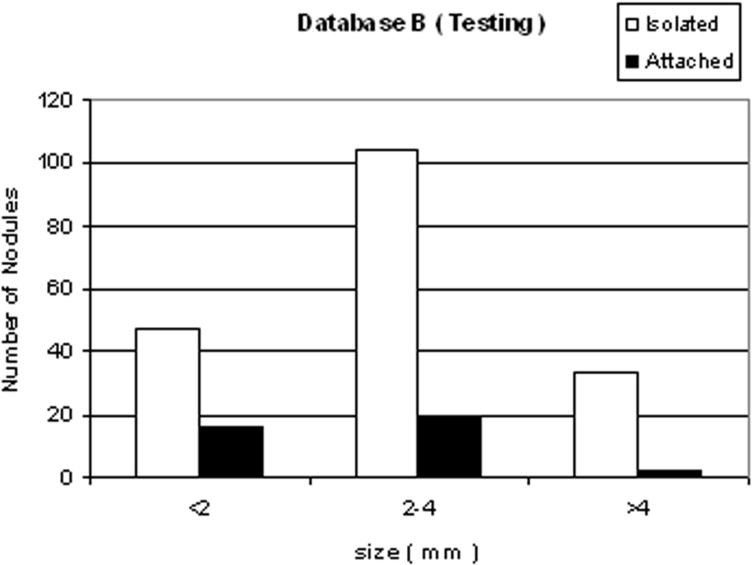
We developed a three-stage detection algorithm for both isolated and attached nodules. The algorithm consisted of nodule search space demarcation, nodule candidates’ generation, and a sequential elimination of false positives. Isolated nodules are nodules that are surrounded by lung parenchyma, whereas attached nodules are connected to large, dense structures such as pleural and/or mediastinal surface. Two large well-documented whole lung CT scan databases (Databases A and B) were created to train and test the detection algorithm. Database A contains 250 sequentially selected scans with 2.5-mm slice thickness that were obtained at Weill Medical College of Cornell University. With equipment upgrade at this college, a second database, Database B, was created containing 250 scans with a 1.25-mm slice thickness. A total of 395 and 482 nodules were identified in Databases A and B, respectively. In both databases, the majority of the nodules were isolated, comprising 72.1% and 82.3% of nodules in Databases A and B, respectively.
Results
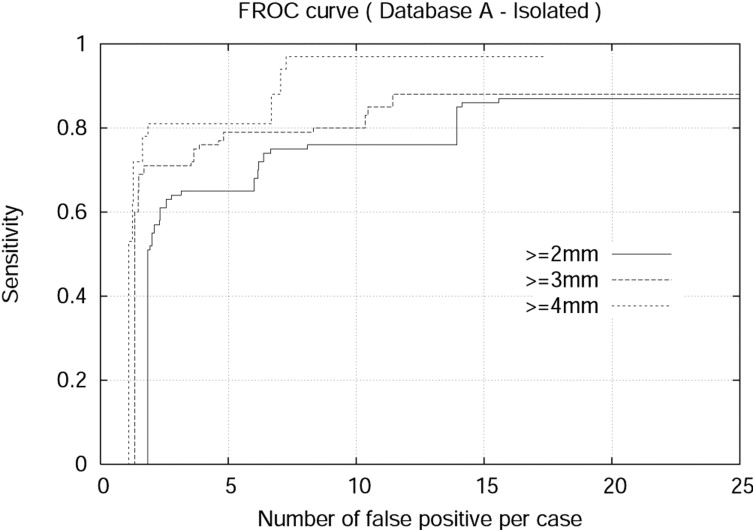
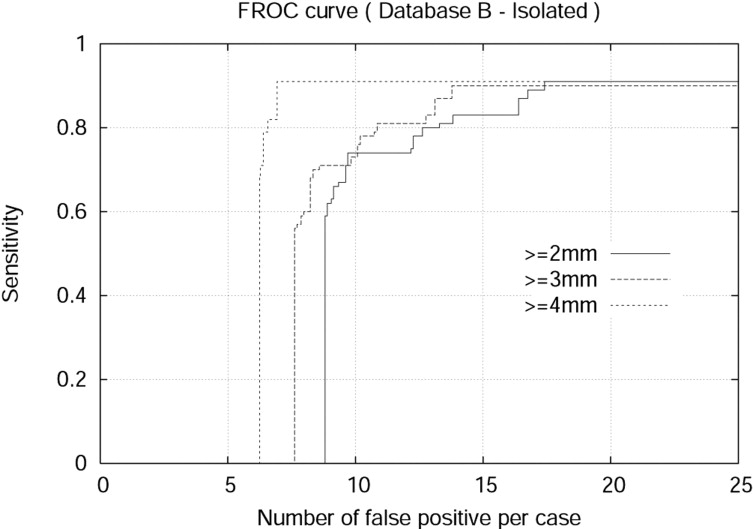
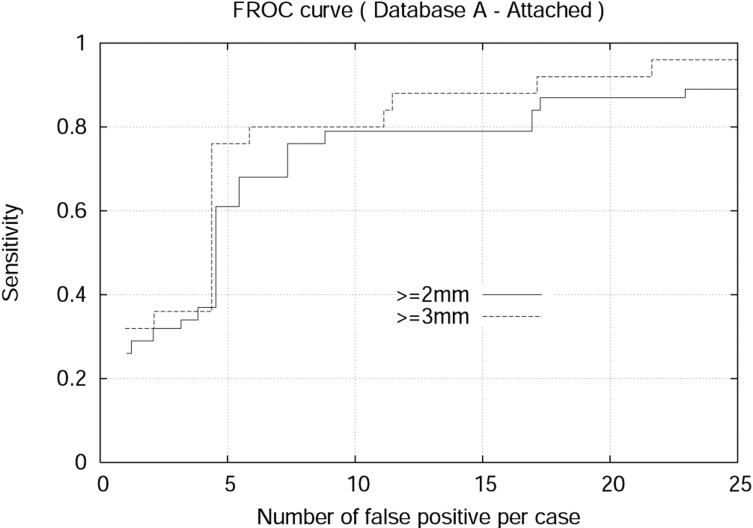
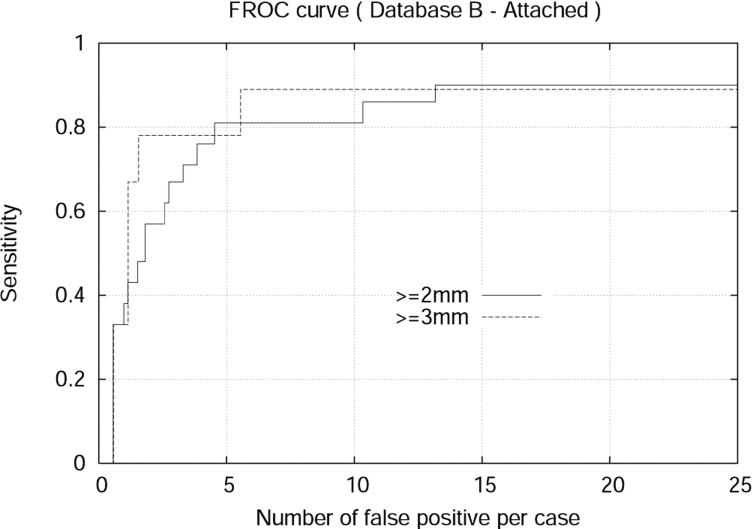
The detection algorithm was trained and tested on both Databases A and B. For isolated nodules with sizes 4 mm or larger, the algorithm achieved 94.0% sensitivity and 7.1 false positives per case (FPPC) for Database A (2.5 mm). Similarly, the algorithm achieved 91% sensitivity and 6.9 FPPC for Database B (1.25 mm). The algorithm achieved 92% sensitivity with 17.4 FPPC and 89% sensitivity with 5.5 FFPC for attached nodules with sizes 3 mm or larger in the Database A (2.5 mm) and Database B (1.25 mm), respectively.
Conclusion
The developed algorithm achieved practical performance for automated detection of both isolated and the more challenging attached nodules. The automated system will be a useful tool to assist radiologists in identifying nodules from whole lung CT scans in a clinical setting.
Lung cancer is the leading cause of cancer-related death, accounting for 29% of all cancer deaths in the United States. ( ) According to the American Cancer Society, ( ) there will be approximately 162,460 lung cancer–related deaths in the United States in 2006. Despite improvements in lung cancer treatment over the last several decades, about 95% of the people diagnosed with lung cancer eventually died of it. ( ) However, the Early Lung Cancer Action Project (ELCAP) ( ) showed that lung cancer can be identified early in more than 80% of those diagnosed with it, and it is well known that treatment of early stage lung cancer results in a substantially higher overall cure rate. The ELCAP study also compared CT with chest radiography and found that 83% of those diagnosed with early-stage lung cancer were missed on the chest radiographs. In the lung cancer screening process, radiologists analyze whole lung CT images of asymptomatic patients, searching for nodules. CT scanners produce many thin-slice axial images per patient. Hence, radiologists are confronted with the overwhelming task of interpreting a massive quantity of images. This has necessitated the development of a computer-aided diagnosis (CAD) system.
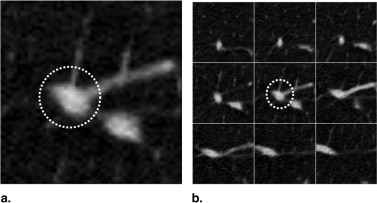
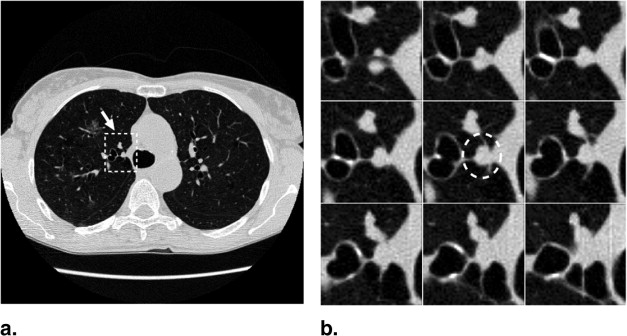
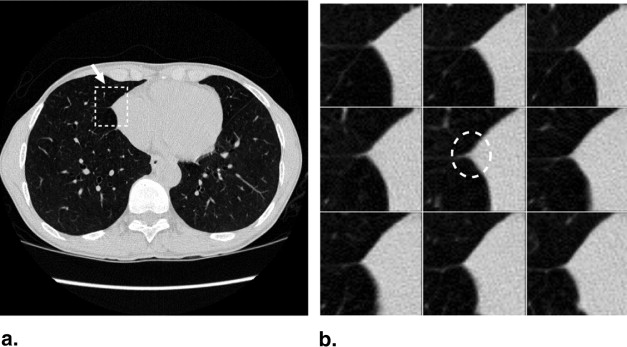
The majority of pulmonary nodules are of isolated type. Isolated nodules have no attachments to a large solid structure and are mainly surrounded by lung parenchyma. Figure 1 A shows a large nodule surrounded by the lung parenchyma. Isolated nodules have, in general, a spherical shape. However, the spherical shape may be distorted by other small lung structures such as vessels, bronchi, scars, and regions of morbidity. For example, the shape of the isolated nodule in Figure 1 B is distorted by a blood vessel attached to it. Moreover, the intensity distribution of isolated nodules may be perturbed by the occurrence of artifacts in the CT image. An example of a large nodule in a region with a high streaking artifact is shown in Figure 1 C.
 Open full size image
Figure 1
Isolated pulmonary nodule examples showing 2D slice and 3D rendered images. ( A ) Nodule mainly surrounded by lung parenchyma. ( B ) Nodule attached to a blood vessel. ( C ) Large nodule with several vessel connections in streaking artifact-affected region.
Get Radiology Tree app to read full this article<
Get Radiology Tree app to read full this article<
 Open full size image
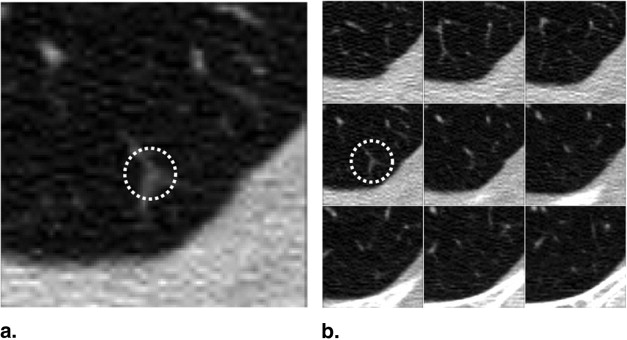
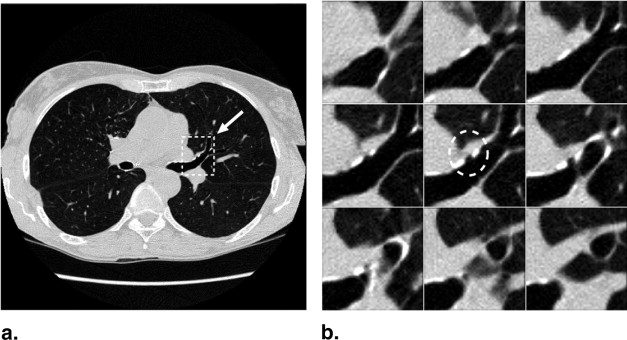
Figure 2
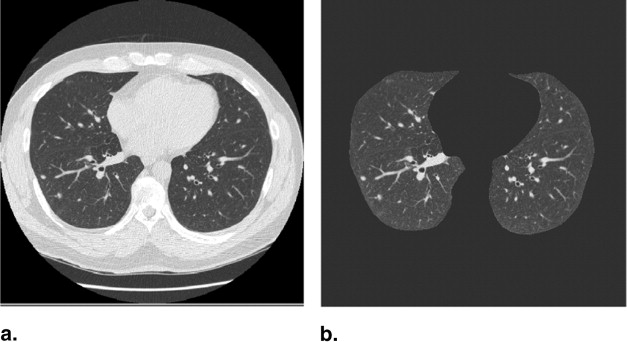
Attached pulmonary nodule examples showing 2D slice and 3D rendered images. ( A ) Nodule attached to the pleural surface. ( B ) Nodule attached to the mediastinal surface.
Get Radiology Tree app to read full this article<
Get Radiology Tree app to read full this article<
Get Radiology Tree app to read full this article<
Get Radiology Tree app to read full this article<
Get Radiology Tree app to read full this article<
Materials and methods
Database
Get Radiology Tree app to read full this article<
Table 1
Image acquisition protocol
Parameter Database A Database B Manufacturer GE GE Model LightSpeed QX/i LightSpeed Ultra Tube current (mA) 50 80 Tube voltage (kVp) 140 120 In-plane resolution (mm) 0.5−0.7 0.5−0.7 Axial resolution (mm) 2.5 1.25
Get Radiology Tree app to read full this article<
Get Radiology Tree app to read full this article<
Get Radiology Tree app to read full this article<
Table 2
Nodule distribution by lobe location
Lobe location Database A Database B Right upper lobe 29.8% 25.6% Right middle lobe 10.2% 10.3% Right lower lobe 22.5% 23.2% Left upper lobe 15.7% 17.3% Left lower lobe 21.8% 23.6%
Table 3
Nodule distribution by type
Nodule type Database A Database B Isolated 72.1% 82.3% Attached 27.9% 17.7% Total 395 482
Get Radiology Tree app to read full this article<
Method
Get Radiology Tree app to read full this article<
Get Radiology Tree app to read full this article<
Nodule Search Space Demarcation
Get Radiology Tree app to read full this article<
Search Space Demarcation for Isolated Nodules
Get Radiology Tree app to read full this article<
Get Radiology Tree app to read full this article<
Search Space Demarcation for Attached Nodules
Get Radiology Tree app to read full this article<

Get Radiology Tree app to read full this article<
Nodule Candidate Generation
Get Radiology Tree app to read full this article<
Isolated nodule candidate generation
Get Radiology Tree app to read full this article<
Get Radiology Tree app to read full this article<
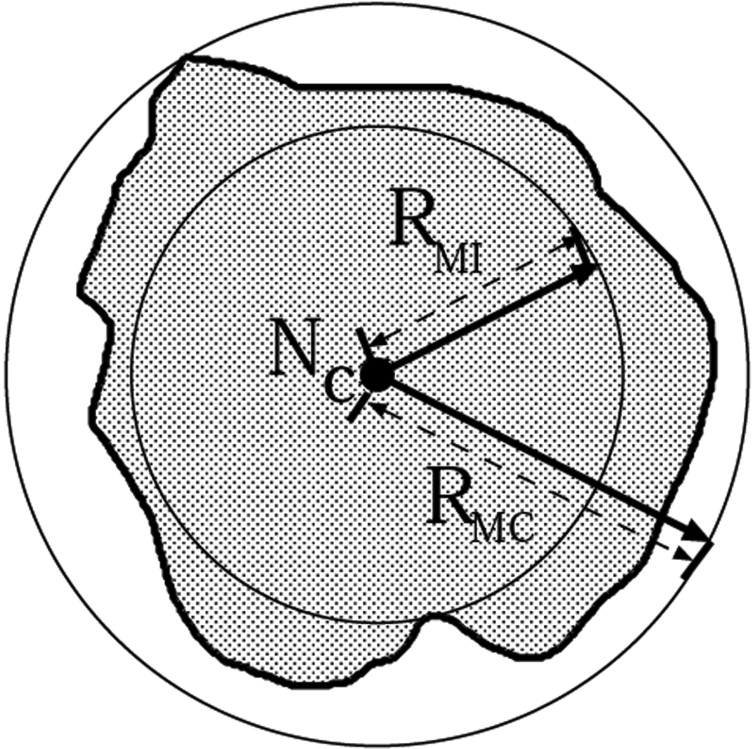
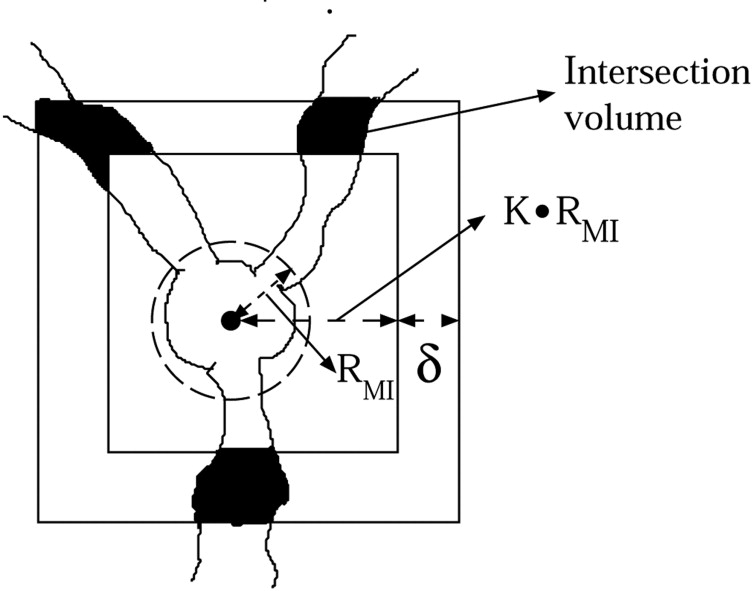
RMI=min∀i(D(Nc,Nib(x,y,z)) R
M
I
=
min
∀
i
(
D
(
N
c
,
N
b
i
(
x
,
y
,
z
)
)
where Nib N
b
i denote the i th boundary point of the nodule and D denotes the Euclidean distance. Similarly, the maximum distance ( R__MC ) from N__c to the boundary of the nodule ( N__b ) specifies the radius of the MCS, that is, the minimum sized sphere that can circumscribe the nodule centered on N__c and touching the boundary of the nodule.
RMC=max(D(NC,Nib(x,y,z)) R
M
C
=
max
(
D
(
N
C
,
N
b
i
(
x
,
y
,
z
)
)
Get Radiology Tree app to read full this article<
Get Radiology Tree app to read full this article<
Get Radiology Tree app to read full this article<
Get Radiology Tree app to read full this article<
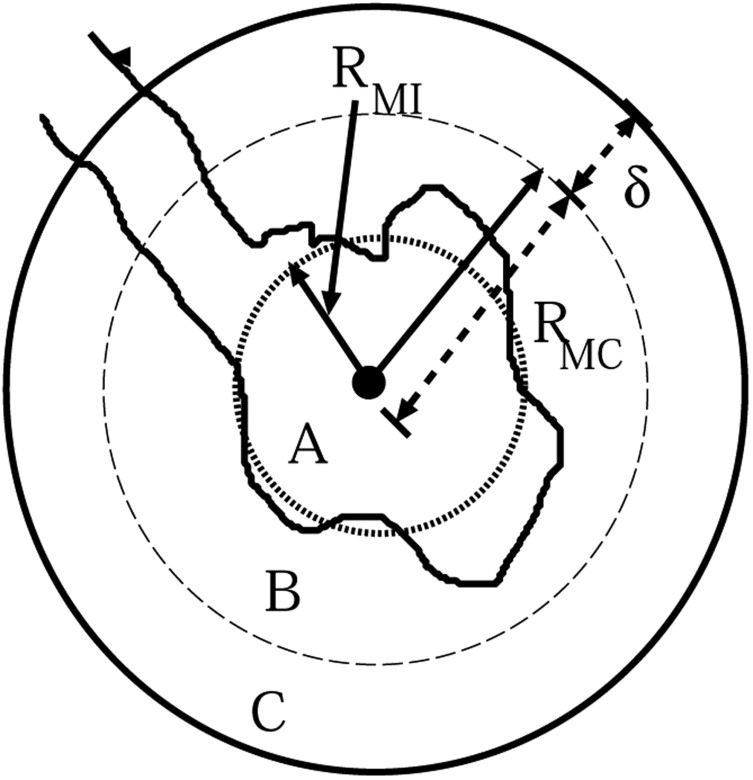
where T 1 is a threshold parameter for the ratio of the total nodule voxels within R MI to the total number of voxels in R MI , T 2 is a threshold parameter for the ratio of the nodule voxels within region C to the total number of voxels in region C, and δ is a constant shell thickness.
Get Radiology Tree app to read full this article<
Get Radiology Tree app to read full this article<
Get Radiology Tree app to read full this article<
Get Radiology Tree app to read full this article<
Attached nodule candidate generation
Get Radiology Tree app to read full this article<
Get Radiology Tree app to read full this article<
Get Radiology Tree app to read full this article<
Get Radiology Tree app to read full this article<
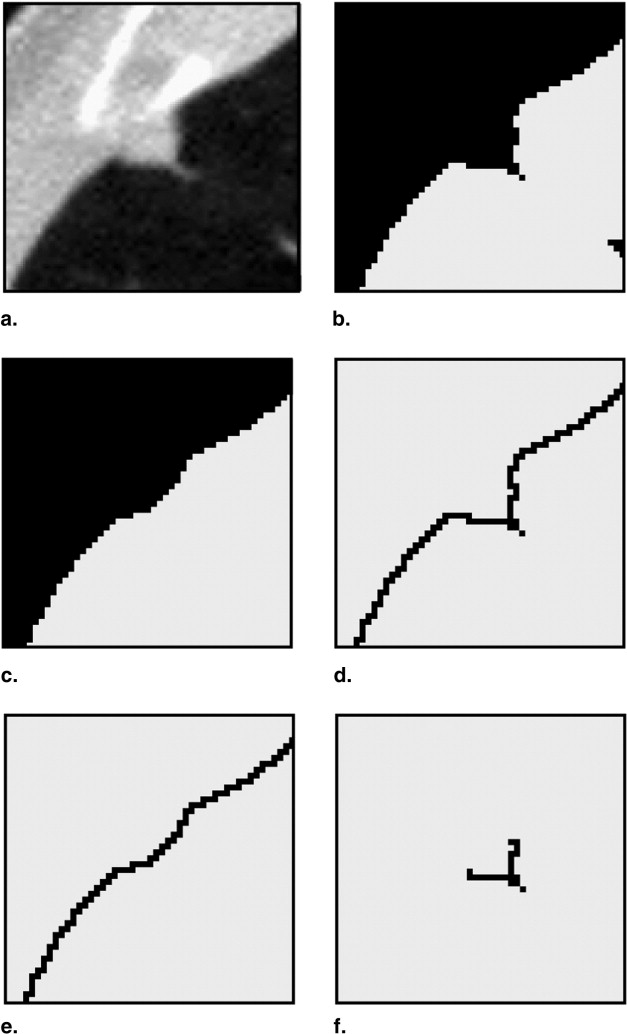
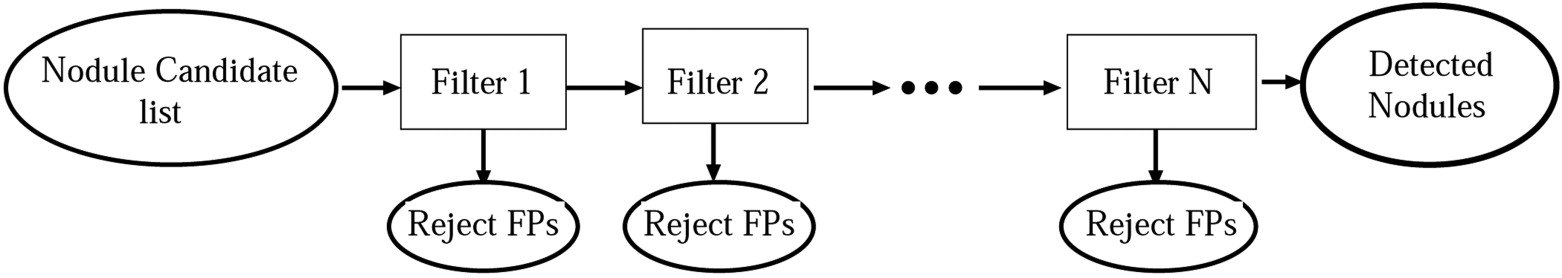
False Positive Elimination
Get Radiology Tree app to read full this article<
Table 4
Isolated false-positive elimination filters
Filters Targeted false-positive types Attachment evidence Sharply curved vessels and thick bifurcation points Vessel volume evidence Small bifurcation points Moment based Noisy patches close to the lung surface Template matching Small vessel bifurcation points Rectangular volume occupancy Cardiac motion artifact
Table 5
Attached false-positive elimination filters
Filters Targeted false-positive types Vessel intersection evidence Hilar vessels, bronchial walls Attachment evidence Hilar vessels Volume occupancy peakedness Bronchial walls Moment-based ridgeness measure Pericardial ridges Morphological shape measure Cardiac motion artifact
Get Radiology Tree app to read full this article<
Attachment Evidence Filter
Get Radiology Tree app to read full this article<

Get Radiology Tree app to read full this article<
Get Radiology Tree app to read full this article<
Vessel Volume Evidence Filter
Get Radiology Tree app to read full this article<
Get Radiology Tree app to read full this article<
Moment-Based Filter
Get Radiology Tree app to read full this article<
mpqr=∑M−1x=0∑N−1y=0∑L−1z=0xpyqzrV(x,y,z) m
p
q
r
=
∑
x
=
0
M
−
1
∑
y
=
0
N
−
1
∑
z
=
0
L
−
1
x
p
y
q
z
r
V
(
x
,
y
,
z
)
Get Radiology Tree app to read full this article<
Get Radiology Tree app to read full this article<
Mx=λx M
x
=
λ
x
where x represents the eigenvector in each direction of the principal axes of the nodule ellipsoid of inertia. The eigenvalues are used to determine the dimensions of the three principal axes. Aspect ratios of the principal axes are used to characterize shape of the nodule candidate. This characterization was used to eliminate the FPs.
Get Radiology Tree app to read full this article<
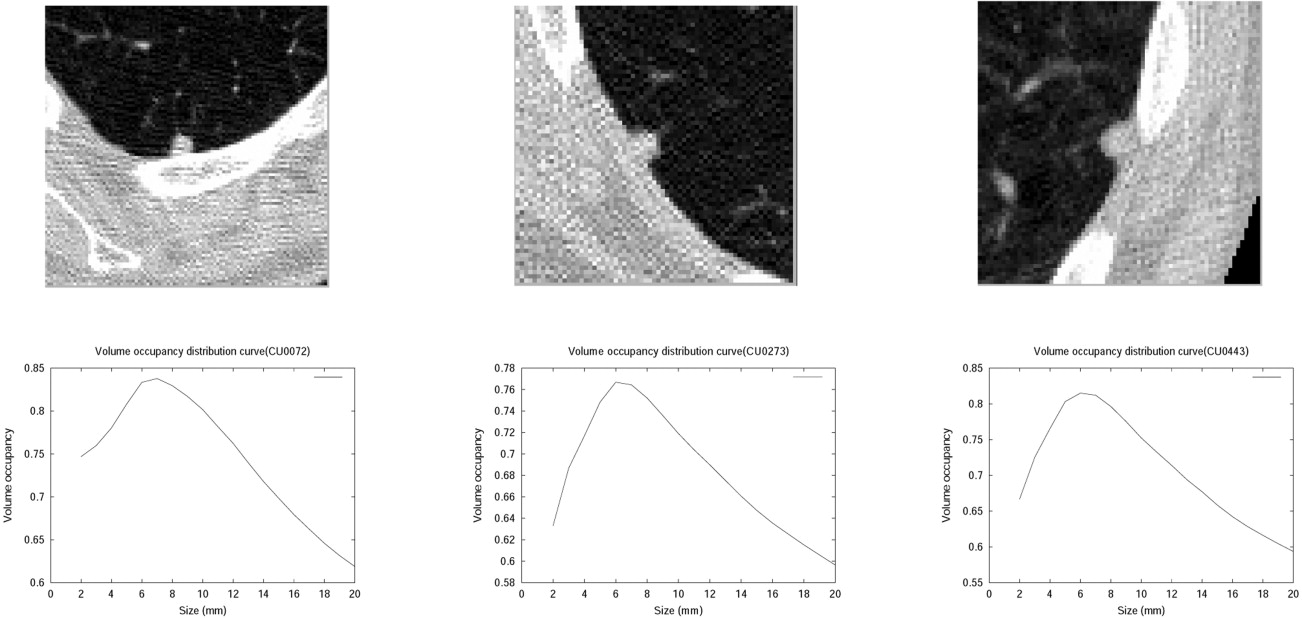
Rectangular Occupancy Filter
Get Radiology Tree app to read full this article<
Template Matching (Model-Based) Filter
Get Radiology Tree app to read full this article<
Vessel Intersection Evidence Filter
Get Radiology Tree app to read full this article<
Results
Get Radiology Tree app to read full this article<
Get Radiology Tree app to read full this article<
Get Radiology Tree app to read full this article<
Isolated Nodule Detection Results
Get Radiology Tree app to read full this article<
Get Radiology Tree app to read full this article<
Get Radiology Tree app to read full this article<
Get Radiology Tree app to read full this article<
Attached Nodule Detection Results
Get Radiology Tree app to read full this article<
Table 6
Attached false-positive type distribution in the nodule candidate list
False-positive type Percentage Hilar vessels 42.3 Bronchial walls 27.1 Pericardium ridges 16.9 Others 13.7
Get Radiology Tree app to read full this article<
Get Radiology Tree app to read full this article<
Get Radiology Tree app to read full this article<
Get Radiology Tree app to read full this article<
Get Radiology Tree app to read full this article<
Discussion
Get Radiology Tree app to read full this article<
Get Radiology Tree app to read full this article<
Get Radiology Tree app to read full this article<
Get Radiology Tree app to read full this article<
Get Radiology Tree app to read full this article<
Get Radiology Tree app to read full this article<
Get Radiology Tree app to read full this article<
Get Radiology Tree app to read full this article<
Conclusion
Get Radiology Tree app to read full this article<
References
1. American Cancer Society: 2006.ACSAtlanta
2. Henschke C.I., McCauley D.I., Yankelevitz D.F., et. al.: Early Lung Cancer Action Project: Overall design and findings from baseline screening. Lancet 1999; 354: pp. 99-105.
3. Henschke C.I., Yankelevitz D.F., Smith J.P., et. al.: CT screening for lung cancer: Assessing a regimen’s diagnostic performance. Clin Imaging 2004; 28: pp. 317-321.
4. Armato S.G., Giger M.L., Blackburn J.T., et. al.: Three-dimensional approach to lung nodule detection in helical CT. Proc SPIE 1999; 3661: pp. 553-559.
5. Gurcan M.K., Petrick N., Sahiner B., et. al.: Computerized lung nodule detection on thoracic CT images: Combined rule-based and statistical classifier for false positive reduction. Proc SPIE 2001; 4322: pp. 686-692.
6. Lee Y., Hara T., Fujita H., et. al.: Automated detection of pulmonary nodules in helical CT images based on an improved template-matching technique. IEEE Trans Med Imaging 2001; 20: pp. 595-604.
7. Lu X., Wei G.Q., Qian J., Jain A.K.: 2004. Computer Assisted Radiology and Surgery (CARS), Proceedings of the 18th International Congress.
8. McCulloch C.C., Kaucic R.A., Mendonca P.R.S., Walter D.J., Avila R.S.: Model-based detection of lung nodules in computer tomography exams. Acad Radiol 2004; 11: pp. 258-266.
9. Arimura H., Katsuragawa S., Suzuki K., et. al.: Computerized scheme for automated detection of lung nodules in low-dose computed tomography images for lung cancer screening. Acad Radiol 2004; 11: pp. 617-629.
10. Paik D.S., Beaulieu C.F., Rubin G.D., et. al.: Surface normal overlap: A computer-aided detection algorithm with application to colonic polyps and lung nodules in helical CT. IEEE Trans Med Imaging 2004; 23: pp. 661-675.
11. Soler L., Delingette H., Malandain G., et. al.: Fully automatic anatomical, pathological, and functional segmentation from CT scans for hepatic surgery. Comput Aided Surg 2001; 6: pp. 131-142.
12. Kostis W.J., Reeves A.P., Yankelevitz D.F., Henschke C.I.: Three-dimensional segmentation and growth-rate estimation of small pulmonary nodules in helical (CT) Images. IEEE Trans Med Imaging 2003; 22: pp. 1259-1274.
13. Takizawa H., Yammamoto S., Matsumoto T., Tatento Y., Linuma T., Matsumoto M.: Recognition of lung nodules from X-ray CT Images using 3-D Markov random field models. Proc SPIE 2002; 4684: pp. 716-725.
14. Fukano G., Takizawa H., Shigemoto K., et. al.: Recognition method of lung nodules using blood vessel extraction techniques and 3-D object models. Proc SPIE 2003; 5032: pp. 190-196.
15. Brown M.S., McNitt-Gray M.F., Goldin J.G., Suh R.D., Sayre J.W., Aberle D.R.: Patient-specific models for lung nodule detection and surveillance in CT Images. IEEE Trans Med Imaging 2001; 20: pp. 1242-1250.
16. Henschke C.I., Yankelevitz D.F., Mirtcheva R., McGuninness G., McCauley D., Miettinen O.S.: CT Screening for lung cancer: Frequency and significance of part-solid and non-solid nodules. AJR Am J Roentgenol 2002; 178: pp. 1053-1057.
17. Engeler C.E., Tashjian J.H., Trenkner S.W., Walsh J.W.: Ground-glass opacity of the lung parenchyma: A guide to analysis with high-resolution CT. AJR Am J Roentgenol 1993; 160: pp. 249-251.
18. Yoon H.E., Fukuhara K., Michiura T., Takada M., Imakita M., Nonaka K.: Pulmonary nodules 10 mm or less in diameter with ground-glass opacity component detected by high resolution computed tomography hava a high possibility of malignancy. Jpn Thorac Cardiovasc Surg 2005; 53: pp. 22-28.