
Rationale and Objectives
The aim of this study was to develop a computerized scheme for automated identity recognition based on chest radiograph features.
Materials and Methods
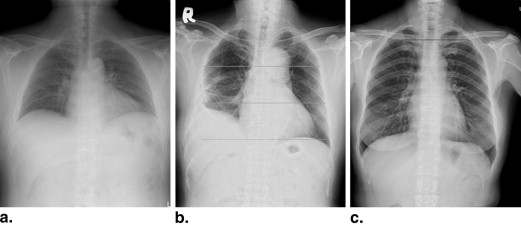
The proposed method was evaluated on a database consisting of 1000 pairs of posteroanterior chest radiographs. The method was based on six features: length of the lung field, size of the heart, area of the body, and widths of the upper, middle, and lower thoracic cage. The values for the six features were determined from a chest image, and absolute differences in feature values between the two images (feature errors) were used as indices of image similarity. The performance of the proposed method was evaluated by receiver operating characteristic (ROC) analysis. The discriminant performance was evaluated as the area Az under the ROC curve.
Results
The discriminant performance Az of the feature errors for lung field length, heart size, body area, upper cage width, middle cage width, and lower cage width were 0.794 ± 0.005, 0.737 ± 0.007, 0.820 ± 0.008, 0.860 ± 0.005, 0.894 ± 0.006, and 0.873 ± 0.006, respectively. The combination of the six feature errors obtained an Az value of 0.963 ± 0.002.
Conclusion
The results indicate that combining the six features yields a high discriminant performance in recognizing patient identity. The method has potential usefulness for automated identity recognition to ensure that chest radiographs are associated with the correct patient.
Patient identity recognition is an important procedure when radiographic examinations are performed. Taking a radiograph with a wrong patient sometimes happens due to the heavy workload of radiologic technologists in examination rooms. Minimizing such errors is an important issue. Among all radiographic examinations, chest examinations are performed most frequently. It is helpful to alert radiologic technologists when a chest examination performed with a wrong patient occurs. The examination can be repeated on the spot, and the further problems can be prevented. This is especially worthwhile for outpatients who leave the hospital after seeing a physician.
The major works related to patient identification using chest radiographs have been performed by Morishita et al, including the first automated patient recognition method based on image-matching technique . The proposed method determined the similarity between two images by calculating correlation values between two chest images. The authors further brought up an idea about automated patient recognition using biological fingerprints in chest radiographs . The biological fingerprints included thoracic field, cardiac shadow, lung apex, superior mediastinum, right lung, and right lower lung in the study. After determining the correlation value between two subimages of each biological fingerprint, the discriminant performance of each biological fingerprint was analyzed. In another prospective study, the authors evaluated the effectiveness of a method based on image-matching technique in a clinical environment .
Get Radiology Tree app to read full this article<
Materials and methods
Image Database
Get Radiology Tree app to read full this article<
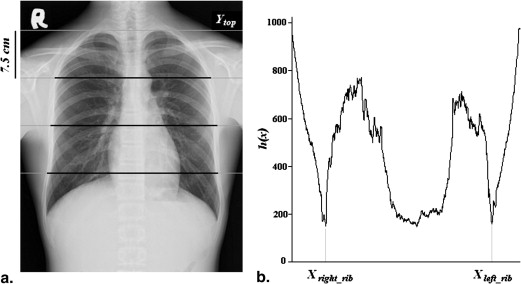
Features Used to Recognize Patient Identity
Get Radiology Tree app to read full this article<
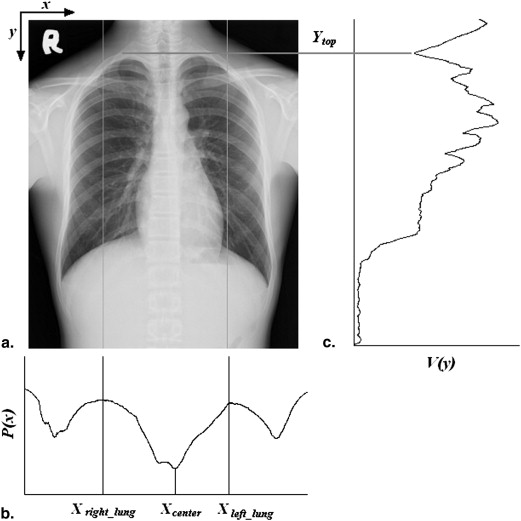
Top of Thoracic Cage
Get Radiology Tree app to read full this article<
V(y)=∑Xleft_lungx=Xright_lungI(x,y) V
(
y
)
=
∑
x
=
X
r
i
g
h
t
_
l
u
n
g
X
l
e
f
t
_
l
u
n
g
I
(
x
,
y
)
Get Radiology Tree app to read full this article<
Get Radiology Tree app to read full this article<
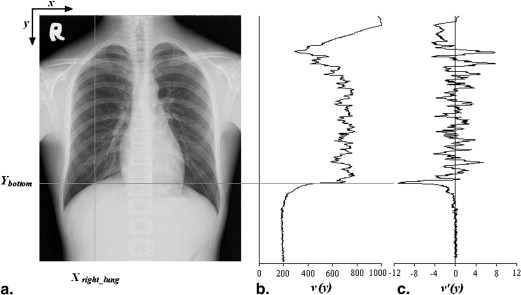
Length of Lung Field
Get Radiology Tree app to read full this article<
Llunglength=|Ybottom−Ytop| L
l
u
n
g
l
e
n
g
t
h
=
|
Y
b
o
t
t
o
m
−
Y
t
o
p
|
Get Radiology Tree app to read full this article<
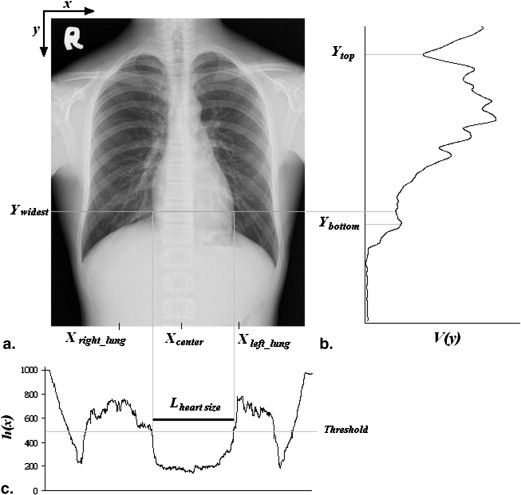
Size of Heart
Get Radiology Tree app to read full this article<
Get Radiology Tree app to read full this article<
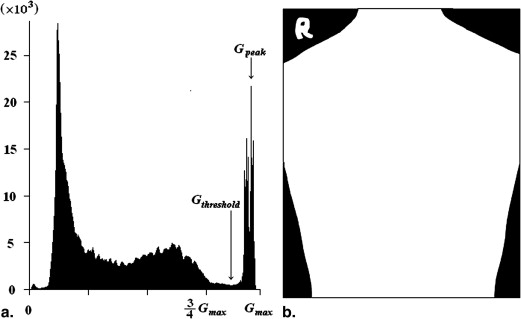
Area of Body
Get Radiology Tree app to read full this article<
Abodyarea=Nbody×pixelsize A
b
o
d
y
a
r
e
a
=
N
b
o
d
y
×
p
i
x
e
l
s
i
z
e
Get Radiology Tree app to read full this article<
Width of Thoracic Cage
Get Radiology Tree app to read full this article<
Get Radiology Tree app to read full this article<
Evaluation Method
Errors of feature values
Get Radiology Tree app to read full this article<
Errlunglength=∣∣Llunglength(A)−Llunglength(B)∣∣ E
r
r
l
u
n
g
l
e
n
g
t
h
=
|
L
l
u
n
g
l
e
n
g
t
h
(
A
)
−
L
l
u
n
g
l
e
n
g
t
h
(
B
)
|
Errheartsize=∣∣Lheartsize(A)−Lheartsize(B)∣∣ E
r
r
h
e
a
r
t
s
i
z
e
=
|
L
h
e
a
r
t
s
i
z
e
(
A
)
−
L
h
e
a
r
t
s
i
z
e
(
B
)
|
Errbodyarea=∣∣Abodyarea(A)−Abodyarea(B)∣∣ E
r
r
b
o
d
y
a
r
e
a
=
|
A
b
o
d
y
a
r
e
a
(
A
)
−
A
b
o
d
y
a
r
e
a
(
B
)
|
Erruppercage=∣∣Luppercage(A)−Luppercage(B)∣∣ E
r
r
u
p
p
e
r
c
a
g
e
=
|
L
u
p
p
e
r
c
a
g
e
(
A
)
−
L
u
p
p
e
r
c
a
g
e
(
B
)
|
Errmiddlecage=∣∣Lmiddlecage(A)−Lmiddlecage(B)∣∣ E
r
r
m
i
d
d
l
e
c
a
g
e
=
|
L
m
i
d
d
l
e
c
a
g
e
(
A
)
−
L
m
i
d
d
l
e
c
a
g
e
(
B
)
|
Errlowercage=∣∣Llowercage(A)−Llowercage(B)∣∣ E
r
r
l
o
w
e
r
c
a
g
e
=
|
L
l
o
w
e
r
c
a
g
e
(
A
)
−
L
l
o
w
e
r
c
a
g
e
(
B
)
|
Get Radiology Tree app to read full this article<
Get Radiology Tree app to read full this article<
Get Radiology Tree app to read full this article<
Combination of Six Feature Errors
Get Radiology Tree app to read full this article<
Get Radiology Tree app to read full this article<
Get Radiology Tree app to read full this article<
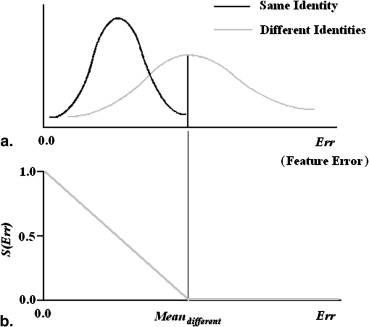
S={(Meandifferent−Err)/Meandifferent0ifErr≤MeandifferentifErr>Meandifferent S
=
{
(
M
e
a
n
d
i
f
f
e
r
e
n
t
−
E
r
r
)
/
M
e
a
n
d
i
f
f
e
r
e
n
t
i
f
E
r
r
≤
M
e
a
n
d
i
f
f
e
r
e
n
t
0
i
f
E
r
r
M
e
a
n
d
i
f
f
e
r
e
n
t
where Err is feature error and where Mean__differen t is the average of feature error for different identities. Figure 6 b schematically presents similarity value in terms of feature error. Using Equation 10, each feature error can be transformed into a value between 0 and 1. This general idea can be applied to all six feature errors, and S values were obtained for each set of feature errors ( S__lung length , S__heart size , S__body area , S__upper cage , S__middle cage , and S__lower cage ). The combination of the six feature errors can be represented by a similarity score calculated using Equation 11.
Get Radiology Tree app to read full this article<
Get Radiology Tree app to read full this article<
Scoresimilarity=Slunglength+Sheartsize+Sbodyarea+Suppercage+Smiddlecage+Slowercage S
c
o
r
e
s
i
m
i
l
a
r
i
t
y
=
S
l
u
n
g
l
e
n
g
t
h
+
S
h
e
a
r
t
s
i
z
e
+
S
b
o
d
y
a
r
e
a
+
S
u
p
p
e
r
c
a
g
e
+
S
m
i
d
d
l
e
c
a
g
e
+
S
l
o
w
e
r
c
a
g
e
Get Radiology Tree app to read full this article<
Get Radiology Tree app to read full this article<
Discriminant Performance Analysis
Get Radiology Tree app to read full this article<
Results
Get Radiology Tree app to read full this article<
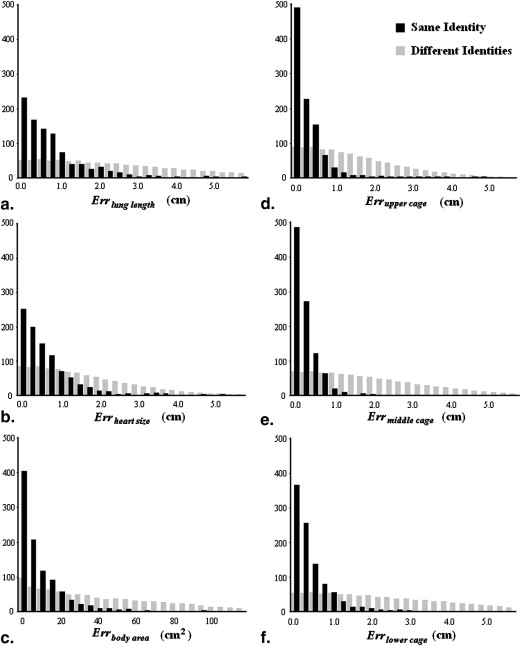
Table 1
Means and Standard Deviations of Feature Errors for the Same and Different Identities
Same Identity ( n = 1000) Different Identities ( n = 999,000)Err__Lung length (cm) 1.10 ± 1.66 3.05 ± 2.46Err__heart size (cm) 0.98 ± 1.48 2.02 ± 1.84Err__body area (cm 2 ) 11.88 ± 15.34 51.17 ± 45.51Err__upper cage (cm) 0.40 ± 0.50 1.78 ± 1.48Err__middle cage (cm) 0.39 ± 0.52 2.25 ± 1.78Err__lower cage (cm) 0.57 ± 0.70 2.83 ± 2.18
Get Radiology Tree app to read full this article<
Get Radiology Tree app to read full this article<
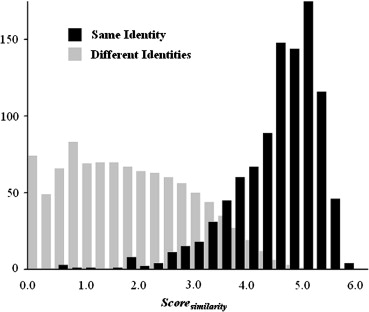
Table 2
Means and Standard Deviations of Score__similarity for the Same and Different Identities
Same Identity ( n = 1000) Different Identities ( n = 999,000)Score__similarity 4.53 ± 0.84 1.90 ± 1.18
Get Radiology Tree app to read full this article<
Get Radiology Tree app to read full this article<
Table 3
Discriminant Performance of Similarity Score and Feature Errors
Az ( n = 10)Score__similarity 0.963 ± 0.002Err__Lung length 0.794 ± 0.005Err__heart size 0.737 ± 0.007Err__body area 0.820 ± 0.008Err__upper cage 0.860 ± 0.005Err__middle cage 0.894 ± 0.006Err__lower cage 0.873 ± 0.006
Get Radiology Tree app to read full this article<
Discussion
Get Radiology Tree app to read full this article<
Get Radiology Tree app to read full this article<
Get Radiology Tree app to read full this article<
Get Radiology Tree app to read full this article<
Get Radiology Tree app to read full this article<

Get Radiology Tree app to read full this article<
Get Radiology Tree app to read full this article<
Conclusions
Get Radiology Tree app to read full this article<
References
1. Morishita J., Katsuragawa S., Kondo K., et. al.: An automated patient recognition method based on an image-matching technique using previous chest radiographs in the picture archiving and communication system environment. Med Phys 2001; 28: pp. 1093-1097.
2. Morishita J., Katsuragawa S., Sasaki Y., et. al.: Potential usefulness of biological fingerprints in chest radiographs for automated patient recognition and identification. Acad Radiol 2004; 11: pp. 309-315.
3. Morishita J., Watanabe H., Katsuragawa S., et. al.: Investigation of misfiled cases in the PACS environment and a solution to prevent filing errors for chest radiographs. Acad Radiol 2005; 12: pp. 97-103.
4. Kao E.F., Lee C., Hsu J.S., et. al.: Projection profile analysis for automated detection of abnormalities in chest radiographs. Med Phys 2006; 33: pp. 118-123.
5. Kao E.F., Kuo Y.T., Hsu J.S., et. al.: Zone-based analysis for automated detection of abnormalities in chest radiographs. Med Phys 2011; 38: pp. 4241-4250.
6. Hanley J.A., McNeil B.J.: The meaning and use of the area under a receiver operating characteristic (ROC) curve. Radiology 1982; 143: pp. 29-36.
7. Metz C.E.: Basic principles of ROC analysis. Semin Nucl Med 1978; 8: pp. 283-298.
8. Bontrager K.L.: Textbook of Radiographic Positioning and Related Anatomy.2001.MosbySt. Louis, MO