
Rationale and Objectives
To evaluate image quality and radiation exposure of portal venous–phase thoracoabdominal third-generation 192-slice dual-source computed tomography (DSCT) with automated tube voltage adaptation (TVA) in combination with advanced modeled iterative reconstruction (ADMIRE).
Materials and Methods
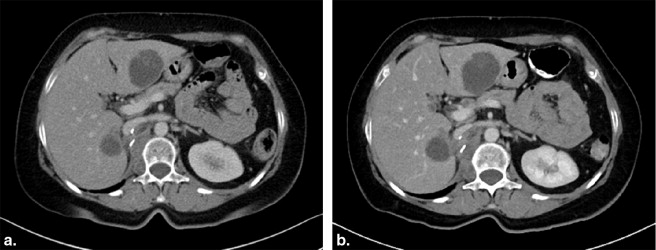
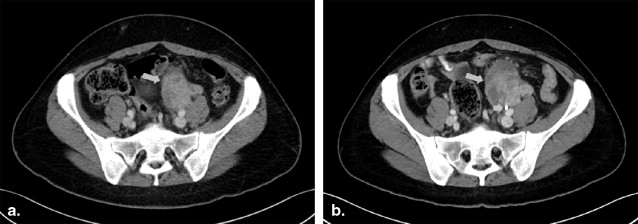
Fifty-one patients underwent oncologic portal venous–phase thoracoabdominal follow-up CT twice within 7 months. The initial examination was performed on second-generation 128-slice DSCT with fixed tube voltage of 120 kV in combination with filtered back projection reconstruction. The second examination was performed on a third-generation 192-slice DSCT using automated TVA in combination with ADMIRE. Attenuation and image noise of liver, spleen, renal cortex, aorta, vena cava inferior, portal vein, psoas muscle, and perinephric fat were measured. Signal-to-noise ratio (SNR) and contrast-to-noise ratio (CNR) were calculated. Radiation dose was assessed as size-specific dose estimates (SSDE). Subjective image quality was assessed by two observers using five-point Likert scales. Interobserver agreement was calculated using intraclass correlation coefficients (ICC).
Results
Automated TVA set tube voltage to 90 kV ( n = 8), 100 kV ( n = 31), 110 kV ( n = 11), or 120 kV ( n = 1). Average SSDE was decreased by 34.9% using 192-slice DSCT compared to 128-slice 120-kV DSCT (7.8 ± 2.4 vs. 12.1 ± 3.2 mGy; P < .001). Image noise was substantially lower; SNR and CNR were significantly increased in 192-slice DSCT compared to 128-slice DSCT (all P < .005). Image quality was voted excellent for both acquisition techniques (5.00 vs. 4.93; P = .083).
Conclusions
Automated TVA in combination with ADMIRE on third-generation 192-slice DSCT in portal venous–phase thoracoabdominal CT provides excellent image quality with reduced image noise and increased SNR and CNR, whereas average radiation dose is reduced by 34.9% compared to 128-slice DSCT.
Contrast-enhanced computed tomography (CT) is a well-established cross-sectional imaging technique in oncologic patients . Because CT may account for majority substantial amount of radiation exposure in oncologic patients , new technical innovations have focused on improvement of image quality and further radiation dose reduction to keep radiation dose “as low as reasonably achievable” .
Several techniques for radiation dose reduction have been proposed . Tube current modulation (TCM) adapts tube current to the body’s anatomy in real-time and is activated on most currently available CT systems . Tube voltage reduction is another promising technique for radiation dose reduction and can be performed using automated attenuation-based software . A potential drawback of low–tube-voltage acquisition is an increase in image noise, which may impair diagnostic image quality. Therefore, manual adjustment of tube voltage on an individual basis may be challenging. Automated tube voltage adaptation (TVA) can adapt tube voltage to the patient body based on attenuation measurements, maintaining sufficient image quality, even in low-kilovoltage examinations. Furthermore, the application of iterative reconstruction (IR) techniques can substantially reduce image noise .
Get Radiology Tree app to read full this article<
Materials and methods
Patient Population
Get Radiology Tree app to read full this article<
Examination Protocol
Get Radiology Tree app to read full this article<
Get Radiology Tree app to read full this article<
Get Radiology Tree app to read full this article<
Radiation Dose Estimation
Get Radiology Tree app to read full this article<
effectivediameter(cm)=AP×LAT−−−−−−−−−√ e
f
f
e
c
t
i
v
e
d
i
a
m
e
t
e
r
(
c
m
)
=
A
P
×
L
A
T
Get Radiology Tree app to read full this article<
Get Radiology Tree app to read full this article<
SSDE(mGy)=CTDIvol×conversionfactor S
S
D
E
(
m
G
y
)
=
C
T
D
I
v
o
l
×
c
o
n
v
e
r
s
i
o
n
f
a
c
t
o
r
Get Radiology Tree app to read full this article<
Objective Image Quality Analysis
Get Radiology Tree app to read full this article<
SNR=meansignalintensitystandarddeviation S
N
R
=
m
e
a
n
s
i
g
n
a
l
i
n
t
e
n
s
i
t
y
s
t
a
n
d
a
r
d
d
e
v
i
a
t
i
o
n
Get Radiology Tree app to read full this article<
Get Radiology Tree app to read full this article<
CNR=HUsofttissuestructure–HUmuscleimagenoise(muscle) C
N
R
=
H
U
s
o
f
t
t
i
s
s
u
e
s
t
r
u
c
t
u
r
e
–
H
U
m
u
s
c
l
e
i
m
a
g
e
n
o
i
s
e
(
m
u
s
c
l
e
)
Get Radiology Tree app to read full this article<
Subjective Image Quality Analysis
Get Radiology Tree app to read full this article<
Statistical Analysis
Get Radiology Tree app to read full this article<
Get Radiology Tree app to read full this article<
Results
Get Radiology Tree app to read full this article<
Radiation Dose
Get Radiology Tree app to read full this article<
Table 1
Radiation Dose Comparisons of Examination A (Second-Generation 128-Slice DSCT) and Examination B (Third-Generation 192-Slice DSCT)
Parameter Examination A Examination B_n_ = 51 All; n = 51P Value 90 kV; n = 8 100 kV; n = 31 110 kV; n = 11 120 kV; n = 1 Effective diameter (cm) 28.5 ± 4.9 28.8 ± 3.4 .243 25.9 ± 1.7 29.0 ± 3.4 30.4 ± 3.1 30.0 CTDI vol (mGy) 12.1 ± 3.2 7.8 ± 2.4 <.001 5.2 ± 0.5 7.3 ± 1.3 10.7 ± 1.9 13.6 DLP (mGy × cm) 831.8 ± 236.9 541.0 ± 182.2 <.001 334.0 ± 45.7 500.8 ± 96.2 776.0 ± 163.0 860.5 SSDE (mGy) 15.2 ± 2.8 9.9 ± 2.4 <.001 7.4 ± 0.4 9.3 ± 1.4 12.8 ± 1.3 16.7
CTDI vol , CT dose index volume; DLP, dose–length product; DSCT, dual-source computed tomography; SSDE, size-specific dose estimates.
Data are averages ± standard deviations.
Examination B is further subdivided into 90, 100, 110, and 120 kV.
P value between examination A and examination B (all).
Get Radiology Tree app to read full this article<
Objective Image Quality Analysis
Get Radiology Tree app to read full this article<
Table 2
Results of Objective Image Analysis
Parameter Examination A Examination B_n_ = 51 All, n = 51P Value 90 kV, n = 8 100 kV, n = 31 110 kV, n = 11 120 kV, n = 1 CT values (Hounsfield unit [HU]) Liver 96.9 113.7 <.001 138.9 114.3 98.3 62.4 Spleen 102.1 127.4 <.001 157.9 126.7 108.6 113.9 Renal cortex 154.3 197.8 <.001 261.1 198.7 153.1 154.0 Aorta 139.4 186.8 <.001 237.3 186.5 155.6 133.7 Inferior vena cava 105.9 132.6 <.001 162.1 138.6 98.3 90.4 Portal vein 140.0 181.8 <.001 236.2 181.6 147.7 128.4 Psoas muscle 61.1 63.6 .043 69.1 62.1 63.8 62.9 Perinephric fat −95.5 −102.1 <.001 −102.7 −101-6 −103.3 −97.9 Image noise (HU) Liver 12.4 9.6 <.001 9.1 9.7 9.7 8.9 Spleen 13.0 9.7 <.001 9.7 9.5 10.1 8.7 Renal cortex 13.9 11.9 .001 11.1 12.0 12.2 10.4 Aorta 14.2 10.6 <.001 11.2 10.3 10.9 10.7 Inferior vena cava 14.6 10.9 <.001 10.3 11.2 10.7 9.7 Portal vein 15.0 11.9 <.001 13.3 11.5 11.7 11.7 Psoas muscle 13.4 10.4 <.001 10.4 10.5 10.4 9.1 Perinephric fat 12.9 10.1 <.001 9.1 10.7 9.3 8.5 Signal-to-noise ratio Liver 8.3 12.1 <.001 15.4 12.0 10.4 7.0 Spleen 8.3 13.5 <.001 16.6 13.6 11.0 13.1 Renal cortex 11.9 17.3 <.001 24.2 17.1 12.9 14.8 Aorta 10.5 18.2 <.001 21.2 18.7 14.5 12.4 Inferior vena cava 7.5 12.4 <.001 15.9 12.6 9.4 9.3 Portal vein 9.7 15.9 <.001 19.2 16.2 13.0 11.0 Psoas muscle 4.8 6.3 <.001 6.9 6.2 6.4 6.9 Perinephric fat −7.8 −10.8 <.001 −12.1 −10.3 −11.3 −11.5 Contrast-to-noise ratio Liver muscle 3.2 5.0 <.001 6.8 5.1 3.6 −0.1 Spleen muscle 3.4 6.3 <.001 8.8 6.3 4.6 9.1 Renal cortex muscle 7.7 13.3 <.001 18.8 13.5 9.1 10.1 Aorta muscle 6.5 12.3 <.001 16.5 12.4 9.3 7.8 Inferior vena cava muscle 3.7 6.8 <.001 9.2 7.5 3.5 3.0 Vena porta muscle 6.5 11.7 <.001 16.4 11.7 8.6 7.2
Data are mean ± standard deviation.
Get Radiology Tree app to read full this article<
Get Radiology Tree app to read full this article<
Get Radiology Tree app to read full this article<
Subjective Image Quality Analysis
Get Radiology Tree app to read full this article<
Get Radiology Tree app to read full this article<
Table 3
Results of Subjective Image Quality Assessment
Examination Overall Image Quality Delineation of Soft Tissue Structures Image Sharpness Image Noise Examination A 4.93 (0.79) 4.84 (0.31) 4.98 (0.63) 4.52 (0.26) Examination B 5.00 (1.00) 4.93 (0.79) 4.86 (0.40) 4.98 (0.71)P value .083 .160 .580 <.001
Data are means (intraclass correlation coefficients) based on ratings from two observers.
Get Radiology Tree app to read full this article<
Discussion
Get Radiology Tree app to read full this article<
Get Radiology Tree app to read full this article<
Get Radiology Tree app to read full this article<
Get Radiology Tree app to read full this article<
Get Radiology Tree app to read full this article<
Get Radiology Tree app to read full this article<
Get Radiology Tree app to read full this article<
References
1. Berrington de Gonzalez A., Mahesh M., Kim K.P., et. al.: Projected cancer risks from computed tomographic scans performed in the United States in 2007. Archives of internal medicine 2009; 169: pp. 2071-2077.
2. Brenner D.J., Hall E.J.: Computed tomography—an increasing source of radiation exposure. The New England journal of medicine 2007; 357: pp. 2277-2284.
3. Brenner D.J.: Slowing the increase in the population dose resulting from CT scans. Radiation research 2010; 174: pp. 809-815.
4. Bodelle B., Klein E., Naguib N.N., et. al.: Acute intracranial hemorrhage in CT: benefits of sinogram-affirmed iterative reconstruction techniques. AJNR Am J Neuroradiol 2014; 35: pp. 445-449.
5. Eller A., May M.S., Scharf M., et. al.: Attenuation-based automatic kilovolt selection in abdominal computed tomography: effects on radiation exposure and image quality. Investigative radiology 2012; 47: pp. 559-565.
6. Gnannt R., Winklehner A., Eberli D., et. al.: Automated tube potential selection for standard chest and abdominal CT in follow-up patients with testicular cancer: comparison with fixed tube potential. European radiology 2012; 22: pp. 1937-1945.
7. Kalender W.A., Buchenau S., Deak P., et. al.: Technical approaches to the optimisation of CT. Physica medica: PM: an international journal devoted to the applications of physics to medicine and biology: official journal of the Italian Association of Biomedical Physics 2008; 24: pp. 71-79.
8. Kalender W.A., Wolf H., Suess C., et. al.: Dose reduction in CT by on-line tube current control: principles and validation on phantoms and cadavers. European radiology 1999; 9: pp. 323-328.
9. May M.S., Kramer M.R., Eller A., et. al.: Automated tube voltage adaptation in head and neck computed tomography between 120 and 100 kV: effects on image quality and radiation dose. Neuroradiology 2014; 56: pp. 797-803.
10. Winklehner A., Goetti R., Baumueller S., et. al.: Automated attenuation-based tube potential selection for thoracoabdominal computed tomography angiography: improved dose effectiveness. Investigative radiology 2011; 46: pp. 767-773.
11. Yu L., Li H., Fletcher J.G., et. al.: Automatic selection of tube potential for radiation dose reduction in CT: a general strategy. Medical physics 2010; 37: pp. 234-243.
12. Papadakis A.E., Perisinakis K., Damilakis J.: Automatic exposure control in pediatric and adult multidetector CT examinations: a phantom study on dose reduction and image quality. Medical physics 2008; 35: pp. 4567-4576.
13. Soderberg M., Gunnarsson M.: Automatic exposure control in computed tomography—an evaluation of systems from different manufacturers. Acta radiologica 2010; 51: pp. 625-634.
14. van Straten M., Deak P., Shrimpton P.C., et. al.: The effect of angular and longitudinal tube current modulations on the estimation of organ and effective doses in x-ray computed tomography. Medical physics 2009; 36: pp. 4881-4889.
15. Bittencourt M.S., Schmidt B., Seltmann M., et. al.: Iterative reconstruction in image space (IRIS) in cardiac computed tomography: initial experience. The international journal of cardiovascular imaging 2011; 27: pp. 1081-1087.
16. Ghetti C., Ortenzia O., Serreli G.: CT iterative reconstruction in image space: a phantom study. Physica medica: PM: an international journal devoted to the applications of physics to medicine and biology: official journal of the Italian Association of Biomedical Physics 2012; 28: pp. 161-165.
17. Prakash P., Kalra M.K., Kambadakone A.K., et. al.: Reducing abdominal CT radiation dose with adaptive statistical iterative reconstruction technique. Investigative radiology 2010; 45: pp. 202-210.
18. Medicine AAoPi: Size Specific Dose Estimates (SSDE) in pediatric and adult body CT examinations.2042011.Report of the AAPM Task GroupCollege Park, MD
19. Schulz B., Kuehling K., Kromen W., et. al.: Automatic bone removal technique in whole-body dual-energy CT angiography: performance and image quality. AJR Am J Roentgenol 2012; 199: pp. W646-W650.
20. Wichmann J.L., Kraft J., Noske E.M., et. al.: Low-tube-voltage 80-kVp neck CT: evaluation of diagnostic accuracy and interobserver agreement. AJNR Am J Neuroradiol 2014; 35: pp. 2376-2381.
21. Gnannt R., Winklehner A., Goetti R., et. al.: Low kilovoltage CT of the neck with 70 kVp: comparison with a standard protocol. AJNR Am J Neuroradiol 2012; 33: pp. 1014-1019.
22. Goetti R., Leschka S., Baumuller S., et. al.: Low dose high-pitch spiral acquisition 128-slice dual-source computed tomography for the evaluation of coronary artery bypass graft patency. Investigative radiology 2010; 45: pp. 324-330.
23. Hoang J.K., Yoshizumi T.T., Nguyen G., et. al.: Variation in tube voltage for adult neck MDCT: effect on radiation dose and image quality. AJR Am J Roentgenol 2012; 198: pp. 621-627.
24. Schindera S.T., Graca P., Patak M.A., et. al.: Thoracoabdominal-aortoiliac multidetector-row CT angiography at 80 and 100 kVp: assessment of image quality and radiation dose. Investigative radiology 2009; 44: pp. 650-655.
25. Wichmann J.L., Hu X., Kerl J.M., et. al.: 70 kVp computed tomography pulmonary angiography: potential for reduction of iodine load and radiation dose. J Thorac Imaging 2015; 30: pp. 69-76.
26. Meinel F.G., Canstein C., Schoepf U.J., et. al.: Image quality and radiation dose of low tube voltage 3rd generation dual-source coronary CT angiography in obese patients: a phantom study. European radiology 2014; 24: pp. 1643-1650.
27. Maldjian P.D., Goldman A.R.: Reducing radiation dose in body CT: a primer on dose metrics and key CT technical parameters. AJR American journal of roentgenology 2013; 200: pp. 741-747.
28. Eller A., Wuest W., Scharf M., et. al.: Attenuation-based automatic kilovolt (kV)-selection in computed tomography of the chest: effects on radiation exposure and image quality. European journal of radiology 2013; 82: pp. 2386-2391.
29. Winklehner A., Gordic S., Lauk E., et. al.: Automated attenuation-based tube voltage selection for body CTA: Performance evaluation of 192-slice dual-source CT. European radiology 2015; [Epub ahead of print]
30. May M.S., Wust W., Brand M., et. al.: Dose reduction in abdominal computed tomography: intraindividual comparison of image quality of full-dose standard and half-dose iterative reconstructions with dual-source computed tomography. Investigative radiology 2011; 46: pp. 465-470.
31. Vardhanabhuti V., Riordan R.D., Mitchell G.R., et. al.: Image comparative assessment using iterative reconstructions: clinical comparison of low-dose abdominal/pelvic computed tomography between adaptive statistical, model-based iterative reconstructions and traditional filtered back projection in 65 patients. Investigative radiology 2014; 49: pp. 209-216.
32. Gordic S., Desbiolles L., Stolzmann P., et. al.: Advanced modelled iterative reconstruction for abdominal CT: qualitative and quantitative evaluation. Clinical radiology 2014; 69: pp. e497-504.
33. Gaddikeri S., Andre J.B., Benjert J., et. al.: Impact of model-based iterative reconstruction on image quality of contrast-enhanced neck CT. AJNR American journal of neuroradiology 2015; 36: pp. 391-396.