
Rationale and Objectives
The purpose of this study was to evaluate discrepancy in breast composition measurements obtained from mammograms using two commercially available software methods for systematic trends in overestimation or underestimation compared to magnetic resonance-derived measurements.
Materials and Methods
An institutional review board-approved, Health Insurance Portability and Accountability Act-compliant retrospective study was performed to calculate percent breast density (PBD) by quantifying fibroglandular volume and total breast volume derived from magnetic resonance imaging (MRI) segmentation and mammograms using two commercially available software programs (Volpara and Quantra). Consecutive screening MRI exams from a 6-month period with negative or benign findings were used. The most recent mammogram within 9 months was used to derive mean density values from “for processing” images at the per breast level. Bland-Altman statistical analyses were performed to determine the mean discrepancy and the limits of agreement.
Results
A total of 110 women with 220 breasts met the study criteria. Overall, PBD was not different between MRI (mean 10%, range 1%–41%) and Volpara (mean 10%, range 3%–29%); a small but significant difference was present in the discrepancy between MRI and Quantra (4.0%, 95% CI: 2.9 to 5.0, P < 0.001). Discrepancy was highest at higher breast densities, with Volpara slightly underestimating and Quantra slightly overestimating PBD compared to MRI. The mean discrepancy for both Volpara and Quantra for total breast volume was not significantly different from MRI (p = 0.89, 0.35, respectively). Volpara tended to underestimate, whereas Quantra tended to overestimate fibroglandular volume, with the highest discrepancy at higher breast volumes.
Conclusions
Both Volpara and Quantra tend to underestimate PBD, which is most pronounced at higher densities. PBD can be accurately measured using automated volumetric software programs, but values should not be used interchangeably between vendors.
Introduction
Breast density decreases the sensitivity of mammography and is a moderate independent risk factor for breast cancer . In current practice, evaluation of breast density from mammograms using Breast Imaging Reporting and Data System (BI-RADS) density categories is somewhat subjective, with only a moderate inter-reader agreement . In the current edition of BI-RADS , more subjectivity is encouraged regarding upgrading of mammograms with focal areas of density to the heterogeneously dense category, resulting in lower inter-reader agreement . As public awareness and research continues on breast density, an accurate automated assessment of percent breast density (PBD) from mammograms is needed.
Mammographic breast density can be quantified using area or volumetric methods. In area-based methods, pixels of the mammogram are segmented into fat or breast tissues in a binary fashion . The area-based methods have consistently demonstrated a moderate statistically significant association with breast cancer risk with the women in the highest quartile of the population being about four times more likely to be diagnosed with breast cancer than women in the lowest-density quartile . A disadvantage of area-based methods is the lack of accounting for pixel depth, or the whiteness of the pixel. Volumetric breast density software programs quantify mammographic breast density by evaluating the whiteness (pixel depth) of the mammogram, creating a quantitative density map to estimate the percent volume of breast tissue. These values will inherently be smaller than area methods because a pixel that would be valued as binary positive for fibroglandular tissue may range in value from 1% to 100% to account for the whiteness of the pixel.
Get Radiology Tree app to read full this article<
Get Radiology Tree app to read full this article<
Get Radiology Tree app to read full this article<
Get Radiology Tree app to read full this article<
Materials and Methods
Get Radiology Tree app to read full this article<
Get Radiology Tree app to read full this article<
Get Radiology Tree app to read full this article<
MRI and Volumetric Processing
Get Radiology Tree app to read full this article<
Get Radiology Tree app to read full this article<
Automated Mammography-derived Volumetric PBD
Get Radiology Tree app to read full this article<
Get Radiology Tree app to read full this article<
Statistical Analysis
Get Radiology Tree app to read full this article<
Analysis of Measurement Discrepancy
Get Radiology Tree app to read full this article<
Get Radiology Tree app to read full this article<
Analysis of Interbreast Measurement Homogeneity
Get Radiology Tree app to read full this article<
Get Radiology Tree app to read full this article<
Results
Get Radiology Tree app to read full this article<
Get Radiology Tree app to read full this article<
Table 1
Mean Breast Density Measurements Derived from MRI and Mammography Using Two Automated Volumetric Software Programs
MRI (Range) Volpara (Range) Quantra (Range) TBV (cm 3 ) 800 (171–2110) 803 (149–2806) 821 (144–3276) FGV (cm 3 ) 81 (56–483) 69 (17–320) 115 (3–601) PBD (%) 10 (1–41) 10 (3–29) 14 (2–41)
FGV, fibroglandular volume; MRI, magnetic resonance imaging; PBD, percent breast density; TBV, total breast volume.
Get Radiology Tree app to read full this article<
TBV: MRI vs Volpara and Quantra Algorithms
Get Radiology Tree app to read full this article<
Table 2
Bland-Altman Measurement Agreement Summary for Total Breast Volume (cm 3 ), Fibroglandular Volume (cm 3 ), and Percent Breast Density (%) Between Volpara and MRI, and Between Quantra and MRI
Measurement Discrepancy (Δ)
Volpara and Quantra vs MRI Total Breast Volume Fibroglandular Volume Percent Breast Density Algorithm Estimate for Mean Δ (cm 3 ) (95% CI)P Value
Ho: Mean Δ = 0 Estimate for Mean Δ (cm 3 ) (95% CI)P Value
Ho: Mean Δ = 0 Estimate for Mean Δ (cm 3 ) (95% CI)P Value
Ho: Mean Δ = 0 Volpara −2.5 (−33.3 to 38.2) 0.892 −11.9 (−18.1 to 5.8) <0.001 −0.4% (−1.1 to 0.4) 0.306 Quantra 21.2 (−23.8 to 66.1) 0.353 34.7 (24.7 to 44.6) <0.001 4.0% (2.9 to 5.0) <0.001
Within-subject Variability (SD)
Left and Right Measurement Discrepancies Algorithm SD (cm 3 ) (95% CI) SD (cm 3 ) (95% CI) SD (cm 3 ) (95% CI) Volpara 67.0 (59.2 to 77.2) 32.2 (28.5 to 37.1) 3.5% (3.1 to 4.1) Quantra 93.6 (82.7 to 107.8) 46.8 (41.3 to 53.9) 4.4% (3.9 to 5.1)
Bland-Altman Limits of Agreement
for Measurement Discrepancy Algorithm Lower Limit of Agreement
Mean Δ − 2 SD
(95% CI) Upper Limit of Agreement
Mean Δ + 2 SD
(95% CI) Lower Limit of Agreement
Mean Δ − 2 SD
(95% CI) Upper Limit of Agreement
Mean Δ + 2 SD
(95% CI) Lower Limit of Agreement
Mean Δ − 2 SD
(95% CI) Upper Limit of Agreement
Mean Δ + 2 SD
(95% CI) Volpara −368.1 (−431.6 to −315.1) 373.0 (320.0 to 436.5) −75.7 (−83.9 to −68.9) 51.8 (45.1 to 60.1) −8.2% (−9.3 to −7.3) 7.4% (6.6 to 8.5) Quantra −445.1 (−524.0 to 379.2) 487.5 (421.5 to 566.4) −68.4 (−82.2 to −56.9) 137.7 (126.2 to 151.5) −7.0% (−8.5 to −5.7) 14.9% (13.6 to 16.5)
Comparison Mean Difference in Measurement Discrepancy (95% CI) P Value
Ho: Mean Δ Volpara = Mean Δ Quantra Mean Difference in Measurement Discrepancy (95% CI) P Value
Ho: Mean Δ Volpara = Mean Δ Quantra Mean Difference in Measurement Discrepancy (95% CI) P Value
Ho: Mean Δ Volpara = Mean Δ Quantra Volpara–Quantra 18.7 (0 to 37.5) 0.05 46.6 (37.2 to 56.0) <0.001 4.4% (3.3 to 5.4 %) <0.001
CI, confidence interval; MRI, magnetic resonance imaging; SD, standard deviation.
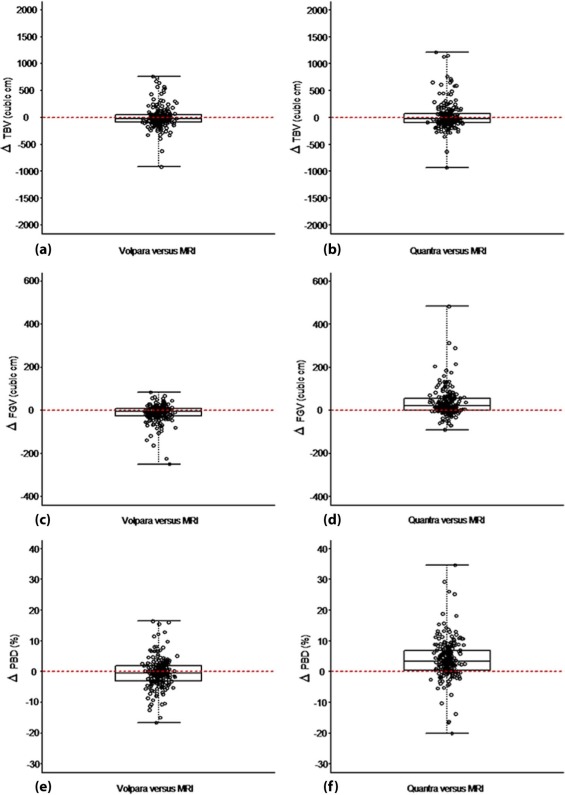
![Figure 2, Volpara (a, c, e) and Quantra (b, d, f) Bland-Altman summary for TBV ( top ), FGV ( middle ), and PBD (bottom) measurement agreement. Red line identifies the mean measurement discrepancy between the Volpara and Quantra algorithms and MRI. Blue lines identify the lower and upper 95% Bland-Altman limits of agreement. Green lines identify the 95% confidence interval for the limits of interest. Black lines indicate the slope of the regression of the mammographic measurement discrepancy onto the MRI values. For TBV, the slope of this relationship was 0.135 (95% CI: [0.075, 0.194], p < 0.001) for Volpara and 0.199 (95% CI: 0.123 to 0.275, P < 0.001) for Quantra, indicating that both sets of TBV discrepancies were positively associated with the TBV measurements of MRI. For FGV, the slope of this relationship was −0.446 (95% CI: −0.488 to −0.404, P < 0.001) for Volpara and 0.174 (95% CI: 0.062 to 0.286, P = 0.002) for Quantra, indicating that there was a negative association between for the Volpara FGV measurement discrepancies and MRI FGV, whereas there was a positive association between for the Quantra FGV measurement discrepancies and MRI FGV. For PBD, the slope of this relationship was −0.278 (95% CI: −0.365 to −0.190, P < 0.001) for Volpara and −0.213 (95% CI: −0.335 to −0.89, P = 0.001) for Quantra, indicating that both sets of PBD measurement discrepancies were negatively associated with the PBD measurements of MRI. CI, confidence interval; FGV, fibroglandular volume; MRI, magnetic resonance imaging; PBD, percent breast density; TBV, total breast volume.](https://storage.googleapis.com/dl.dentistrykey.com/clinical/AutomatedVolumetricMammographicBreastDensityMeasurementsMayUnderestimatePercentBreastDensityforHighdensityBreasts/1_1s20S1076633217302775.jpg)
Get Radiology Tree app to read full this article<
FGV: MRI vs Volpara and Quantra Algorithms
Get Radiology Tree app to read full this article<
PBD: MRI vs Volpara and Quantra Algorithms
Get Radiology Tree app to read full this article<
PBD: Volpara vs Quantra
Get Radiology Tree app to read full this article<
Get Radiology Tree app to read full this article<
Discussion
Get Radiology Tree app to read full this article<
Get Radiology Tree app to read full this article<
Get Radiology Tree app to read full this article<
Get Radiology Tree app to read full this article<
Get Radiology Tree app to read full this article<
Get Radiology Tree app to read full this article<
Get Radiology Tree app to read full this article<
References
1. Carney P.A., Miglioretti D.L., Yankaskas B.C., et. al.: Individual and combined effects of age, breast density, and hormone replacement therapy use on the accuracy of screening mammography. Ann Intern Med 2003; 138: pp. 168-175.
2. Kerlikowske K., Hubbard R.A., Miglioretti D.L., et. al.: Comparative effectiveness of digital versus film-screen mammography in community practice in the United States. Ann Intern Med 2011; 155: pp. 493-502.
3. Byrne C., Schairer C., Wolfe J., et. al.: Mammographic features and breast cancer risk: effects with time, age, and menopause status. J Natl Cancer Inst 1995; 87: pp. 1622-1629.
4. Boyd N.F., Lockwood G.A., Byng J.W., et. al.: Mammographic densities and breast cancer risk. Cancer Epidemiol Biomarkers Prev 1998; 7: pp. 1133-1144.
5. Harvey J.A., Bovbjerg V.E.: Quantitative assessment of mammographic breast density: relationship with breast cancer risk. Radiology 2004; 230: pp. 29-41.
6. Boyd N.F., Guo H., Martin L.J., et. al.: Mammographic density and the risk and detection of breast cancer. N Engl J Med 2007; 356: pp. 227-236.
7. American College of Radiology : Breast imaging reporting and data system (BI-RADS).4th ed.2003.American College of RadiologyReston, VA
8. D’Orsi C.J., Sickles E.A., Mendelson E.B., et. al.: ACR BI-RADS® atlas, breast imaging reporting and data system.5th ed.2013.American College of RadiologyReston, Virginia
9. Harvey J.A., Gard C.C., Miglioretti D.L., et. al.: Reported mammographic density: film-screen versus digital acquisition. Radiology 2013; 266: pp. 752-758.
10. Nicholson B.T., LoRusso A.P., Smolkin M., et. al.: Accuracy of assigned BI-RADS breast density category definitions. Acad Radiol 2006; 13: pp. 1143-1149.
11. Ko S.Y., Kim E.K., Kim M.J., et. al.: Mammographic density estimation with automated volumetric breast density measurement. Korean J Radiol 2014; 15: pp. 313-321.
12. Irshad A., Leddy R., Ackerman S., et. al.: Effects of changes in BI-RADS density assessment guidelines (fourth versus fifth edition) on breast density assessment: intra- and interreader agreements and density distribution. AJR Am J Roentgenol 2016; 207: pp. 1366-1371.
13. Byng J.W., Yaffe M.J., Jong R.A., et. al.: Analysis of mammographic density and breast cancer risk from digitized mammograms. Radiographics 1998; 18: pp. 1587-1598.
14. Alonzo-Proulx O., Packard N., Boone J.M., et. al.: Validation of a method for measuring the volumetric breast density from digital mammograms. Phys Med Biol 2010; 55: pp. 3027-3044.
15. Alonzo-Proulx O., Jong R.A., Yaffe M.J.: Volumetric breast density characteristics as determined from digital mammograms. Phys Med Biol 2012; 57: pp. 7443-7457.
16. Alonzo-Proulx O., Mawdsley G.E., Patrie J.T., et. al.: Reliability of automated breast density measurements. Radiology 2015; 275: pp. 366-376.
17. Eng A., Gallant Z., Shepherd J., et. al.: Digital mammographic density and breast cancer risk: a case-control study of six alternative density assessment methods. Breast Cancer Res 2014; 16: pp. 439.
18. Brandt K.R., Scott C.G., Ma L., et. al.: Comparison of clinical and automated breast density measurements: implications for risk prediction and supplemental screening. Radiology 2016; 279: pp. 710-719.
19. D’Orsi C.J., Sickles E.A.: To seek perfection or not? That is the question. Radiology 2012; 265: pp. 9-11.
20. Kopans D.B.: Basic physics and doubts about relationship between mammographically determined tissue density and breast cancer risk1. Radiology 2008; 246: pp. 348-353.
21. Lee N.A., Rusinek H., Weinreb J., et. al.: Fatty and fibroglandular tissue volumes in the breasts of women 20–83 years old: comparison of X-ray mammography and computer-assisted MR imaging. AJR Am J Roentgenol 1997; 168: pp. 501-506.
22. Gubern-Merida A., Kallenberg M., Platel B., et. al.: Volumetric breast density estimation from full-field digital mammograms: a validation study. PLoS ONE 2014; 9: e85952
23. Wang J., Azziz A., Fan B., et. al.: Agreement of mammographic measures of volumetric breast density to MRI. PLoS ONE 2013; 8: e81653
24. van Engeland S., Snoeren P.R., Huisman H., et. al.: Volumetric breast density estimation from full-field digital mammograms. IEEE Trans Med Imaging 2006; 25: pp. 273-282.
25. Wei J., Chan H.P., Helvie M.A., et. al.: Correlation between mammographic density and volumetric fibroglandular tissue estimated on breast MR images. Med Phys 2004; 31: pp. 933-942.
26. Oliver A., Llado X., Perez E., et. al.: A statistical approach for breast density segmentation. J Digit Imaging 2010; 23: pp. 527-537.
27. Gubern-Merida A., Kallenberg M., Mann R.M., et. al.: Breast segmentation and density estimation in breast MRI: a fully automatic framework. IEEE J Biomed Health Inform 2015; 19: pp. 349-357.
28. Tustison N.J., Avants B.B., Cook P.A., et. al.: N4ITK: improved N3 bias correction. IEEE Trans Med Imaging 2010; 29: pp. 1310-1320.
29. Avants B.B., Tustison N.J., Wu J., et. al.: An open source multivariate framework for n-tissue segmentation with evaluation on public data. Neuroinformatics 2011; 9: pp. 381-400.
30. Yushkevich P.A., Piven J., Hazlett H.C., et. al.: User-guided 3D active contour segmentation of anatomical structures: significantly improved efficiency and reliability. Neuroimage 2006; 31: pp. 1116-1128.
31. Hartman K., Highnam R., Warren R., et. al.: Volumetric assessment of breast tissue composition from FFDM images.2008.SpringerNew Yorkpp. 33-39.
32. Aitken Z., McCormack V.A., Highnam R.P., et. al.: Screen-film mammographic density and breast cancer risk: a comparison of the volumetric standard mammogram form and the interactive threshold measurement methods. Cancer Epidemiol Biomarkers Prev 2010; 19: pp. 418-428.
33. Yaffe M.: Mammographic density. Measurement of mammographic density. Breast Cancer Res 2008; 10: pp. 209.
34. Bland J.M., Altman D.G.: Measuring agreement in method comparison studies. Stat Methods Med Res 1999; 8: pp. 135-160.
35. Zou G.Y.: Confidence interval estimation for the Bland-Altman limits of agreement with multiple observations per individual. Stat Methods Med Res 2013; 22: pp. 630-642.
36. Lehmann E., Casella G.: Theory of point estimation.2nd ed.1998.SpringerNew York
37. Fleiss J., Shrout P.: Approximate interval estimation for a certain intraclass correlation coefficient. Psychometrika 1978; 43: pp. 259-262.
38. Are You Dense Advocacy : Are You Dense Advocacy. Available at http://areyoudenseadvocacy.org/ Accessed April 1, 2017; 04/21