
Rationale and Objectives
Selecting the optimal phase for coronary artery evaluation can be challenging, especially at higher heart rates, given that the optimal phase may differ for each of the coronary arteries. This study aimed to evaluate a novel vessel-specific algorithm which automatically outputs the minimum motion phase per coronary artery.
Materials and Methods
The study included 44 patients who underwent 256-slice cardiac computed tomography for evaluation of chest pain. End-systolic and mid-diastolic minimal motion phases were automatically calculated by a previously validated global motion algorithm and by a new vessel-specific algorithm which calculates the minimum motion for each of the three main coronary arteries, separately. Two readers blindly evaluated all coronary segments for image quality. Median scores per coronary artery were compared by the Wilcoxon signed rank test.
Results
The variation, per patient, between the optimal phases of the three coronary arteries was 5.0 ± 4.5% (1%–22%) for end systole and 4.8 ± 4.1% (0%–19%) for mid diastole. The mean image quality scores per coronary artery were 4.0 ± 0.61 for the vessel-specific approach and 3.80 ± 0.69 for the global phase selection ( P < .001). Overall, 46 of 122 arteries had a better score with the vessel-specific approach and five with the standard global approach. Interreader agreement was substantial ( k = 0.72).
Conclusions
This study has shown that multiple phases are required to ensure optimal image quality for all three coronary arteries and that a vessel-specific phase selection algorithm achieves superior results to the standard global approach.
Interpretation of computed tomography coronary angiography (CTCA) is usually performed on a single phase of the cardiac cycle. The optimal phase is usually selected empirically or with help of various automatic algorithms. However, it has been shown that the optimal quiet phase often differs for each coronary artery, especially at higher heart rates .
To avoid motion artifacts, CTCA image analysis is performed on the phase(s) with the least cardiac motion; however, there is currently no consensus concerning the selection of phases with the least cardiac motion. Several studies have attempted to determine the optimal cardiac quiescent phase , but definition of population-based quiescent phases is challenging because of high interpatient variability and significant heart rate dependency. Furthermore, the electrocardiographic (ECG) waveform by which CTCA acquisition is synchronized does not always adequately represent cardiac motion.
Get Radiology Tree app to read full this article<
Get Radiology Tree app to read full this article<
Get Radiology Tree app to read full this article<
Get Radiology Tree app to read full this article<
Materials and methods
Get Radiology Tree app to read full this article<
Data Acquisition
Get Radiology Tree app to read full this article<
Automated Global Phase Selection
Get Radiology Tree app to read full this article<
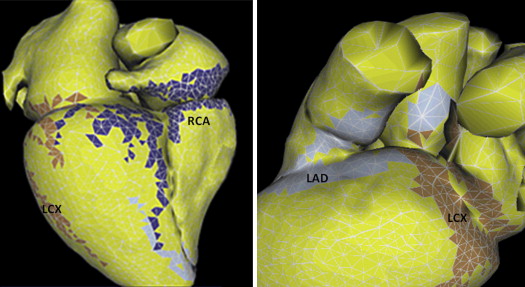
Automated Vessel-Specific Phase selection
Get Radiology Tree app to read full this article<
Get Radiology Tree app to read full this article<
Image Reconstructions
Get Radiology Tree app to read full this article<
Get Radiology Tree app to read full this article<
Get Radiology Tree app to read full this article<
Get Radiology Tree app to read full this article<
Image Quality Assessment
Get Radiology Tree app to read full this article<
Get Radiology Tree app to read full this article<
Statistical Analysis
Get Radiology Tree app to read full this article<
Get Radiology Tree app to read full this article<
Results
Get Radiology Tree app to read full this article<
Get Radiology Tree app to read full this article<
Optimal Phase Calculation
Get Radiology Tree app to read full this article<
Get Radiology Tree app to read full this article<
Table 1
The Mean ± Standard Deviation, Range, and Deviation of the Quiet Phases (Percent of R-R Interval) Obtained by the Vessel-Specific and the Standard Global Algorithms for Each of the Coronary Arteries
Artery Vessel-Specific ES Global ES Vessel-Specific ED Global ED ES Phase Deviation ∗ MD Phase Deviation ∗ LAD 39.2 ± 4.3 38.7 ± 7.2 77.4 ± 5.1 74.0 ± 7.5 4.7 ± 4.7 7.0 ± 5.7 LCx 40.1 ± 4.9 38.7 ± 7.2 76.2 ± 4.6 74.0 ± 7.5 5.9 ± 6.6 5.9 ± 5.2 RCA 41.1 ± 5.5 38.7 ± 7.2 75.3 ± 4.5 74.0 ± 7.5 5.5 ± 5.5 5.5 ± 5.6 All 40.1 ± 4.9 38.7 ± 7.1 76.3 ± 4.8 74.0 ± 7.4 5.4 ± 5.6 6.1 ± 5.5
ED, end diastole; ES, end systole; LAD, left anterior descending artery; LCx, left circumflex artery; MD, mid diastole; RCA, right coronary artery.
Get Radiology Tree app to read full this article<
Get Radiology Tree app to read full this article<
Get Radiology Tree app to read full this article<
Image Quality Evaluation
Get Radiology Tree app to read full this article<
Table 2
Comparison of Image Quality Scores for the Two Approaches for Various Subgroups
Subgroup Standard Vessel-Specific Vessel-Specific Better Standard Better Equal_P_ Value All 3.80 ± 0.69 4.00 ± 0.61 46 5 71 .000 ES 3.35 ± 0.69 3.58 ± 0.68 54 5 63 .000 MD 3.53 ± 0.87 3.77 ± 0.70 50 12 60 .000 HR < 65 4.05 ± 0.56 4.22 ± 0.47 13 3 35 .005 HR > 65 3.61 ± 0.71 3.84 ± 0.66 33 2 36 .000 Age <60 years 3.68 ± 0.82 3.87 ± 0.72 22 1 13 .005 Age >60 years 3.85 ± 0.62 4.05 ± 0.55 49 4 33 .000 LAD 4.04 ± 0.62 4.17 ± 0.54 14 3 24 .011 LCx 3.52 ± 0.70 3.69 ± 0.64 14 2 24 .007 RCA 3.83 ± 0.65 4.12 ± 0.56 18 0 23 .000 No Ca 3.65 ± 0.80 3.86 ± 0.69 15 1 26 .002 Minimal Ca 3.89 ± 0.55 4.20 ± 0.54 15 0 13 .001 Prominent Ca 3.81 ± 0.65 3.98 ± 0.57 14 2 26 .003
Ca, calcium; ED, end diastole; ES, end systole; HR, heart rate; LAD, left anterior descending artery; LCx, left circumflex artery; MD, mid diastole; RCA, right coronary artery.
Get Radiology Tree app to read full this article<
Get Radiology Tree app to read full this article<
Get Radiology Tree app to read full this article<
Reader Agreement
Get Radiology Tree app to read full this article<
Discussion
Get Radiology Tree app to read full this article<
Get Radiology Tree app to read full this article<
Get Radiology Tree app to read full this article<
Get Radiology Tree app to read full this article<
Get Radiology Tree app to read full this article<
References
1. Wang Y., Vidan E., Bergman G.W.: Cardiac motion of coronary arteries: variability in the rest period and implications for coronary MR angiography. Radiology 1999; 213: pp. 751-758.
2. Hoffmann M.H., Lessick J., Manzke R., et. al.: Automatic determination of minimal cardiac motion phases for computed tomography imaging: initial experience. Eur Radiol 2006; 16: pp. 365-373.
3. Leschka S., Husmann L., Desbiolles L.M., et. al.: Optimal image reconstruction intervals for non-invasive coronary angiography with 64-slice CT. Eur Radiol 2006; 16: pp. 1964-1972.
4. Ferencik M., Nomura C.H., Maurovich-Horvat P., et. al.: Quantitative parameters of image quality in 64-slice computed tomography angiography of the coronary arteries. Eur J Radiol 2006; 57: pp. 373-379.
5. Mok G.S., Yang C.C., Chen L.K., et. al.: Optimal systolic and diastolic image reconstruction windows for coronary 256-slice CT angiography. Acad Radiol 2010; 17: pp. 1386-1393.
6. Manzke R., Kohler T., Nielsen T., et. al.: Automatic phase determination for retrospectively gated cardiac CT. Med Phys 2004; 31: pp. 3345-3362.
7. Joemai R.M., Geleijns J., Veldkamp W.J., et. al.: Automated cardiac phase selection with 64-MDCT coronary angiography. AJR Am J Roentgenol 2008; 191: pp. 1690-1697.
8. Ruzsics B., Gebregziabher M., Lee H., et. al.: Coronary CT angiography: automatic cardiac-phase selection for image reconstruction. Eur Radiol 2009; 19: pp. 1906-1913.
9. Seifarth H., Puesken M., Wienbeck S., et. al.: Automatic selection of optimal systolic and diastolic reconstruction windows for dual-source CT coronary angiography. Eur Radiol 2009; 19: pp. 1645-1652.
10. Vembar M., Garcia M.J., Heuscher D.J., et. al.: A dynamic approach to identifying desired physiological phases for cardiac imaging using multislice spiral CT. Med Phys 2003; 30: pp. 1683-1693.
11. Peters J., Ecabert O., Schmitt H., et. al.: Local cardiac wall motion estimation from retrospectively gated CT images functional imaging and modeling of the heart.Ayache N.Delingette H.Sermesant M.2009.Springer Berlin/Heidelbergpp. 191-200.
12. Schmitt H., Peters J., Lessick J., et. al.: Spatially resolved automatic cardiac rest phase determination in coronary computed tomography angiography (CTA) World Congress on Medical Physics and Biomedical Engineering, September 7–12, 2009.Dössel O.Schlegel W.C.2009.Springer Berlin HeidelbergMunich, Germany:pp. 162-165.
13. Manzke R., Grass M., Nielsen T., et. al.: Adaptive temporal resolution optimization in helical cardiac cone beam CT reconstruction. Med Phys 2003; 30: pp. 3072-3080.
14. Ecabert O., Peters J., Schramm H., et. al.: Automatic model-based segmentation of the heart in CT images. IEEE Trans Med Imaging 2008; 27: pp. 1189-1201.
15. Ecabert O., Peters J., Walker M.J., et. al.: Segmentation of the heart and great vessels in CT images using a model-based adaptation framework. Med Image Anal 2011; 15: pp. 863-876.
16. Raff G.L., Abidov A., Achenbach S., et. al.: SCCT guidelines for the interpretation and reporting of coronary computed tomographic angiography. J Cardiovasc Comput Tomogr 2009; 3: pp. 122-136.