
Rationale and Objectives
We introduce a new approach to the prediction of final infarct growth in human acute ischemic stroke based on image analysis of the apparent diffusion coefficient (ADC) maps obtained from magnetic resonance imaging. Evidence from multiple previous studies indicate that ADC maps are likely to reveal brain regions belonging to the ischemic penumbra, that is, areas that may be at risk of infarction in the few hours following stroke onset.
Materials and Methods
In a context where “time is brain,” and contrarily to the alternative—and still-debated—perfusion-diffusion weighted image (PWI/DWI) mismatch approach, the DWI magnetic resonance sequences are standardized, fast to acquire, and do not necessitate injection of a contrast agent. The image analysis approach presented here consists of the segmentation of the ischemic penumbra using a fast three-dimensional region-growing technique that mimics the growth of the infarct lesion during acute stroke.
Results
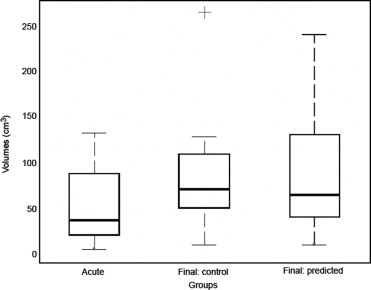
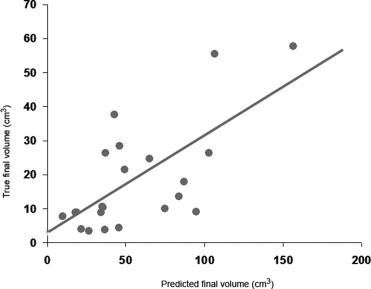
The method was evaluated with both numerical simulations and on two groups of 20 ischemic stroke patients (40 patients total). The first group of patient data was used to adjust the parameters of the model ruling the region-growing procedure. The second group of patient data was dedicated to evaluation purposes only, with no subsequent adjustment of the free parameters of the image-analysis procedure. Results indicate that the predicted final infarct volumes are significantly correlated with the true final lesion volumes as revealed by follow-up measurements from DWI sequences.
Conclusion
The DWI-ADC mismatch method is an encouraging fast alternative to the PWI-DWI mismatch approach to evaluate the likeliness of infarct growth during the acute stage of ischemic stroke.
In the immediate aftermath of acute ischemic stroke, estimation of the significant growth potential of radiologic abnormalities detected during the early therapeutic window is critical. In the context of the acute phase of ischemic stroke, neurologists consider that the patient outcome is ruled by a “time is brain” conception. The vascular system of the brain is segregated into a limited number of territories dedicated to blood supply. Consequently, depending on the initial locus of the occlusion within the vascular system, specific regions of the ipsilateral hemisphere will be at risk of subsequent infarct. Therefore after the initial extent of the early infarct has been identified, the neurologist needs to evaluate the functional territory at risk to anticipate any potential future functional impairment for the patient. Indeed, the final volume of the infarct—which may initially be rather small in the acute phase but might grow dramatically in the next few hours—is a central evaluation factor of stroke patients.
Prediction of the regions, and consequently functional systems, eventually involved in the infarct will influence the very choice of the most effective therapy. This is indeed critical to the delivery of thrombolytic drugs which have proven to be efficient within the initial 3 hours after infarct onset. Beyond this time window, this treatment may induce secondary bleeding, which makes it deliverable only to patients with severe infarct threat in terms of volume and functional brain areas at risk by the infarct growth ( ).
Get Radiology Tree app to read full this article<
Get Radiology Tree app to read full this article<
Get Radiology Tree app to read full this article<
Get Radiology Tree app to read full this article<
Material and method
Get Radiology Tree app to read full this article<
Patients
Get Radiology Tree app to read full this article<
Imaging Parameters
Get Radiology Tree app to read full this article<
Image Preprocessing
Get Radiology Tree app to read full this article<
Get Radiology Tree app to read full this article<
Image Analysis: Segmentation Using a Three-Dimensional Region-Growing Model
Get Radiology Tree app to read full this article<
Get Radiology Tree app to read full this article<
Get Radiology Tree app to read full this article<
Get Radiology Tree app to read full this article<
E=αRER+αVEV+αSES, E
=
α
R
E
R
+
α
V
E
V
+
α
S
E
S
,
where α R , α V , and α S are scalar tuning parameters which set the relative weights of the three energy terms in E .
Get Radiology Tree app to read full this article<
Get Radiology Tree app to read full this article<
Get Radiology Tree app to read full this article<
ER=(iINF−i¯INFσINF)2,EV=∑v∈IG(i(v)−i¯IGσIG)2,ES=∑v∈INF(Nv−N/2δ)β, E
R
=
(
i
I
N
F
−
i
¯
I
N
F
σ
I
N
F
)
2
,
E
V
=
∑
v
∈
I
G
(
i
(
v
)
−
i
¯
I
G
σ
I
G
)
2
,
E
S
=
∑
v
∈
I
N
F
(
N
v
−
N
/
2
δ
)
β
,
where i¯INF i
¯
I
N
F (respectively σ INF ) is the a priori sample average (res. standard deviation) of ADC intensity values within the final INF region; i(v) is the ADC intensity at voxel _v;_i¯IG(res.σIG) i
¯
IG
(
res
.
σ
I
G
) is also a prior on the expected ADC intensity (res. standard deviation) at the voxel level for voxels in IG ; N INF (res. N IG ) are the current counts of voxels in the INF and IG regions, respectively. E S is an Ising shape regularization functional: N is the total number of voxel neighbors (eg, 26) of running voxel v , out of which N v belong to INF . δ and β are fixed scalar parameters.
Get Radiology Tree app to read full this article<
Get Radiology Tree app to read full this article<
Results
Get Radiology Tree app to read full this article<
Table 1
Sample Statistics of ADC Intensity Values Obtained From the Initial Database ( n = 20): Region-Based (Average ADC Values and Standard Deviations for each ROI) and Voxel-Based Statistics (Sample Statistics of the Voxel Population in each ROI)
ADC Intensities (mm 2 /s) Region-Based Statistics Voxel-Based Statistics ROI CORE IG INF CORE IG INF Lesion 660 ± 69 823 ± 43 750 ± 69 690 ± 199 824 ± 174 772 ± 196 Mirror 840 ± 52 860 ± 36 851 ± 44 851 ± 167 860 ± 160 861 ± 156 Ratio 0.78 0.96 0.88 0.81 0.96 0.90
The mean ADC values of regions are further compared with the values in the contralateral healthy hemisphere and expressed as an ADC ratio.
ADC = apparent diffusion coefficient; ROI = region of interest; CORE = ischemic core; IG = infarct growth area; INF = final volume of the infarct.
Get Radiology Tree app to read full this article<
Get Radiology Tree app to read full this article<
Get Radiology Tree app to read full this article<
Get Radiology Tree app to read full this article<
![Figure 5, The method illustrated. An example of automatic prediction in a patient with initial infarct volume of 81.9 cm 3 as measured from baseline diffusion-weighted images (DWI) (a) . Final infarct volume was 130.4 cm 3 as shown from follow-up DWI scans (c) . (b) The apparent diffusion coefficient maps in pseudo-colors with the predicted final infarct volume contoured in black. (d) The mask of the final infarct volume [blue, (darker gray in black and white)] is superimposed to the follow-up DWI. True (res. predicted) infarct growth was 48.5 cm 3 (res. 68.0 cm 3 ) for this patient.](https://storage.googleapis.com/dl.dentistrykey.com/clinical/AutomaticPredictionofInfarctGrowthinAcuteIschemicStrokefromMRApparentDiffusionCoefficientMaps/4_1s20S1076633207003972.jpg)
Get Radiology Tree app to read full this article<
Get Radiology Tree app to read full this article<
Discussion
Get Radiology Tree app to read full this article<
Get Radiology Tree app to read full this article<
Conclusion
Get Radiology Tree app to read full this article<
Get Radiology Tree app to read full this article<
References
1. Linfante I., Akkawi N.M.: Advances in treatment of acute ischemic stroke. Curr Neurol Neurosci Rep 2006; 6: pp. 28-32.
2. Warach S.: Tissue Viability thresholds in acute stroke: the 4-factor model. Stroke 2001; 32: pp. 2460-2461.
3. Gass A., Hirsch J.G., Behrens S., et. al.: Exemplary studies on diffusion and perfusion weighted magnetic resonance imaging in acute neurological disease. Electromedica 2000; 68: pp. 106-111.
4. Connelly A., Calamante F., Porter D.A., et. al.: Case study on diffusion and perfusion magnetic resonance imaging in childhood stroke. Electromedica 2000; 68: pp. 2-8.
5. Shaefer P.W., Ozsunar Y., He J., et. al.: Assessing tissue viability with MR diffusion and perfusion imaging. AJNR Am J Neuroradiol 2003; 24: pp. 436-446.
6. Nagesh V., Welch K.M.A., Windham J.P., et. al.: Time course of ADC w changes in ischemic stroke: beyond the human eye!”. Stroke 1998; 29: pp. 1778-1782.
7. Oppenheim C., Samson Y., Manaï R., et. al.: Prediction of malignant middle cerebral artery infarction by diffusion-weighted imaging. Stroke 2000; 31: pp. 2175-2181.
8. Oppenheim C., Stanescu R., Dormont D., et. al.: Diffusion MRI and cerebral ischemia. J Neuroradiol 1999; 26: pp. 242-248.
9. Na D.G., Thijs V.N., Albers G.W., et. al.: Diffusion-weighted MR imaging in acute ischemia value of apparent diffusion coefficient and signal intensity thresholds in predicting tissue at risk and final infarct size. AJNR Am J Neuroradiol 2004; 25: pp. 1331-1336.
10. Fiebach J.B., Jansen O., Schellinger P.D., et. al.: Serial analysis of the apparent diffusion coefficient time course in human stroke. Neuroradiology 2002; 44: pp. 294-298.
11. Oppenheim C., Grandin C., Samson Y., et. al.: Is there an apparent diffusion coefficient threshold in predicting tissue viability in hyperacute stroke?. Stroke 2001; 32: pp. 2486-2491.
12. Rojas S., Martín A., Justicia C., et. al.: Modest MRI signal intensity changes precede delayed cortical necrosis after transient focal ischemia in the rat. Stroke 2006; 37: pp. 1525-1532.
13. Chupin M., Mukuna-Bantumbakulud R., Hasboun D., et. al.: Anatomically-constrained region deformation for the automated segmentation of the hippocampus and the amygdala: method and validation on controls and patients with Alzheimer’s disease. NeuroImage 2007; 34: pp. 996-1019.
14. Li W., Tian J., Li E., et. al.: Robust unsupervised segmentation of infarct lesion from diffusion tensor MR images using multiscale statistical classification and partial volume voxel reclassification. NeuroImage 2004; 23: pp. 1507-1518.
15. Cosnard G., Duprez T., Grandin C., et. al.: Imagerie de diffusion et de perfusion par résonance magnétique de l’encéphale. Louvain Med 1999; 118: pp. 129-140.