
Rationale and Objectives
Quantitative analysis of white matter hyperintensities (WMHs) on fluid-attenuated inversion recovery (FLAIR) images provides information for disease tracking, therapeutic efficacy assessment, and cognitive science research. This study developed an automatic segmentation method to detect and quantify WMHs on FLAIR images. This study aims to assess the accuracy and reproducibility of the proposed method.
Materials and Methods
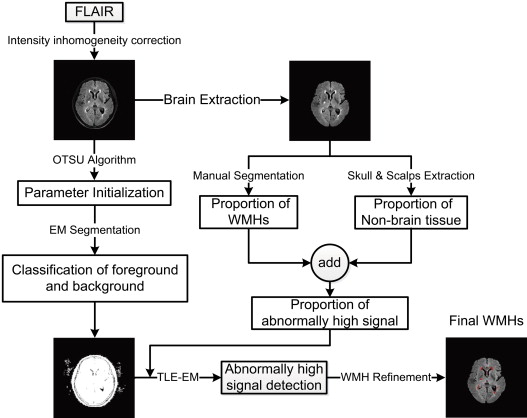
The FLAIR images of 82 patients (58–84 years) with different WMH burdens were acquired with the same 3T scanner (Intera-achieva SMI-2.1; Philip Medical System, Sixth Affiliated People’s Hospital, Shanghai, China). The FLAIR images were preprocessed through brain extraction and intensity inhomogeneity correction. An anatomy atlas built from a set of 20 patients with different WMH burdens (mild, 11 patients; moderate, 6 patients; and severe, 3 patients) was used to estimate a control parameter in the framework of segmentation. The general flow for WMH segmentation included classification of foreground and background regions, detection of abnormally high signals, and WMH refinement. The performance of automatic segmentation was evaluated by a volumetric comparison with manual segmentation on patients with different WMH burdens.
Results
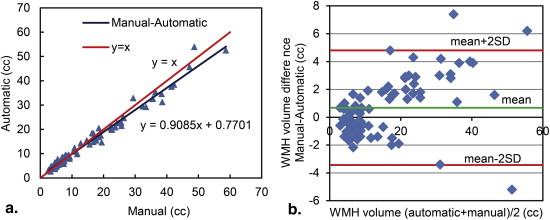
Similarity index values for the accuracy of automatic segmentation compared to manual segmentation were consistently high for patients with different WMH burdens (mild, 0.78 ± 0.08; moderate, 0.83 ± 0.06; severe, 0.84 ± 0.08; and total, 0.80 ± 0.08). Linear regression demonstrated a strong correlation between the WMH volumes measured by the two methods in all patients ( r = 0.98, P = .006). Small average differences were detected between the WMH volumes obtained through manual and automatic segmentations (mild, 4.76%; moderate, 6.84%; and severe, 7.59%). The results of Bland–Altman analysis show a system bias of 0.68 cm 3 and a standard deviation of 2.10 cm 3 over the range of 2.58–53.9 cm 3 .
Conclusions
The developed method is accurate and efficient in detecting and quantifying differently sized WMHs on FLAIR images. Automatic segmentation is a promising computer-aided diagnostic tool to study WMHs in aging and dementia in basic research and even in clinical trials.
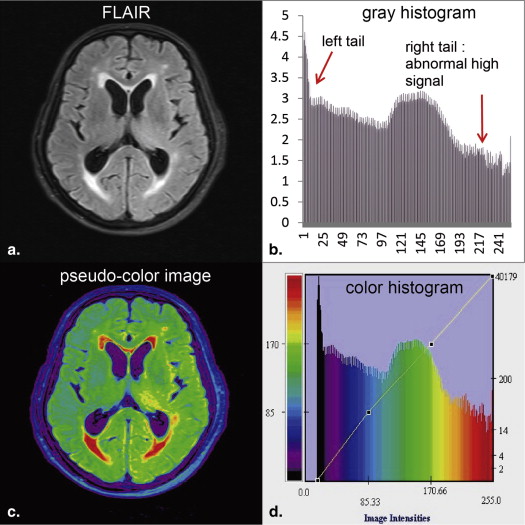
White matter hyperintensities (WMHs) are focal or diffuse lesions of high signals commonly found in the cerebral white matter (WM) on T 2 -weighted (T 2 -w) and fluid-attenuated inversion recovery (FLAIR) magnetic resonance (MR) images . The pathologic mechanism of WMHs remains unclear, but the lesions are suggested to be associated with age, demyelination, gliosis, and stroke . The typical clinical manifestations of WMHs include cognitive dysfunctions, movement disorder, and depressive symptoms . Both T 2 -w sequences and FLAIR are used to detect WMHs. FLAIR sequence exhibits a better effect than T 2 -w images when imaging WMHs near cerebrospinal fluid (CSF) spaces because it suppresses high CSF signals by adopting a long inversion time . Moreover, the contrast between WM and gray matter (GM) is reduced on FLAIR images for the elderly population, thereby producing a homogeneous low background signal and making WMHs prominent .
Accurate detection of WMHs contributes to measuring the number and volume of lesions for disease tracking, therapeutic efficacy assessment, and cognitive science research. WMHs correlate with an increased risk of stroke, dementia, and death . The issue of whether different WMH volumes are associated with cognitive dysfunctions and movement disorder has been discussed widely and constantly . Qualitative and quantitative analyses of MR images have been used to assess the lesion load of these signal abnormalities. Qualitative analysis is performed by an experienced radiologist using different visual rating scales, but the results are often affected by subjective factors and ceiling effects . Quantitative analysis methods, including manual and automatic segmentation, provide information on WMH volume . Although manual segmentation is the gold standard for validating other segmentation methods, this technique is labor intensive and time consuming. Automatic segmentation is based on machine learning and pattern recognition technique; it combines various feature selections and classification methods to detect WMHs accurately and effectively. Fuzzy connectedness and threshold-based technique are commonly used in different automatic segmentation methods. Automatic segmentation is completely reproducible, whereas manual segmentation often suffers from intra-and inter-expert variability .
Get Radiology Tree app to read full this article<
Get Radiology Tree app to read full this article<
Materials and methods
Subjects and Image Acquisition
Get Radiology Tree app to read full this article<
Get Radiology Tree app to read full this article<
Data Preparation
Get Radiology Tree app to read full this article<
Image Preprocessing
Get Radiology Tree app to read full this article<
Segmentation Method
Get Radiology Tree app to read full this article<
Get Radiology Tree app to read full this article<
Get Radiology Tree app to read full this article<
Get Radiology Tree app to read full this article<
Classification of Foreground and Background Regions
Get Radiology Tree app to read full this article<
φ(yi;xi)=∑kj=1πjψ(yi;xi,μj,σj) φ
(
y
i
;
x
i
)
=
∑
j
=
1
k
π
j
ψ
(
y
i
;
x
i
,
μ
j
,
σ
j
)
where ψ ( y__i ; x__i , μ j , σ j ) denotes the PDF of a Gaussian distribution with unknown parameters, including the mean μ j , standard deviation σ j , and proportion of the j th classifier π j . Each Gaussian in GMM provides a probabilistic model for a specific tissue class in the FLAIR images. x__j is a discrete label that represents the classification of voxel y__i with respect to the two tissue classes ( k = 2), namely, foreground and background. In the EM algorithm, unknown parameters must be properly initialized using the Otsu method . Specifically, we first used the Otsu method to classify the FLAIR images into two parts, namely, the foreground and background regions. μ(0)j μ
j
(
0
) and σ(0)j σ
j
(
0
) were then initialized using the mean values and standard deviations of these preclassified regions. Furthermore, we computed the proportions of the foreground and background regions with respect to the images as a whole. These proportions were used to initialize the parameters π(0)j π
j
(
0
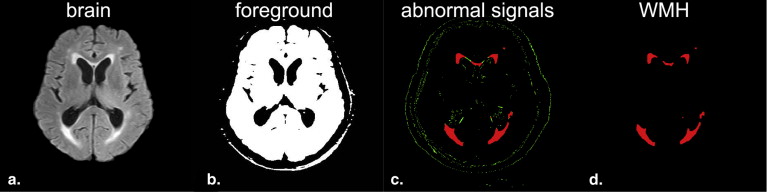
) . With these initial starting values, the EM algorithm estimates MLE parameters by iteratively performing expectation (E) and maximization (M) steps. The former step creates an expectation function of log likelihood using the estimated unknown parameters. The latter step estimates the unknown parameters and maximizes the expectation function . The final GMM was estimated by MLE with the EM algorithm. The probabilities of voxel y__i assigned to the foreground and background were calculated based on Bayes posterior probability in the EM algorithm. The brain voxels were finally classified into the foreground and background regions. The corresponding PDF φ ( y__i ) for each voxel y__i was stored until used to detect abnormally high signals on the FLAIR images. The results obtained after the classification of the foreground (white) and background (black) regions are shown in Figure 3 b.
Get Radiology Tree app to read full this article<
Detection of Abnormally High Signals
Get Radiology Tree app to read full this article<
θˆTLE:=argmaxθ∈Θ∑nTi=1f(yv(i);θ) θ
ˆ
TLE
:
=
arg
max
θ
∈
Θ
∑
i
=
1
n
T
f
(
y
v
(
i
)
;
θ
)
where f(yi;θ)=logφ(yi;θ) f
(
y
i
;
θ
)
=
log
φ
(
y
i
;
θ
) is the logarithmic value of PDF for voxel y__i in a FLAIR image and f(yv(1);θ)≥f(yv(2);θ)≥⋅⋅⋅≥f(yv(nT);θ) f
(
y
v
(
1
)
;
θ
)
≥
f
(
y
v
(
2
)
;
θ
)
≥
⋅
⋅
⋅
≥
f
(
y
v
(
n
T
)
;
θ
) . The corresponding permutation of the indices is represented as v = [ v (1), …, v ( n__T )], which sorts all voxels of the FLAIR images according to the values of their probability f ( y__v ( i ) ;θ). The number of voxels for normal tissues was calculated using the trimming parameter n__T = n × (1 − h ), where n is the denoted total number of voxels in FLAIR images and h represents the proportion of abnormal high signals to the FLAIR images. The detection of abnormally high signals on FLAIR images was divided into two stages: parameter h estimation and TLE-EM segmentation.
Get Radiology Tree app to read full this article<
Stage 1: Estimation of Parameter h
Get Radiology Tree app to read full this article<
Stage 2: TLE-EM Segmentation
Get Radiology Tree app to read full this article<
Get Radiology Tree app to read full this article<
Get Radiology Tree app to read full this article<
Get Radiology Tree app to read full this article<
Get Radiology Tree app to read full this article<
Get Radiology Tree app to read full this article<
Get Radiology Tree app to read full this article<
Get Radiology Tree app to read full this article<
Get Radiology Tree app to read full this article<
Get Radiology Tree app to read full this article<
Get Radiology Tree app to read full this article<
Get Radiology Tree app to read full this article<
WMHs Refinement
Get Radiology Tree app to read full this article<
Validation of Segmentation and Quantitative Measures
Get Radiology Tree app to read full this article<
SI=2×(M∩A)M+A SI
=
2
×
(
M
∩
A
)
M
+
A
FPR=!M∩AM FPR
=
!M
∩
A
M
FNR=M∩!AM FNR
=
M
∩
!
A
M
Get Radiology Tree app to read full this article<
Get Radiology Tree app to read full this article<
Results
Volumetric Comparison Between Manual and Automatic Segmentations
Get Radiology Tree app to read full this article<
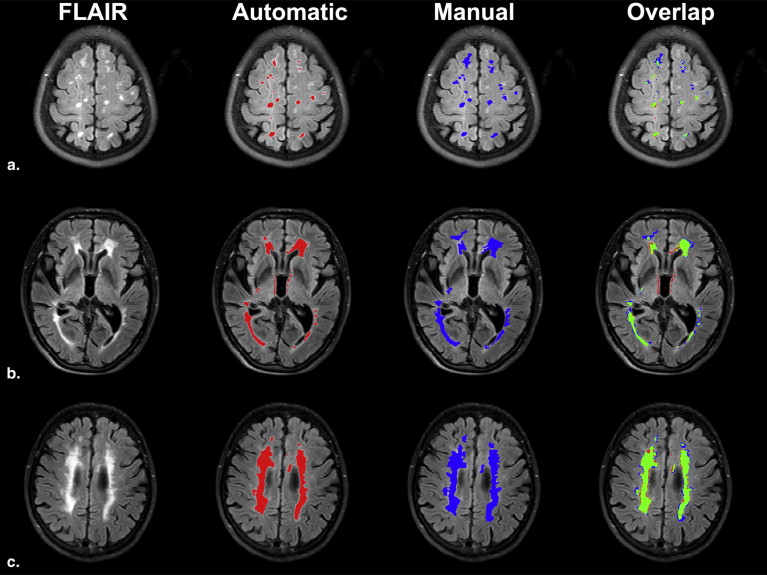
Table 1
Similarity Measurement Comparison Between Results of Automatic Segmentation and Manual Segmentation
WMH Burden SI FPR FNR Mild ( N = 44) 0.78 ± 0.08 0.26 ± 0.06 0.19 ± 0.06 Moderate ( N = 26) 0.83 ± 0.06 0.11 ± 0.06 0.21 ± 0.06 Severe ( N = 12) 0.84 ± 0.08 0.08 ± 0.06 0.22 ± 0.07 Total ( N = 82) 0.80 ± 0.08 0.19 ± 0.07 0.20 ± 0.06
FNR, false-negative rate; FPR, false-positive rate; SI, similarity index; WMH, white matter hyperintensity.
Get Radiology Tree app to read full this article<
Regression and Bland–Altman Analysis
Get Radiology Tree app to read full this article<
Table 2
Quantitative Analysis of Automated Segmentation with Respect to Manual Segmentation
WMH Burden Automatic (cm 3 ) Manual (cm 3 )R Mild ( N = 44) 6.84 ± 2.10 6.5 ± 1.96 0.91 Moderate ( N = 26) 18.83 ± 4.87 20.1 ± 4.93 0.92 Severe ( N = 12) 37.73 ± 8.51 40.7 ± 7.61 0.93 Total ( N = 82) 15.16 ± 11.69 15.84 ± 12.73 0.98
Automatic and manual refer to quantitative white matter hyperintensity (WMH) volume detected by automatic and manual segmentation methods, respectively.
Get Radiology Tree app to read full this article<
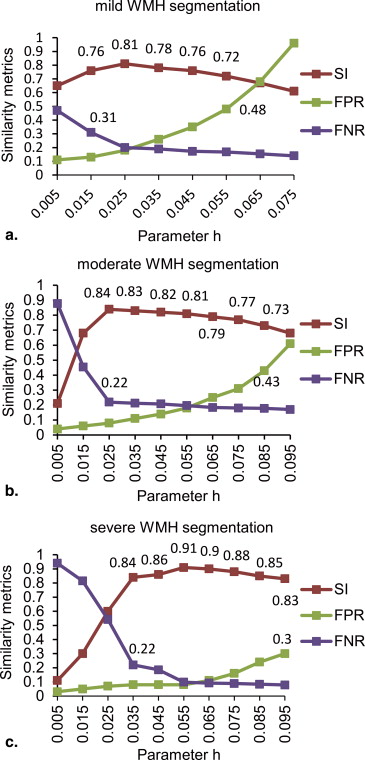
Effect of Different Parameters h Values on Automatic Segmentation of WMHs
Get Radiology Tree app to read full this article<
Get Radiology Tree app to read full this article<
Get Radiology Tree app to read full this article<
Discussion
Get Radiology Tree app to read full this article<
Get Radiology Tree app to read full this article<
Get Radiology Tree app to read full this article<
Get Radiology Tree app to read full this article<
Get Radiology Tree app to read full this article<
Get Radiology Tree app to read full this article<
Get Radiology Tree app to read full this article<
Get Radiology Tree app to read full this article<
Table 3
Comparison of Similarity Index for the WMH Segmentation Between Different Methods on Different Real Data Sets
WMH Burden Mild Moderate Severe Total TLE-EM 0.78 0.83 0.84 0.80 Anbeek et al. 0.50 0.75 0.85 0.80 Behloul et al. 0.70 0.75 0.82 0.75 Khayati et al. 0.73 0.75 0.81 0.75
EM, expectation–maximization; TLE, trimmed-likelihood estimator; WMH, white matter hyperintensity.
Get Radiology Tree app to read full this article<
Get Radiology Tree app to read full this article<
Get Radiology Tree app to read full this article<
Get Radiology Tree app to read full this article<
Conclusions
Get Radiology Tree app to read full this article<
Acknowledgments
Get Radiology Tree app to read full this article<
Get Radiology Tree app to read full this article<
References
1. de Groot J.C., Oudkerk M., Gijn Jv, et. al.: Cerebral white matter lesions and cognitive function: the Rotterdam Scan Study. Ann Neurol 2000; 47: pp. 145-151.
2. Debette S., Markus H.: The clinical importance of white matter hyperintensities on brain magnetic resonance imaging: systematic review and meta-analysis. BMJ 2010; 341: pp. c3666.
3. Silbert L., Nelson C., Howieson D., et. al.: Impact of white matter hyperintensity volume progression on rate of cognitive and motor decline. Neurology 2008; 71: pp. 108-113.
4. Barkhof F., Scheltens P.: Imaging of white matter lesions. Cerebrovas Dis 2002; 13: pp. 21-30.
5. Gerdes V.E., Kwa V.I., ten Cate H., et. al.: Cerebral white matter lesions predict both ischemic strokes and myocardial infarctions in patients with established atherosclerotic disease. Atherosclerosis 2006; 186: pp. 166-172.
6. Naka H., Nomura E., Takahashi T., et. al.: Combinations of the presence or absence of cerebral microbleeds and advanced white matter hyperintensity as predictors of subsequent stroke types. Am J Neuroradiol 2006; 27: pp. 830-835.
7. Soumaré A., Elbaz A., Zhu Y., et. al.: White matter lesions volume and motor performances in the elderly. Ann Neurol 2009; 65: pp. 706-715.
8. Scheltens P., Erkinjunti T., Leys D., et. al.: White matter changes on CT and MRI: an overview of visual rating scales. Eur Neuro 1998; 39: pp. 80-89.
9. Fazekas F., Barkhof F., Wahlund L., et. al.: CT and MRI rating of white matter lesions. Cerebrovas Dis 2002; 13: pp. 31-36.
10. Yamamoto D., Arimura H., Kakeda S., et. al.: Computer-aided detection of multiple sclerosis lesions in brain magnetic resonance images: false positive reduction scheme consisted of rule-based, level set method, and support vector machine. Comput Med Imaging Graph 2010; 34: pp. 404-413.
11. Hulsey K.M., Gupta M., King K.S., et. al.: Automated quantification of white matter disease extent at 3T: Comparison with volumetric readings. J Magn Reson Imaging 2012; 36: pp. 305-311.
12. Archip N., Jolesz F.A., Warfield S.K.: A validation framework for brain tumor segmentation. Acad Radiol 2007; 14: pp. 1242-1251.
13. Clas P., Groeschel S., Wilke M.: A semi–automatic algorithm for determining the demyelination load in metachromatic leukodystrophy. Acad Radiol 2012; 19: pp. 26-34.
14. Lao Z., Shen D., Liu D., et. al.: Computer-assisted segmentation of white matter lesions in 3D MR images using support vector machine. Acad Radiol 2008; 15: pp. 300-313.
15. García–Lorenzo D., Francis S., Narayanan S., et. al.: Review of automatic segmentation methods of multiple sclerosis white matter lesions on conventional magnetic resonance imaging. Med Image Anal 2013; 17: pp. 1-18.
16. Liu J.G., Udupa J.K., Odhner D., et. al.: A system for brain tumor volume estimation via MR imaging and fuzzy connectedness. Comput Med Imaging Graph 2005; 29: pp. 21-34.
17. Udupa J.K., Wei L., Samarasekera S., et. al.: Multiple sclerosis lesion quantification using fuzzy-connectedness principles. IEEE T Med Imaging 1997; 16: pp. 598-609.
18. Udupa J.K., Saha P.K., Lotufo R.A.: Relative fuzzy connectedness and object definition: theory, algorithms, and applications in image segmentation. IEEE T Pattern Anal 2002; 24: pp. 1485-1500.
19. Van Leemput K., Maes F., Vandermeulen D., et. al.: Automated segmentation of multiple sclerosis lesions by model outlier detection. IEEE T Med Imaging 2001; 20: pp. 677-688.
20. Zhang Y., Brady M., Smith S.: Segmentation of brain MR images through a hidden Markov random field model and the expectation-maximization algorithm. IEEE T Med Imaging 2001; 20: pp. 45-57.
21. Wells W.M., Grimson W.E.L., Kikinis R., et. al.: Adaptive segmentation of MRI data. IEEE T Med Imaging 1996; 15: pp. 429-442.
22. Neykov N., Filzmoser P., Dimova R., et. al.: Robust fitting of mixtures using the trimmed likelihood estimator. Comput Stat Data Anal 2007; 52: pp. 299-308.
23. Bricq S, Collet C, Armspach J–P. Lesions detection on 3D brain MRI using trimmed likelihood estimator and probabilistic atlas. In: Proceedings of the 5th IEEE International Symposium on Biomedical Imaging: From Nano to Macro. ISBI 2008: Paris, France, 2008;93–96.
24. Galimzianova A, Špiclin Ž, Likar B, et al. Automated segmentation of MS lesions in brain MR images using localized trimmed-likelihood estimation. In: Proc. SPIE 8669, Medical Imaging: Image Processing. Lake Buena Vista (Orlando Area), Florida, USA: 2013;86693E–86693E–86697.
25. García–Lorenzo D., Prima S., Arnold D.L., et. al.: Trimmed-likelihood estimation for focal lesions and tissue segmentation in multisequence MRI for multiple sclerosis. IEEE T Med Imaging 2011; 30: pp. 1455-1467.
26. Varela F., Lachaux J.–P., Rodriguez E., et. al.: The BrainWeb: phase synchronization and large-scale integration. Nat Rev Neurosci 2001; 2: pp. 229-239.
27. Gibson E., Gao F., Black S.E., et. al.: Automatic segmentation of white matter hyperintensities in the elderly using Flair images at 3T. J Magn Reson Imaging 2010; 31: pp. 1311-1322.
28. Sled J.G., Zijdenbos A.P., Evans A.C.: A nonparametric method for automatic correction of intensity nonuniformity in MRI data. IEEE T Med Imaging 1998; 17: pp. 87-97.
29. Smith S.M.: Fast robust automated brain extraction. Hum Brain Mapp 2002; 17: pp. 143-155.
30. Otsu N.: A threshold selection method from gray-level histograms. Automatica 1975; 11: pp. 23-27.
31. Dempster A.P., Laird N.M., Rubin D.B.: Maximum likelihood from incomplete data via the EM algorithm. J Roy Stat Soc 1977; 39: pp. 1-38.
32. Khayati R., Vafadust M., Towhidkhah F., et. al.: Fully automatic segmentation of multiple sclerosis lesions in brain MR FLAIR images using adaptive mixtures method and Markov random field model. Comput Biol Med 2008; 38: pp. 379-390.
33. Dice L.R.: Measures of the amount of ecologic association between species. Ecology 1945; 26: pp. 297-302.
34. Zijdenbos A.P., Dawant B.M., Margolin R.A., et. al.: Morphometric analysis of white matter lesions in MR images: method and validation. IEEE T Med Imaging 1994; 13: pp. 716-724.
35. Anbeek P., Vincken K.L., van Osch M.J., et. al.: Automatic segmentation of different-sized white matter lesions by voxel probability estimation. Med Image Anal 2004; 8: pp. 205-215.
36. Anbeek P., Vincken K.L., van Osch M.J., et. al.: Probabilistic segmentation of white matter lesions in MR imaging. Neuroimage 2004; 21: pp. 1037-1044.
37. de Boer R., Vrooman H.A., van der Lijn F., et. al.: White matter lesion extension to automatic brain tissue segmentation on MRI. Neuroimage 2009; 45: pp. 1151-1161.
38. Udupa J.K., LeBlanc V.R., Ying Z.G., et. al.: A framework for evaluating image segmentation algorithms. Comput Med Imaging Grap 2006; 30: pp. 75-87.
39. Altman D.G., Bland J.M.: Measurement in medicine: the analysis of method comparison studies. Stat 1983; 32: pp. 307-317.
40. Bland J.M., Altman D.G.: Measuring agreement in method comparison studies. Stat Methods Med Res 1999; 8: pp. 135-160.
41. Admiraal–Behloul F., Van Den Heuvel D., Olofsen H., et. al.: Fully automatic segmentation of white matter hyperintensities in MR images of the elderly. Neuroimage 2005; 28: pp. 607-617.
42. Madabhushi A., Udupa J.K.: Interplay between intensity standardization and inhomogeneity correction in MR image processing. IEEE T Med Imaging 2005; 24: pp. 561-576.
43. Madabhushi A., Udupa J.K.: New methods of MR image intensity standardization via generalized scale. Med Phys 2006; 33: pp. 3426-3434.
44. Zhuge Y., Udupa J.K.: Intensity standardization simplifies brain MR image segmentation. Comput Vis Image Und 2009; 113: pp. 1095-1103.
45. Nyul L.G., Udupa J.K.: On standardizing the MR image intensity scale. Magn Reson Med 1999; 42: pp. 1072-1081.
46. Nyul L.G., Udupa J.K., Zhang X.: New variants of a method of MRI scale standardization. IEEE T Med Imaging 2000; 19: pp. 143-150.