
Rationale and Objectives
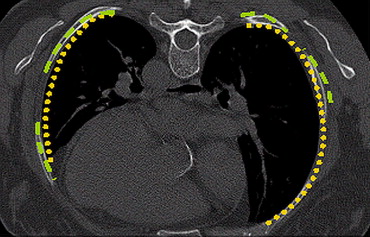
Segmentation of lungs using high-resolution computer tomographic images in the setting of diffuse lung diseases is a major challenge in medical image analysis. Threshold-based techniques tend to leave out lung regions that have increased attenuation, such as in the presence of interstitial lung disease. In contrast, streak artifacts can cause the lung segmentation to “leak” into the chest wall. The purpose of this work was to perform segmentation of the lungs using a technique that selects an optimal threshold for a given patient by comparing the curvature of the lung boundary to that of the ribs.
Methods
Our automated technique goes beyond fixed threshold-based approaches to include lung boundary curvature features. One would expect the curvature of the ribs and the curvature of the lung boundary around the ribs to be very close. Initially, the ribs are segmented by applying a threshold algorithm followed by morphologic operations. The lung segmentation scheme uses a multithreshold iterative approach. The threshold value is verified until the curvature of the ribs and the curvature of the lung boundary are closely matched. The curve of the ribs is represented using polynomial interpolation, and the lung boundary is matched in such a way that there is minimal deviation from this representation. Performance of this technique was compared with conventional (fixed threshold) lung segmentation techniques on 25 subjects using a volumetric overlap fraction measure.
Results
The performance of the rib segmentation technique was significantly different from conventional techniques with an average higher mean volumetric overlap fraction of about 5%.
Conclusions
The technique described here allows for accurate quantification of volumetric computed tomography and more advanced segmentation of abnormal areas.
High-resolution computer tomography (CT) is a valuable imaging modality for assessing lung diseases. Quantitation of the HRCT findings ( ) can be of great assistance for radiologists to assess disease severity and make diagnostic decisions. In the setting of diffuse lung diseases that represent varying radiographic patterns, it is very important to obtain accurate lung segmentation to perform more advanced image analysis for quantitation tasks.
Normal lungs show up as dark regions in computed tomographic scans. Several classical image processing techniques perform lung segmentation in CT using methods such as thresholding, morphologic filtering, region growing, etc. Such techniques rely on the contrast between the lung parenchyma and surrounding tissues to identify borders between them. However, these techniques tend to be unreliable when abnormal regions are present or in low-dose CT where streak artifacts are present. Diffuse lung disease patterns are often in the subpleural aspect of lung segments. The presence of these patterns makes the task of discriminating between the lung and pleura more difficult. CT lung density is often influenced by various factors, such as image acquisition protocol, air volume, and properties of the lung parenchyma. These factors make the selection of a fixed threshold to perform segmentation difficult, as different thresholds are required for different subjects. In earlier works, a predetermined threshold was used to separate the lungs from the surrounding anatomy using thresholds varying from −450 HU (Hounsfield units) to −550 HU ( ). However, when abnormal regions are present, a fixed threshold does not provide satisfying results.
Get Radiology Tree app to read full this article<
 Open full size image
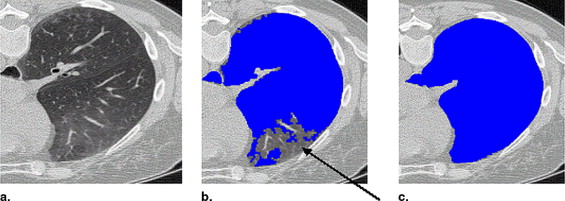
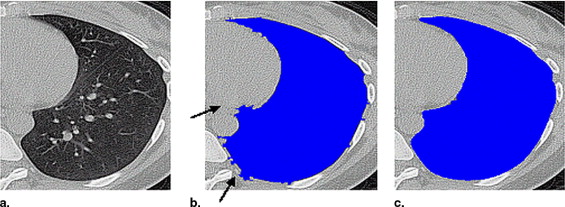
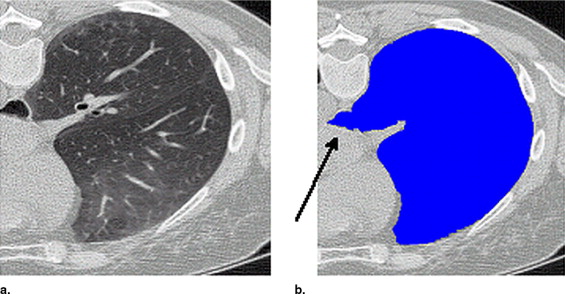
Figure 1
Threshold-based segmentation results of the lung highlighting ( a ) undersegmentation and ( b ) streak artifacts incorrectly included as shown by the arrows .
Get Radiology Tree app to read full this article<
Get Radiology Tree app to read full this article<
Get Radiology Tree app to read full this article<
Methods
Image Acquisition
Get Radiology Tree app to read full this article<
Table 1
Breakdown of the Datasets Used for Experimentation
Disease Imaging Protocol Slice Thickness (mm) Slice Spacing (mm) No. of Patients Asthma Imaged at RV 1 0.7 17 Scleroderma Imaged at TLC and RV 1.25 1.25 9 Emphysema Imaged at TLC and RV 3 3 18
RV, residual volume; TLC, total lung capacity.
Get Radiology Tree app to read full this article<
Reference Segmentation
Get Radiology Tree app to read full this article<
Adaptive Thresholding Technique
Get Radiology Tree app to read full this article<
Get Radiology Tree app to read full this article<
Get Radiology Tree app to read full this article<
y=f(x)=c0+c1(x−x1)+c2(x−x1)(x−x2)+⋯+cn(x−x1)(x−x2)⋯(x−xn) y
=
f
(
x
)
=
c
0
+
c
1
(
x
−
x
1
)
+
c
2
(
x
−
x
1
)
(
x
−
x
2
)
+
⋯
+
c
n
(
x
−
x
1
)
(
x
−
x
2
)
⋯
(
x
−
x
n
)
Get Radiology Tree app to read full this article<
Get Radiology Tree app to read full this article<
x0f(x0)x1f(x1)x2f(x2)⋮xnf(xn)f(x1)−f(x0)x1−x0f(x2)−f(x1)x2−x1⋮⋮f(x2)−f(x1)x2−x1−f(x1)−f(x0)x1−x0x2−x0⋮⋮ x
0
f
(
x
0
)
f
(
x
1
)
−
f
(
x
0
)
x
1
−
x
0
x
1
f
(
x
1
)
f
(
x
2
)
−
f
(
x
1
)
x
2
−
x
1
−
f
(
x
1
)
−
f
(
x
0
)
x
1
−
x
0
x
2
−
x
0
f
(
x
2
)
−
f
(
x
1
)
x
2
−
x
1
x
2
f
(
x
2
)
⋮
⋮
⋮
⋮
⋮
x
n
f
(
x
n
)
Get Radiology Tree app to read full this article<
Get Radiology Tree app to read full this article<
Get Radiology Tree app to read full this article<
Get Radiology Tree app to read full this article<
∑k(yrib(x)−ylung(x))2k ∑
k
(
y
r
i
b
(
x
)
−
y
l
u
n
g
(
x
)
)
2
k
where yrib(x) y
r
i
b
(
x
) and ylung(x) y
l
u
n
g
(
x
) correspond to the values obtained from the polynomial Equation 1 for a given x , and k is the number of points on the curve.
Table 2
Breakdown of Training and Test Subjects
Disease Training Subjects ( n ) Test Subjects ( n ) Asthma 10 7 Scleroderma 5 4 Emphysema 10 8
Get Radiology Tree app to read full this article<
Get Radiology Tree app to read full this article<
Get Radiology Tree app to read full this article<
Get Radiology Tree app to read full this article<
Evaluation
Get Radiology Tree app to read full this article<
O(V1,V2)=||V1∩V2||||V1∪V2||. O
(
V
1
,
V
2
)
=
||
V
1
∩
V
2
||
||
V
1
∪
V
2
||
.
Get Radiology Tree app to read full this article<
Results
Get Radiology Tree app to read full this article<
Table 3
Comparison of Volumetric Overlap Fraction Measures Using Different Lung Segmentation Techniques for Total Lung Capacity
Disease Threshold: −200 HU Threshold: −400 HU Threshold: −200 HU with Postprocessing Threshold: −400 HU with Postprocessing Adaptive Threshold (rib curvature) Scleroderma 0.76 0.79 0.81 0.81 0.83 Emphysema 0.85 0.87 0.87 0.89 0.91 Scleroderma + emphysema 0.82 0.84 0.85 0.87 0.88
HU, Hounsfield units.
Table 4
Comparison of Volumetric Overlap Fraction Using Different Lung Segmentation Techniques for Residual Volume
Disease Threshold: −200 HU Threshold: −400 HU Threshold: −200 HU with Postprocessing Threshold: −400 HU with Postprocessing Adaptive Threshold (rib curvature) Asthma 0.75 0.79 0.78 0.80 0.85 Scleroderma 0.72 0.76 0.78 0.78 0.81 Emphysema 0.82 0.84 0.84 0.85 0.87 Asthma + scleroderma + emphysema 0.77 0.80 0.81 0.82 0.85
HU, Hounsfield units.
Get Radiology Tree app to read full this article<
Get Radiology Tree app to read full this article<
Get Radiology Tree app to read full this article<
Get Radiology Tree app to read full this article<
Table 5
Comparison of the Mean Threshold Values for Each Study
Study Threshold Value (SD) Asthma RV −150 (±7) Scleroderma RV −140 (±7) Scleroderma TLC −145 (±8) Emphysema RV −515 (±3) Emphysema TLC −545 (±4)
RV, residual volume; TLC, total lung capacity.
Get Radiology Tree app to read full this article<
Discussion
Get Radiology Tree app to read full this article<
Get Radiology Tree app to read full this article<
Get Radiology Tree app to read full this article<
Get Radiology Tree app to read full this article<
Get Radiology Tree app to read full this article<
Conclusions
Get Radiology Tree app to read full this article<
Acknowledgments
Get Radiology Tree app to read full this article<
References
1. Hedlund L.W., Anderson R.F., Goulding P.L., Beck J.W., Effmann , Putman C.E.: Two methods for isolating the lung area of a CT scan for density information. El Radiology 1982; 144: pp. 353-357.
2. Kalender W.A., Fichte H., Bautz W., Skalej M.: Semiautomatic evaluation procedures for quantitative CT of the lung. J Comput Assist Tomogr 1991; 15: pp. 248-255.
3. Keller J.M., Edwards F.M., Rundle R.: Automatic outlining of regions on CT scans. J Comput Assist Tomogr 1981; 5: pp. 240-245.
4. Denison D.M., Morgan M.D., Millar A.B.: Estimation of regional gas and tissue volumes of the lung in supine man using computed tomography. Thorax 1986; 41: pp. 620-628.
5. Crevier D., Lepage R.: Knowledge-based image understanding systems: A survey. Comput Vis Image Underst 1997; 67: pp. 161-185.
6. Sonka M., Sundaramoorthy G., Hoffman E.A.: Knowledge-based segmentation of intrathoracic airways from multidimensional high resolution CT images. Proc SPIE Med Imaging 1994; 2168: pp. 73-85.
7. Brown M.S., McNitt-Gray M.F., Mankovich N.J., et. al.: Method for segmenting chest CT image data using an anatomical model: Preliminary results. IEEE Trans Med Imaging 1997; 16: pp. 828-839.
8. Brown M.S., Goldin J.G., McNitt-Gray M.F., et. al.: Knowledge-based segmentation of thoracic computed tomography images for assessment of split lung function. Med Phys 2000; 27: pp. 592-598.
9. Hu S., Hoffman E.A., Reinhardt J.A.: Automatic lung segmentation for accurate quantitation of volumetric x-ray CT images. IEEE Trans Med Imaging 2001; 20: pp. 490-498.
10. Sluimer I., Prokop M., van Ginneken B.: Toward automated segmentation of the pathological lung in CT. IEEE Trans Med Imaging 2005; 24: pp. 1025-1038.
11. Cootes T.F., Edwards G.J., Taylor C.J.: Active appearance models.1998.pp. 484-498.
12. Jain A.: Fundamentals of digital image processing.1989.Prentice-HallNew York
13. Atkinson K.: An Introduction to numerical analysis.2nd ed.1989.Prentice-HallNew York
14. Das K.: Design and implementation of an efficient thinning algorithm.2000. Bachelor of Technology Thesis, Department of Computer Science and Engineering, Indian Institute of Technology, Kanpur
15. Mitchell T.: Machine Learning.1997.McGraw–HillNew York
16. Hildebrand F.B.: Introduction to Numerical Analysis.1956.McGraw-HillNew York:pp. 43-44. 62–63
17. Prasad M.N., Sowmya A., Koch I.: Efficient feature selection based on independent component analysis.Proceedings of the 2004 Intelligent Sensors, Sensor Networks and Information Processing Conference, Melbourne, Australia.2004.pp. 427-432.
18. Prasad M.N., Sowmya A.: Multilevel emphysema diagnosis of HRCT lung images in an incremental framework. Proc SPIE 2004; 5370: pp. 42-50.
19. Xu Y., van Beek E., Hwanjo Y., Guo J., McLennan G., Hoffman E.: Computer-aided classification of interstitial lung diseases via MDCT: 3D adaptive multiple feature method (3D AMFM). Acad Radiol 2006; 13: pp. 969-978.