
Rationale and Objectives
The aim of our study was to classify breast density using areometric and volumetric automatic measurements to best match Breast Imaging-Reporting and Data System (BI-RADS) density scores, and determine which technique best agrees with BI-RADS. Second, this study aimed to provide a set of threshold values for areometric and volumetric density to estimate BI-RADS categories.
Materials and Methods
We randomly selected 537 full-field digital mammography examinations from a population-based screening program. Five radiologists assessed breast density using BI-RADS with all views available. A commercial program calculated areometric and volumetric breast density automatically. We compared automatically calculated density to all BI-RADS density thresholds using area under the receiver operating characteristic curve, and used Youden’s index to estimate thresholds in automatic densities, with matching sensitivity and specificity. The 95% confidence intervals were estimated by bootstrapping.
Results
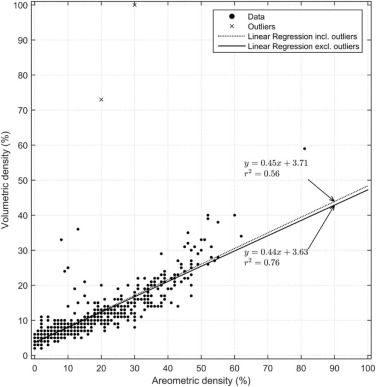
Areometric density correlated well with volumetric density (r 2 = 0.76, excluding outliers, n = 2). For the BI-RADS threshold between II and III, areometric and volumetric assessment showed about equal area under the curve (0.94 vs. 0.93). For the threshold between I and II, areometric assessment was better than volumetric assessment (0.91 vs. 0.86). For the threshold between III and IV, volumetric assessment was better than areometric assessment (0.97 vs. 0.92).
Conclusions
Volumetric assessment is equal to or better than areometric assessment for the most clinically relevant thresholds (ie, between scattered fibroglandular and heterogeneously dense, and between heterogeneously dense and extremely dense breasts). Thresholds found in this study can be applied in daily practice to automatic measurements of density to estimate BI-RADS classification.
Introduction
Dense tissue can mask breast cancer , reducing the effect of mammography screening . Further, women with dense breasts have increased breast cancer risk . Thus, some countries have breast density assessment included in the mammography screening programs. In several US states, women with dense breasts (American College of Radiology Breast Imaging-Reporting and Data System [BI-RADS] density III and IV) will by law be informed about the higher breast cancer risk and the possibility of dense tissue masking a cancer . Austria offers women with dense breasts adjunctive ultrasound in their screening program .
Several methods for breast density classification exist . Radiologist assessment using the semiquantitative BI-RADS density scale is the most common . The BI-RADS system introduced this method mainly to quantify radiologists’ concern of missing cancers because of dense breast tissue . Thus, association between breast density and diagnostic efficacy of mammography is mostly based on this scale. A major disadvantage of BI-RADS assessment is its interobserver variability . Therefore, in a personalized screening setting, a woman’s screening routine would be dependent on the radiologist’s subjective opinion of breast density.
Get Radiology Tree app to read full this article<
Get Radiology Tree app to read full this article<
Get Radiology Tree app to read full this article<
Materials and Methods
Study Material
Get Radiology Tree app to read full this article<
Imaging
Get Radiology Tree app to read full this article<
Radiologist Training
Get Radiology Tree app to read full this article<
Volumetric Density Measurements
Get Radiology Tree app to read full this article<
Get Radiology Tree app to read full this article<
Quantized Density
Get Radiology Tree app to read full this article<
Get Radiology Tree app to read full this article<
Areometric Density Measurements
Get Radiology Tree app to read full this article<
Comparison of Quantra to BI-RADS Using Receiver Operating Characteristic (ROC)
Get Radiology Tree app to read full this article<
Get Radiology Tree app to read full this article<
ROC Software
Get Radiology Tree app to read full this article<
Quantra Density Thresholds
Get Radiology Tree app to read full this article<
Get Radiology Tree app to read full this article<
Results
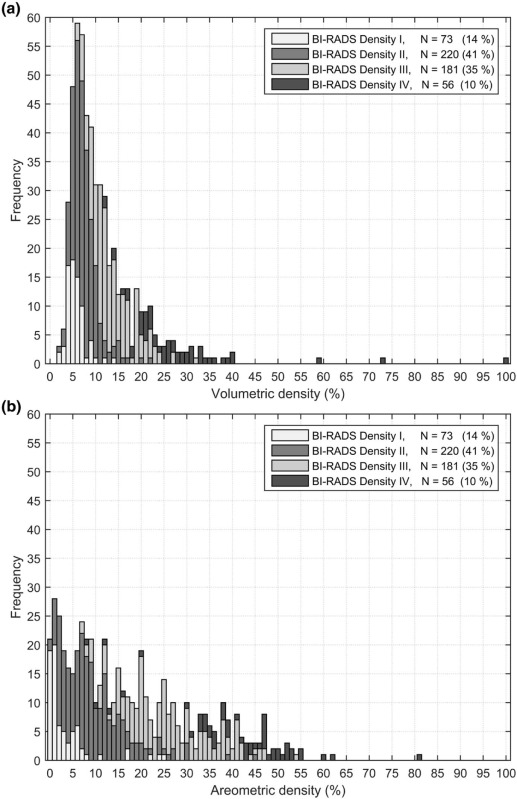
Density Distribution
Get Radiology Tree app to read full this article<
Get Radiology Tree app to read full this article<
Areometric-Volumetric Correlation
Get Radiology Tree app to read full this article<
Get Radiology Tree app to read full this article<
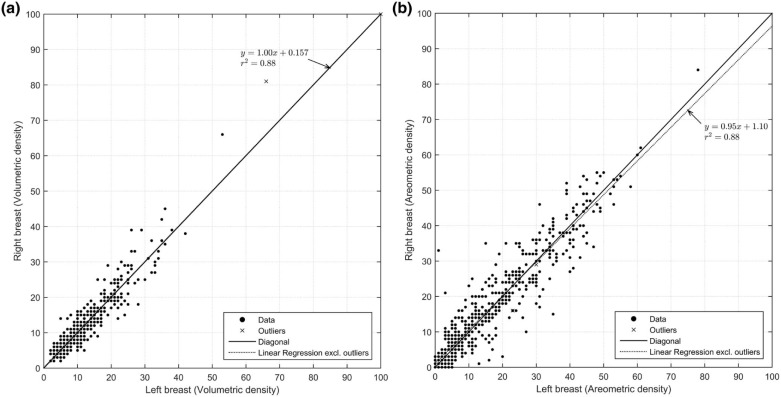
Left-Right Breast Comparison
Get Radiology Tree app to read full this article<
Get Radiology Tree app to read full this article<
Quantra-BI-RADS Comparison
Get Radiology Tree app to read full this article<
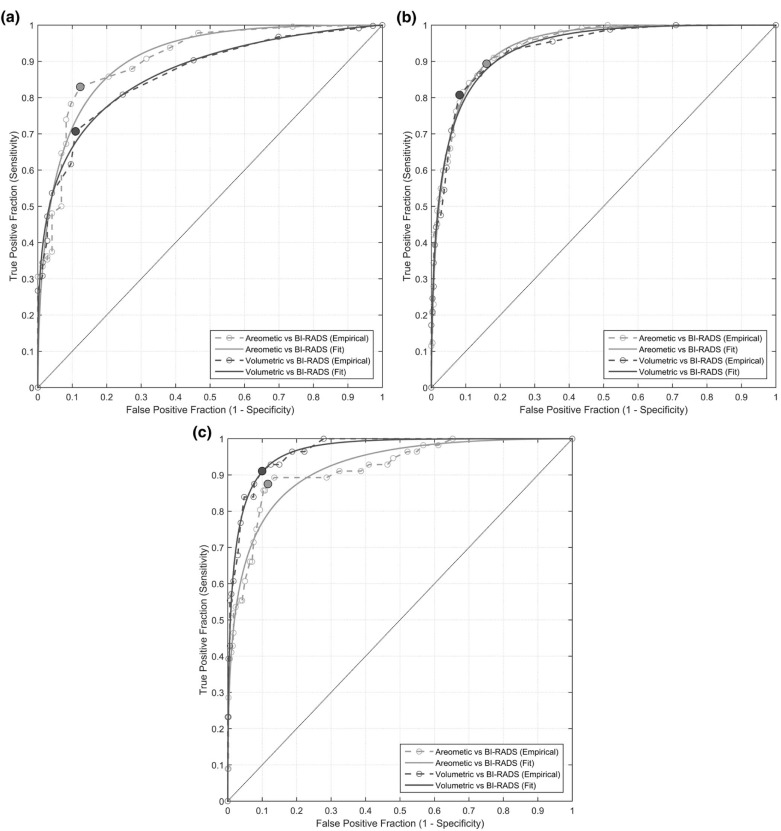
Table 1
The Area Under the Curve of the Areometric and Volumetric ROC Curves
BI-RADS Density Threshold AUC A,Emp
(95% CI) AUC A,Fit AUC V,Emp
(95% CI) AUC V,Fit AUC A,Emp –AUC V,Emp
(95% CI) Between I and II 0.91 (0.87–0.94) 0.91 0.86 (0.82–0.90) 0.87 0.04 (0.02–0.07) \* Between II and III 0.94 (0.92–0.96) 0.94 0.93 (0.91–0.95) 0.94 0.01 (−0.01–0.02) Between III and IV 0.92 (0.88–0.96) 0.92 0.97 (0.95–0.99) 0.97 −0.05 (−0.09–−0.02) \*
A, areometric; AUC, area under the curve; CI, confidence intervals; Emp, empirical; Fit, fitted curve; V, volumetric.
The last column shows the difference in areometric and volumetric area under the curve.
Get Radiology Tree app to read full this article<
Get Radiology Tree app to read full this article<
Quantra Thresholds
Get Radiology Tree app to read full this article<
Table 2
Data for the Optimal Operating Point for the ROC Curves in Figure 4a–c
BI-RADS Density Threshold Density Assessment Density Threshold (%) at Optimal Operating Point Sensitivity (%) at Optimal Operating Point Specificity (%) at Optimal Operating Point Between I and II ( Fig 4a ) Areometric 6
(5–7) 83.0
(79.4–86.4) 87.7
(79.6–94.7) Volumetric 7
(6–7) 70.7
(66.5–74.7) 89.0
(81.3–95.8) Quantized density \* 5 93.3
(91.0–95.5) 46.6
(35.3–58.0) Between II and III ( Fig 4b ) Areometric 14
(13–17) 89.3
(85.2–93.0) 84.0
(79.7–88.1) Volumetric 10
(8–10) 80.7
(75.8–85.7) 91.8
(88.5–94.8) Quantized density \* 13 67.6
(61.6–73.4) 94.5
(91.8–97.0) Between III and IV ( Fig 4c ) Areometric 30
(29–33) 87.5
(78.3–95.7) 88.4
(85.5–91.2) Volumetric 16
(13–19) 91.1
(83.0–98.0) 90.0
(87.3–92.7) Quantized density \* 26 55.4
(42.2–68.4) 98.8
(97.7–99.6)
Corresponding data from using quantized density (including Quantra’s default cutoff values) are also shown. Bootstrap estimates of the 95% confidence intervals are shown in parentheses.
Get Radiology Tree app to read full this article<
Get Radiology Tree app to read full this article<
Get Radiology Tree app to read full this article<
Synthetically Generated BI-RADS Distributions
Get Radiology Tree app to read full this article<
Table 3
Distribution of the Synthetically Generated BI-RADS Density Distribution Generated Using the Cutoff Values in Table 2
Density Assessment BI-RADS Density I BI-RADS Density II BI-RADS Density III BI-RADS Density IV Areometric 26.6% 22.2% 31.7% 19.6% Volumetric 37.4% 21.4% 22.7% 18.4% Quantized density 12.1% 54.2% 26.8% 6.9% Radiologists 13.6% 41.0% 33.7% 10.4%
The density distribution using quantized density and the radiologists’ distribution is also shown.
Get Radiology Tree app to read full this article<
Get Radiology Tree app to read full this article<
Thresholds by Imposing Radiologists’ Distribution
Get Radiology Tree app to read full this article<
Table 4
Areometric and Volumetric Density Thresholds That Most Closely Yield the Radiologists’ BI-RADS Density Distribution of 13.6%, 41.0%, 33.7%, and 10.4%
BI-RADS Density Threshold Density Assessment Density Threshold (%) Sensitivity (%) Specificity (%) Between I and II Areometric 2 93.8 61.6 Volumetric 5 90.3 54.8 Between II and III Areometric 16 84.0 89.1 Volumetric 9 86.5 86.0 Between III and IV Areometric 38 60.7 95.0 Volumetric 21 67.9 97.1
Sensitivity and specificity for detecting a breast denser than the respective BI-RADS density threshold is shown.
Get Radiology Tree app to read full this article<
Discussion
Main Finding
Get Radiology Tree app to read full this article<
Areometric Superiority in Fatty Breasts
Get Radiology Tree app to read full this article<
Volumetric Superiority in Dense Breasts
Get Radiology Tree app to read full this article<
Clinical Implications
Get Radiology Tree app to read full this article<
Get Radiology Tree app to read full this article<
Get Radiology Tree app to read full this article<
BI-RADS Distribution Generated From Density Data
Get Radiology Tree app to read full this article<
Get Radiology Tree app to read full this article<
Get Radiology Tree app to read full this article<
Thresholds by Imposing the Radiologist BI-RADS Distribution
Get Radiology Tree app to read full this article<
Get Radiology Tree app to read full this article<
Get Radiology Tree app to read full this article<
Get Radiology Tree app to read full this article<
Magnitude of the Threshold Values
Get Radiology Tree app to read full this article<
Get Radiology Tree app to read full this article<
Extension of Thresholds to Other Software
Get Radiology Tree app to read full this article<
Outliers
Get Radiology Tree app to read full this article<
Study Limitations
Get Radiology Tree app to read full this article<
Conclusions
Get Radiology Tree app to read full this article<
Acknowledgments
Get Radiology Tree app to read full this article<
References
1. Bae M.S., Moon W.K., Chang J.M., et. al.: Breast cancer detected with screening US: reasons for nondetection at mammography. Radiology 2014; 270: pp. 369-377.
2. Carney P.A., Miglioretti D.L., Yankaskas B.C., et. al.: Individual and combined effects of age, breast density, and hormone replacement therapy use on the accuracy of screening mammography. Ann Intern Med 2003; 138: pp. 168-175.
3. Al Mousa D.S., Ryan E.A., Mello-Thoms C., et. al.: What effect does mammographic breast density have on lesion detection in digital mammography?. Clin Radiol 2014; 69: pp. 333-341.
4. McCormack V.A., dos Santos Silva I.: Breast density and parenchymal patterns as markers of breast cancer risk: a meta-analysis. Cancer Epidemiol Biomarkers Prev 2006; 15: pp. 1159-1169.
5. Boyd N.F., Guo H., Martin L.J., et. al.: Mammographic density and the risk and detection of breast cancer. N Engl J Med 2007; 356: pp. 227-236.
6. Assi V., Warwick J., Cuzick J., et. al.: Clinical and epidemiological issues in mammographic density. Nat Rev Clin Oncol 2012; 9: pp. 33-40.
7. U.S. Government : Breast Density and Mammography Reporting Act of 2011. p. H.R.3102; Available at: http://www.gpo.gov/fdsys/pkg/BILLS-112hr3102ih/pdf/BILLS-112hr3102ih.pdf Accessed June 15 2015
8. Oberaigner W., Daniaux M., Geiger-Gritsch S., et. al.: Introduction of organised mammography screening in Tyrol: results following first year of complete rollout. BMC Public Health 2011; 11: pp. 673-680.
9. Yaffe M.J.: Mammographic density. Measurement of mammographic density. Breast Cancer Res 2008; 10: pp. 209-219.
10. D’Orsi C.J., Mendelson E.B., Ikeda D.M., et. al.: Breast Imaging Reporting and Data System: ACR BI-RADS—Breast Imaging Atlas.2003.American College of RadiologyReston, VA
11. D’Orsi C.J., Sickles E.A., Mendelson E.B., et. al.: Breast Imaging Reporting and Data System: ACR BI-RADS Atlas.2013.American College of RadiologyReston, VA
12. Ooms E.A., Zonderland H.M., Eijkemans M.J.C., et. al.: Mammography: interobserver variability in breast density assessment. Breast 2007; 16: pp. 568-576.
13. Ciatto S., Houssami N., Apruzzese A., et. al.: Categorizing breast mammographic density: intra- and interobserver reproducibility of BI-RADS density categories. Breast 2005; 14: pp. 269-275.
14. Kerlikowske K., Grady D., Barclay J., et. al.: Variability and accuracy in mammographic interpretation using the American College of Radiology Breast Imaging Reporting and Data System. J Natl Cancer Inst 1998; 90: pp. 1801-1809.
15. Østerås B.H., Martinsen A.C., Brandal S.H., et. al.: Classification of fatty and dense breast parenchyma: comparison of automatic volumetric density measurement and radiologists’ classification and their inter-observer variation. Acta Radiol 2016; http://dx.doi.org/10.1177/0284185115626469 published online; January 20
16. Winkler N.S., Raza S., Mackesy M., et. al.: Breast density: clinical implications and assessment methods. Radiographics 2015; 35: pp. 316-324.
17. Morrish O., Tucker L., Black R., et. al.: Mammographic breast density: comparison of methods for quantitative evaluation. Radiology 2015; 175: pp. 356-365.
18. Freer P.E.: Mammographic breast density: impact on breast cancer risk and implications for screening. Radiographics 2015; 35: pp. 302-315.
19. Rafferty E.A., Smith A., Niklason L.T.: Comparison of three methods of estimating breast density: BI-RADS density scores using full field digital mammography, breast tomosynthesis, and volumetric breast density. Proffered Pap Rad Soc North Am Chicago, USA SsM012009.
20. Ciatto S., Bernardi D., Calabrese M., et. al.: A first evaluation of breast radiological density assessment by QUANTRA software as compared to visual classification. Breast 2012; 21: pp. 503-506.
21. Regini E., Mariscotti G., Durando M., et. al.: Radiological assessment of breast density by visual classification (BI-RADS) compared to automated volumetric digital software (Quantra): implications for clinical practice. Radiol Med 2014; 119: pp. 741-749.
22. Skaane P., Bandos A.I., Gullien R., et. al.: Comparison of digital mammography alone and digital mammography plus tomosynthesis in a population-based screening program. Radiology 2013; 267: pp. 47-56.
23. Skaane P., Bandos A.I., Gullien R., et. al.: Prospective trial comparing full-field digital mammography (FFDM) versus combined FFDM and tomosynthesis in a population-based screening programme using independent double reading with arbitration. Eur Radiol 2013; 23: pp. 2061-2071.
24. Johns P.C., Yaffe M.J.: X-ray characterization of normal and neoplastic breast tissue. Phys Med Biol 1987; 32: pp. 675-695.
25. Hologic : Understanding Quantra™ 2.0. User Manual. Man-02004 Rev 004; Available at: http://stage.hologic.com/sites/default/files/package%20inserts/Understanding%20Quantra%202.0%20User%20Manual.%20English.pdf Accessed September 15 2015
26. Pesce L.L., Papaioannou J., Metz C.E.: The Kurt Rossmann Laboratories for Radiologic Image Research. Available from: http://metz-roc.uchicago.edu Accessed May 15 2015
27. DeLong E.R., DeLong D.M., Clarke-Pearson D.L.: Comparing the areas under two or more correlated receiver operating characteristic curves: a nonparametric approach. Biometrics 1988; 44: pp. 837-845.
28. Gruszauskas N.P., Drukker K., Giger M.L., et. al.: Performance of breast ultrasound computer-aided diagnosis. Dependence on image selection. Acad Radiol 2008; 15: pp. 1234-1245.
29. Metz C.E., Herman B.A., Shen J.H.: Maximum likelihood estimation of receiver operating characteristic (ROC) curves from continuously-distributed data. Stat Med 1998; 17: pp. 1033-1053.
30. Schisterman E.F., Perkins N.J., Liu A., et. al.: Optimal cut-point and its corresponding Youden Index to discriminate individuals using pooled blood samples. Epidemiology 2005; 16: pp. 73-81.
31. Zhou X.-H., Obuchowski N.A., McClish D.K.: Statistical methods in diagnostic medicine.2nd ed2011.John Wiley & Sons, IncHoboken, NJ, USA
32. Skaane P., Østerås B.H., Eben E.B., et. al.: Comparison of Digital Mammography (FFDM) and FFDM Plus Digital Breast Tomosynthesis in Mammography Screening for Cancer Detection According to Breast Parenchyma Density. Radiological Society of North America Chicago, IL2014.
33. Schmachtenberg C., Hammann-Kloss S., Bick U., et. al.: Intraindividual comparison of two methods of volumetric breast composition assessment. Acad Radiol 2015; 22: pp. 447-452.