
Rationale and objectives
This study measures hemodynamic properties such as blood flow and hemoglobin concentration and oxygenation in the healthy human breast under a wide range of compressive loads. Because many breast-imaging technologies derive contrast from the deformed breast, these load-dependent vascular responses affect contrast agent–enhanced and hemoglobin-based breast imaging.
Methods
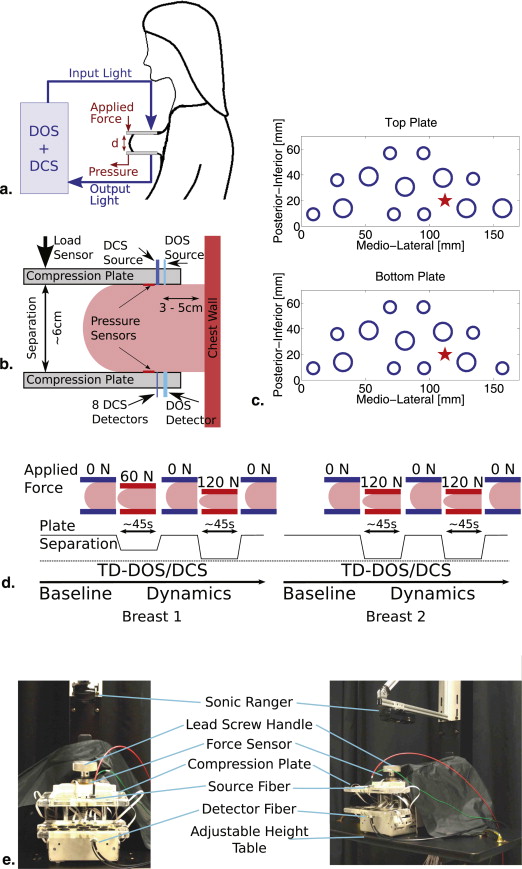
Diffuse optical and diffuse correlation spectroscopies were used to measure the concentrations of oxygenated and deoxygenated hemoglobin, lipid, water, and microvascular blood flow during axial breast compression in the parallel-plate transmission geometry.
Results
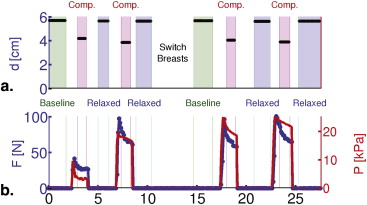
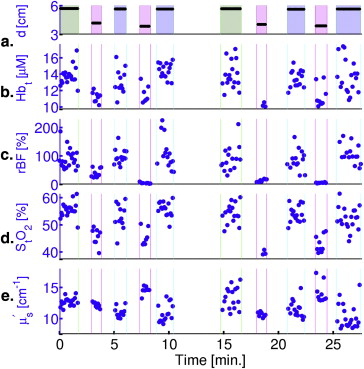
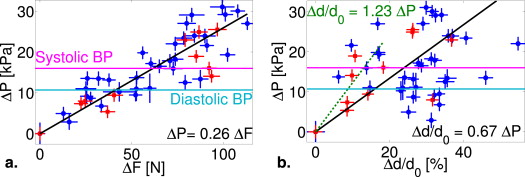
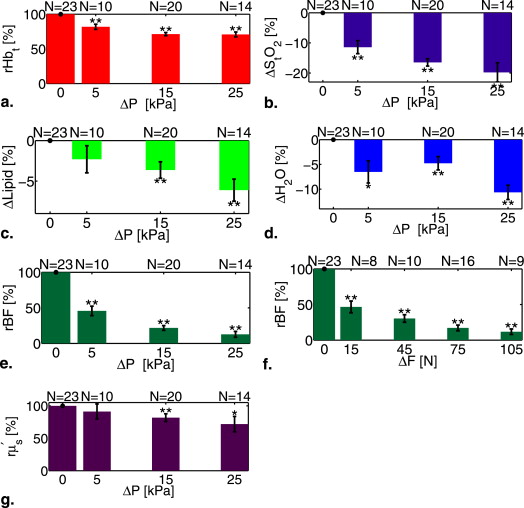
Significant reductions ( P < .01) in total hemoglobin concentration (∼30%), blood oxygenation (∼20%), and blood flow (∼87%) were observed under applied pressures (forces) of up to 30 kPa (120 N) in 15 subjects. Lipid and water concentrations changed <10%.
Conclusions
Imaging protocols based on injected contrast agents should account for variation in tissue blood flow due to mammographic compression. Similarly, imaging techniques that depend on endogenous blood contrasts will be affected by breast compression during imaging.
Exogenous contrast agents are playing an increasingly important role in breast cancer screening and diagnosis, because they improve image signal-to-noise and offer novel targeting potential as tissue biomarkers. Dynamic contrast-enhanced magnetic resonance imaging (DCE-MRI) uses intravenous injection of gadolinium-diethylenetriamine pentaacetic acid (Gd-DTPA), for example, and is currently recommended as a screening tool for high-risk women . Similarly, contrast-enhanced digital x-ray tomosynthesis often uses injection of iodine-based agents into the compressed breast . Both of these techniques rely on adequate blood flow to control the delivery, uptake, and spatial distribution of the contrast agent. Deformation of breast tissue during compression, however, can lead to modifications of regional blood flow that alter tissue oxygenation and metabolism as well as contrast agent delivery. Furthermore, the mechanical properties of tumors are generally different from those of the surrounding tissues , and these differences can lead to uncontrolled and heterogeneous vascular responses of the breast to compression. Thus, compression can significantly reduce cancer contrast.
In addition to the standard clinical techniques mentioned previously, scientists continue to explore new technologies to enhance breast cancer specificity and sensitivity. Diffuse optical spectroscopy (DOS) and tomography (DOT), for example, are novel methodologies that utilize photons in the near-infrared (NIR, 650–950 nm) tissue transmission window to measure properties of normal and diseased breast tissues noninvasively and in vivo . In breast cancer, these physiological parameters typically include the concentration of oxygenated and deoxygenated hemoglobin (HbO 2 and Hb, respectively), from which total tissue hemoglobin concentration (Hb t = HbO 2 + Hb ∝ blood volume) and blood oxygen saturation (StO 2 = HbO 2 /Hb t ) are readily calculated. These hemodynamic parameters, including other tissue properties such as water and lipid concentration and reduced tissue scattering ( μ′s μ
s
′ ), all provide significant endogenous tumor contrast for the optical method. In practice, clinical DOS/DOT measurements typically involve placing breast tissue under some type of mild compression, however, and the effects of this compression on breast tissue vasculature are not generally considered in the analysis of DOT results, despite observations suggesting that compression effects are present .
Get Radiology Tree app to read full this article<
Get Radiology Tree app to read full this article<
Methods
Recruitment
Get Radiology Tree app to read full this article<
Table 1
Demographic Information for Healthy Subjects Studied in the Compression Investigation
Parameters Subjects ( N = 15) Age, yr 35 ± 16 (19, 67) BMI, kg/m 2 26 ± 7.8 (19.6, 49.3) Menopausal status Premenopausal 12 (75%) Postmenopausal 3 (25%) Bra cup size B 1 (7%) C 8 (53%) D 5 (33%) E 1 (7%) Race/ethnicity Caucasian 11 (73%) African American 3 (20%) Asian 1 (7%) Hispanic 0 (0%)
Race/ethnicity and bra cup size are self-reported. Body mass index (BMI) and age are reported as mean ± standard deviation (minimum, maximum).
Get Radiology Tree app to read full this article<
Measurement Protocol
Get Radiology Tree app to read full this article<
Get Radiology Tree app to read full this article<
Get Radiology Tree app to read full this article<
Get Radiology Tree app to read full this article<
Get Radiology Tree app to read full this article<
Get Radiology Tree app to read full this article<
Get Radiology Tree app to read full this article<
μ′s(λ)=Aλ−b μ
s
′
(
λ
)
=
A
λ
−
b
for each optical wavelength λ (nm). Note that μ′s μ
s
′ and the quantity ( Aλ − b ) have units of cm −1 . The tissue absorption coefficient is a sum of terms containing both the i th chromophore concentration ( C__i , mol/L) and their respective extinction coefficients (ε i , cm −1 mol −1 L), that is,
μa(λ)=∑iCi⋅εi(λ)⋅ln(10) μ
a
(
λ
)
=
∑
i
C
i
·
ε
i
(
λ
)
·
ln
(
10
)
where the sum is over all tissue chromophores and μ__a has units of cm −1 . Additionally, two derived parameters, total hemoglobin concentration and blood oxygen saturation, were calculated at each time point.
Get Radiology Tree app to read full this article<
Get Radiology Tree app to read full this article<
Get Radiology Tree app to read full this article<
rHbt=Hbt(Hbt)0ΔStO2=StO2−(StO2)0rBF=BFBF0ΔLipid=Lipid−Lipid0ΔH2O=H2O−(H2O)0rμ′s=μ′s(μ′s)0ΔP=P−P0ΔF=F−F0 rHb
t
=
Hb
t
(
Hb
t
)
0
ΔStO
2
=
StO
2
−
(
StO
2
)
0
r
BF
=
BF
BF
0
ΔLipid
=
Lipid
−
Lipid
0
ΔH
2
O
=
H
2
O
−
(
H
2
O
)
0
r
μ
s
′
=
μ
s
′
(
μ
s
′
)
0
Δ
P
=
P
−
P
0
Δ
F
=
F
−
F
0
where the resulting normalized physiological parameters are measured in percentages (or as differences) relative to the baseline ( X__0 ) value.
Get Radiology Tree app to read full this article<
Statistical Methods
Get Radiology Tree app to read full this article<
Get Radiology Tree app to read full this article<
Results
Example Data from Individual Subjects
Get Radiology Tree app to read full this article<
Get Radiology Tree app to read full this article<
Get Radiology Tree app to read full this article<
Get Radiology Tree app to read full this article<
Get Radiology Tree app to read full this article<
Population-averaged Mechanical Properties
Get Radiology Tree app to read full this article<
Get Radiology Tree app to read full this article<
Get Radiology Tree app to read full this article<
Get Radiology Tree app to read full this article<
Population-averaged Physiological Properties
Get Radiology Tree app to read full this article<
Get Radiology Tree app to read full this article<
Discussion
Get Radiology Tree app to read full this article<
Get Radiology Tree app to read full this article<
Get Radiology Tree app to read full this article<
Get Radiology Tree app to read full this article<
Get Radiology Tree app to read full this article<
Get Radiology Tree app to read full this article<
Get Radiology Tree app to read full this article<
Conclusions
Get Radiology Tree app to read full this article<
Get Radiology Tree app to read full this article<
Get Radiology Tree app to read full this article<
Acknowledgments
Get Radiology Tree app to read full this article<
Appendix A
Optical data analysis
Get Radiology Tree app to read full this article<
Get Radiology Tree app to read full this article<
χ2=∑λ,t(T(t,λ)−Tc(t,λ)T(t,λ)√∣∣∣t2t1) χ
2
=
∑
λ
,
t
(
T
(
t
,
λ
)
−
T
c
(
t
,
λ
)
T
(
t
,
λ
)
|
t
1
t
2
)
Get Radiology Tree app to read full this article<
Get Radiology Tree app to read full this article<
Get Radiology Tree app to read full this article<
Gdcsslab[τ]=14π∑∞m=−∞(r−11,me−kdcs(τ)r1,m−r−12,me−kdcs(τ)r2,m) G
slab
dcs
[
τ
]
=
1
4
π
∑
m
=
−
∞
∞
(
r
1
,
m
−
1
e
−
k
dcs
(
τ
)
r
1
,
m
−
r
2
,
m
−
1
e
−
k
dcs
(
τ
)
r
2
,
m
)
Get Radiology Tree app to read full this article<
Get Radiology Tree app to read full this article<
r1,m=ρ2+z21,m−−−−−−−√ r
1
,
m
=
ρ
2
+
z
1
,
m
2
r2,m=ρ2+z22,m−−−−−−−√ r
2
,
m
=
ρ
2
+
z
2
,
m
2
z1,m=d(1−2m)−4mzb−z0 z
1
,
m
=
d
(
1
−
2
m
)
−
4
m
z
b
−
z
0
z2,m=d(1−2m)−(4m−2)zb+z0 z
2
,
m
=
d
(
1
−
2
m
)
−
(
4
m
−
2
)
z
b
+
z
0
z0=1μ′s+μa≃1μ′s z
0
=
1
μ
s
′
+
μ
a
≃
1
μ
s
′
zb=2z031+Reff1−Reff z
b
=
2
z
0
3
1
+
R
eff
1
−
R
eff
kdcs(τ)=vD(μa+αμ′sκ20<Δr2(τ)>3)−−−−−−−−−−−−−−−−−−√ k
dcs
(
τ
)
=
v
D
(
μ
a
+
α
μ
s
′
κ
0
2
<
Δ
r
2
(
τ
)
3
)
κ0=2πnλ κ
0
=
2
π
n
λ
D=v3(μ′s+μa)≃v3μ′s D
=
v
3
(
μ
s
′
+
μ
a
)
≃
v
3
μ
s
′
where d is the slab thickness, ρ the transverse source-detector separation, v is the speed of light, n is the index of refraction, R eff is the Fresnel reflection coefficient at the slab boundaries, and α is the fraction of moving scatterers. Note, this fit uses the optical properties ( μ__a and μ′s μ
s
′ ) at the DCS wavelength (785 nm) determined from TD-DOS measurements.
Get Radiology Tree app to read full this article<
Get Radiology Tree app to read full this article<
k2dcs[τ]=vD(μa+2μ′sκ20αDBτ) k
dcs
2
[
τ
]
=
v
D
(
μ
a
+
2
μ
s
′
κ
0
2
α
D
B
τ
)
Get Radiology Tree app to read full this article<
Get Radiology Tree app to read full this article<
References
1. Saslow D., Boetes C., Burke W., et. al., A. C. S. B. C. A. Group: American Cancer Society guidelines for breast screening with MRI as an adjunct to mammography. CA-Cancer J Clin 2007; 57: pp. 75-89.
2. Niklason L.T., Christian B.T., Niklason L.E., et. al.: Digital tomosynthesis in breast imaging. Radiology 1997; 205: pp. 399-406.
3. Chen S.C., Carton A.-K., Albert M., et. al.: Initial clinical experience with contrast-enhanced digital breast tomosynthesis. Acad Radiol 2007; 14: pp. 229-238.
4. O’Hagan J.J., Samani A.: Measurement of the hyperelastic properties of 44 pathological ex vivo breast tissue samples. Phys Med Biol 2009; 54: pp. 2557.
5. O’Hagan J.J., Samani A.: Measurement of the hyperelastic properties of tissue slices with tumour inclusion. Phys Med Biol 2008; 53: pp. 7087.
6. Samani A., Zubovits J., Plewes D.: Elastic moduli of normal and pathological human breast tissues: an inversion-technique-based investigation of 169 samples. Phys Med Biol 2007; 52: pp. 1565.
7. Samani A., Plewes D.: A method to measure the hyperelastic parameters of ex vivo breast tissue samples. Phys Med Biol 2004; 49: pp. 4395.
8. Plewes D.B., Bishop J., Samani A., et. al.: Visualization and quantification of breast cancer biomechanical properties with magnetic resonance elastography. Phys Med Biol 2000; 45: pp. 1591.
9. Krouskop T.A., Wheeler T.M., Kallel F., et. al.: Elastic moduli of breast and prostate tissues under compression. Ultrasonic Imaging 1998; 20: pp. 260.
10. Wellman P., Howe R.D., Dalton E., Kern K.A.: Breast tissue stiffness in compression is correlated to histological diagnosis.1999.Harvard BioRobotics Laboratory Technical ReportCambridge, MA
11. Azar F.S., Metaxas D.N., Schnall M.D.: Methods for modeling and predicting mechanical deformations of the breast under external perturbations. Med Image Analy 2002; 6: pp. 1-27.
12. McKnight A.L., Kugel J.L., Rossman P.J., et. al.: MR elastography of breast cancer: preliminary results. AJR Am J Roentgenol 2002; 178: pp. 1411.
13. Jacques S.L., Pogue B.W.: Tutorial on diffuse light transport. J Biomed Opt 2008; 13: pp. 041302. 1-19
14. Durduran T., Choe R., Baker W.B., et. al.: Diffuse optics for tissue monitoring and tomography. Rep Prog Phys 2010; 73: pp. 076701.
15. Enfield L.C., Gibson A.P., Everdell N.L., et. al.: Three-dimensional time-resolved optical mammography of the uncompressed breast. Appl Opt 2007; 46: pp. 3628-3638.
16. Poplack S.P., Tosteson T.D., Wells W.A., et. al.: Electromagnetic breast imaging: results of a pilot study in women with abnormal mammograms. Radiology 2007; 243: pp. 350-359.
17. Nioka S., Yung Y., Shnall M., et. al.: Optical imaging of breast tumor by means of continuous waves. Adv Exp Med Biol 1997; 411: pp. 227-232.
18. Grosenick D., Wabnitz H., Rinneberg H.H., et. al.: Development of a time-domain optical mammograph and first in vivo applications. Appl Opt 1999; 38: pp. 2927-2943.
19. Spinelli L., Torricelli A., Pifferi A., et. al.: Characterization of female breast lesions from multi-wavelength time-resolved optical mammography. Phys Med Biol 2005; 50: pp. 2489-2502.
20. Culver J.P., Choe R., Holboke M.J., et. al.: Three-dimensional diffuse optical tomography in the parallel plane transmission geometry: evaluation of a hybrid frequency domain/continuous wave clinical system for breast imaging. Med Phys 2003; 30: pp. 235-247.
21. Choe R., Konecky S.D., Corlu A., et. al.: Differentiation of benign and malignant breast tumors by in-vivo three-dimensional parallel-plate diffuse optical tomography. J Biomed Opt 2009; 14: pp. 024020.
22. Hoogenraad J.H., van der Mark M.B., Colak S.B., Hooft G.W., van der Linden E.S.: First results from the Philips optical mammoscope.1998.SPIEpp. 184-190. Available at: http://dx.doi.org/10.1117/12.301053
23. Nielsen T., Brendel B., Ziegler R., et. al.: Linear image reconstruction for a diffuse optical mammography system in a noncompressed geometry using scattering fluid. Appl Opt 2009; 48: pp. D1-D13.
24. Schmitz C.H., Klemer D.P., Hardin R., et. al.: Design and implementation of dynamic near-infrared optical tomographic imaging instrumentation for simultaneous dual-breast measurements. Appl Opt 2005; 44: pp. 2140-2153.
25. Intes X., Djeziri S., Ichalalene Z., et. al.: Time-domain optical mammography softscan: initial results. Acad Radiol 2005; 12: pp. 934-947.
26. Athanasiou A., Vanel D., Fournier L., et. al.: Optical mammography: a new technique for visualizing breast lesions in women presenting non palpable BIRADS 4–5 imaging findings: preliminary results with radiologic–pathologic correlation. Canc Imag 2007; 7: pp. 34.
27. Fournier L.S., Vanel D., Athanasiou A., et. al.: Dynamic optical breast imaging: a novel technique to detect and characterize tumor vessels. Eur J Rad 2009; 69: pp. 43-49.
28. Durduran T., Choe R., Culver J.P., et. al.: Bulk optical properties of healthy female breast tissue. PMB 2002; 47: pp. 2847-2861.
29. Spinelli L., Torricelli A., Pifferi A., et. al.: Bulk optical properties and tissue components in the female breast from multiwavelength time-resolved optical mammography. J Biomed Opt 2004; 9: pp. 1137-1142.
30. Fang Q., Carp S.A., Selb J., et. al.: Combined optical imaging and mammography of the healthy breast: optical contrast derived from breast structure and compression. IEEE Trans Med Imaging 2009; 28: pp. 30-42.
31. Taroni P., Bassi A., Comelli D., et. al.: Diffuse optical spectroscopy of breast tissue extended to 1100 nm. J Biomed Opt 2009; 14: pp. 054030.
32. Taroni P., Pifferi A., Salvagnini E., et. al.: Seven-wavelength time-resolved optical mammography extending beyond 1000 nm for breast collagen quantification. Opt Exp 2009; 17: pp. 15932-15946.
33. Leff D.R., Warren O.J., Enfield L.C., et. al.: Diffuse optical imaging of the healthy and diseased breast: a systematic review. Breast Cancer Res Treat 2008; 108: pp. 9-22.
34. Srinivasan S., Pogue B.W., Carpenter C., et. al.: Developments in quantitative oxygen-saturation imaging of breast tissue in vivo using multispectral near-infrared tomography. Antioxid Redox Signal 2007; 9: pp. 1143-1156.
35. Shah N., Cerussi A.E., Jakubowski D., et. al.: Spatial variations in optical and physiological properties of healthy breast tissue. J Biomed Opt 2004; 9: pp. 534-540.
36. Blyschak K., Simick M., Jong R., et. al.: Classification of breast tissue density by optical transillumination spectroscopy: optical and physiological effects governing predictive value. Med Phys 2004; 31: pp. 1398-1414.
37. Blackmore K.M., Knight J.A., Jong R., et. al.: Assessing breast tissue density by transillumination breast spectroscopy (TIBS): an intermediate indicator of cancer risk. Br J Radiol 2007; 80: pp. 545-556.
38. Blackmore K.M., Knight J.A., Lilge L.: Association between transillumination breast spectroscopy and quantitative mammographic features of the breast. Cancer Epidemiol Biomarkers 2008; 17: pp. 1043.
39. Taroni P., Pifferi A., Quarto G., et. al.: Noninvasive assessment of breast cancer risk using time-resolved diffuse optical spectroscopy. J Biomed Opt 2010; 15: pp. 060501.
40. Jiang S., Pogue B.W., Paulsen K.D., et. al.: In vivo near-infrared spectral detection of pressure-induced changes in breast tissue. Opt Lett 2003; 28: pp. 1212-1214.
41. Nioka S., Wen S., Zhang J., et. al.: Simulation study of breast tissue hemodynamics during pressure perturbation. Adv Exp Med Biol 2005; 566: pp. 17-22.
42. Carp S.A., Kauffman T., Fang Q., et. al.: Compression-induced changes in the physiological state of the breast as observed through frequency domain photon migration measurements. J Biomed Opt 2006; 11: pp. 064016.
43. Xu R.X., Qiang B., Mao J.J., et. al.: Development of a handheld near-infrared imager for dynamic characterization of in vivo biological tissue systems. Appl Opt 2007; 46: pp. 7442-7451.
44. Boverman G., Fang Q., Carp S.A., et. al.: Spatio-temporal imaging of the hemoglobin in the compressed breast with diffuse optical tomography. Phys Med Biol 2007; 52: pp. 3619-3641.
45. Carp S.A., Selb J., Fang Q., et. al.: Dynamic functional and mechanical response of breast tissue to compression. Opt Exp 2008; 16: pp. 16064-16078.
46. Jiang S.D., Pogue B.W., Laughney A.M.: Measurement of pressure-displacement kinetics of hemoglobin in normal breast tissue with near-infrared spectral imaging. Appl Opt 2009; 48:
47. Al abdi R., Graber H.L., Xu Y., et. al.: Optomechanical imaging system for breast cancer detection. JOSA A 2011; 28: pp. 2473-2493.
48. Flexman M., Khalil M., Al Abdi R., et. al.: Digital optical tomography system for dynamic breast imaging. J Biomed Opt 2011; 16: pp. 076014.
49. Boas D.A., Campbell L.E., Yodh A.G.: Scattering and imaging with diffusing temporal field correlations. Phys Rev Lett 1995; 75: pp. 1855-1858.
50. Choe R., Durduran T.: Diffuse optical monitoring of the neoadjuvant breast cancer therapy. IEEE J Sel Topics Quantum Electron 2012; 18: pp. 1367-1386.
51. Boas D.A., Yodh A.G.: Spatially varying dynamical properties of turbid media probed with diffusing temporal light correlation. JOSA A 1997; 14: pp. 192-215.
52. Durduran T., Choe R., Yu G.Q., et. al.: Diffuse optical measurement of blood flow in breast tumors. Opt Lett 2005; 30: pp. 2915-2917.
53. Zhou C., Choe R., Shah N., et. al.: Diffuse optical monitoring of blood flow and oxygenation in human breast cancer during early stages of neoadjuvant chemotherapy. J Biomed Opt 2007; 12: pp. 051903.
54. Menon C., Polin G.M., Prabakaran I., et. al.: An integrated approach to measuring tumor oxygen status using human melanoma xenografts as a model. Cancer Res 2003; 63: pp. 7232-7240.
55. Roche-Labarbe N., Carp S.A., Surova A., et. al.: Noninvasive optical measures of CBV, STO2, CBF index, and RCMRO2 in human premature neonates’ brains in the first six weeks of life. Hum Brain Mapp 2010; 31: pp. 341-352.
56. Sunar U., Makonnen S., Zhou C., et. al.: Hemodynamic responses to antivascular therapy and ionizing radiation assessed by diffuse optical spectroscopies. Optics Express 2007; 15: pp. 15507-15516.
57. Li J., Ninck M., Koban L., et. al.: Transient functional blood flow change in the human brain measured noninvasively by diffusing-wave spectroscopy. Opt lett 2008; 33: pp. 2233-2235.
58. Dietsche G., Ninck M., Ortolf C., et. al.: Fiber-based multispeckle detection for time-resolved diffusing-wave spectroscopy: characterization and application to blood flow detection in deep tissue. Appl Opt 2007; 46: pp. 8506-8514.
59. Jaillon F., Li J., Dietsche G., et. al.: Activity of the human visual cortex measured non-invasively by diffusing-wave spectroscopy. Optics Express 2007; 15: pp. 6643-6650.
60. Jaillon F., Skipetrov S.E., Li J., et. al.: Diffusing-wave spectroscopy from head-like tissue phantoms: influence of a non-scattering layer. Optics Express 2006; 14: pp. 10181-10194.
61. Durduran T.: Noninvasive measurements of tissue hemodynamics with hybrid diffuse optical methods. PhD thesis2004.University of PennsylvaniaPhiladelphia, PA, USA
62. Durduran T., Yu G., Burnett M.G., et. al.: Diffuse optical measurement of blood flow, blood oxygenation, and metabolism in a human brain during sensorimotor cortex activation. Opt Lett 2004; 29: pp. 1766-1768.
63. Cheung C., Culver J.P., Takahashi K., et. al.: In vivo cerebrovascular measurement combining diffuse near-infrared absorption and correlation spectroscopies. Phys Med Biol 2001; 46: pp. 2053.
64. Yu G.Q., Durduran T., Zhou C., et. al.: Noninvasive monitoring of murine tumor blood flow during and after photodynamic therapy provides early assessment of therapeutic efficacy. Clin Cancer Res 2005; 11: pp. 3543-3552.
65. Buckley E.M., Cook N.M., Durduran T., et. al.: Cerebral hemodynamics in preterm infants during positional intervention measured with diffuse correlation spectroscopy and transcranial Doppler ultrasound. Optics Express 2009; 17: pp. 12571-12581.
66. Durduran T., Zhou C., Buckley E.M., et. al.: Optical measurement of cerebral hemodynamics and oxygen metabolism in neonates with congenital heart defects. J Biomed Opt 2010; 15: pp. 037004.
67. Yu G., Floyd T.F., Durduran T., et. al.: Validation of diffuse correlation spectroscopy for muscle blood flow with concurrent arterial spin labeled perfusion MRI. Optics Express 2007; 15: pp. 1064-1075.
68. Kim M., Durduran T., Frangos S., et. al.: Noninvasive measurement of cerebral blood flow and blood oxygenation using near-infrared and diffuse correlation spectroscopies in critically brain-injured adults. Neurocrit Care 2010; 12: pp. 173-180.
69. Zhou C., Eucker S.A., Durduran T., et. al.: Diffuse optical monitoring of hemodynamic changes in piglet brain with closed head injury. J Biomed Opt 2009; 14: pp. 034015.
70. Zhou C., Yu G., Daisuke F., et. al.: Diffuse optical correlation tomography of cerebral blood flow during cortical spreading depression in rat brain. Optics Express 2006; 14: pp. 1125-1144.
71. Durduran T., Zhou C., Edlow B.L., et. al.: Transcranial optical monitoring of cerebrovascular hemodynamics in acute stroke patients. Optics Express 2009; 17: pp. 3884-3902.
72. Yu G.Q., Durduran T., Lech G., et. al.: Time-dependent blood flow and oxygenation in human skeletal muscles measured with noninvasive near-infrared diffuse optical spectroscopies. J Biomed Opt 2005; 10: pp. 024027. 1–12
73. Yu G., Durduran T., Zhou C., et. al.: Real-time in situ monitoring of human prostate photodynamic therapy with diffuse light. Photochem Photobiol 2006; 82: pp. 1279-1284.
74. Sunar U., Quon H., Durduran T., et. al.: Noninvasive diffuse optical measurement of blood flow and blood oxygenation for monitoring radiation therapy in patients with head and neck tumors: a pilot study. J Biomed Opt 2006; 11: pp. 064021.
75. Busch D.R.: Computer-aided, multi-modal, and compression diffuse optical studies of breast tissue. PhD thesis2011.University of PennsylvaniaPhiladelphia, PA
76. O’Leary D., Grant T., Rainford L.: Image quality and compression force: the forgotten link in optimisation of digital mammography?. BCR 2011; 13: pp. P10.
77. Mourant J.R., Fuselier T., Boyer J., et. al.: Predictions and measurements of scattering and absorption over broad wavelength ranges in tissue phantoms. App Opt 1997; 36: pp. 949-957.
78. Fung Y.C.: Biomechanics: mechanical properties of living tissue.1981.Springer–VerlagNew York, NY
79. Humphrey J.: Review paper: continuum biomechanics of soft biological tissues. Proc R Soc Lond Ser A Math Phys Eng Sci 2003; 459: pp. 3.
80. Förnvik D., Dustler M., Andersson I., et. al.: Pressure distribution in mammography: compression of breasts with malignant tumor masses.2013.SPIE Med Imaging Int Soc Optics Photonicspp. 86684E.
81. Doughty J.C., McCarter D.H.A., Kane E., et. al.: Anatomical basis of intra-arterial chemotherapy for patients with locally advanced breast cancer. Br J Surg 1996; 83: pp. 1128-1130.
82. Liebert A., Maniewski R.: Influence of probe optical arrangement on biological zero in laser-doppler perfusion measurements.1997.IEEEpp. 200-201.
83. Zhong J., Seifalian A.M., Salerud G.E., et. al.: A mathematical analysis on the biological zero problem in laser Doppler flowmetry. IEEE Trans Biomed Eng 1998; 45: pp. 354-364.
84. Jain R.K.: Molecular regulation of vessel maturation. Nat Med 2003; 9: pp. 685-693.
85. Dixit S.S., Kim H., Comstock C., et. al.: Near infrared transillumination imaging of breast cancer with vasoactive inhalation contrast. Biomed Opt Exp 2010; 1: pp. 295-309.
86. Flexman M.L., Kim H.K., Gunther J.E., et. al.: Optical biomarkers for breast cancer derived from dynamic diffuse optical tomography. J Biomed Opt 2013; 18: pp. 096012.
87. Zhang G.J.: DOBI Comfortscan System Clinical Effectiveness Evaluation Report, Technical Report.2011.DOBI Medical International Available at: http://dobiglobal.com/pdfs/DOBIComfortScan_Clinical_Report_2011.pdf
88. Lorenzen J., Sinkus R., Biesterfeldt M., et. al.: Menstrual-cycle dependence of breast parenchyma elasticity: estimation with magnetic resonance elastography of breast tissue during the menstrual cycle. Investig Radiol 2003; 38: pp. 236.
89. Contini D., Martelli F., Zaccanti G.: Photon migration through a turbid slab described by a model based on diffusion approximation. I. theory. Appl Opt 1997; 36: pp. 4587-4599.
90. Carp S.A., Dai G.P., Boas D.A., et. al.: Validation of diffuse correlation spectroscopy measurements of rodent cerebral blood flow with simultaneous arterial spin labeling MRI; towards MRI-optical continuous cerebral metabolic monitoring. Biomed Opt Express 2010; 1: pp. 553-565.