
Rationale and Objectives
There is potential for x-ray dose reduction in computed tomography colonography (CTC) relative to body mass index (BMI). We evaluated the association between BMI and three-dimensional (3D) CTC image quality to assess the potential utility of BMI as the basis for radiation dose reduction in CTC.
Materials and Methods
Ninety-six consecutive patients underwent CTC and were randomized for scanning at 15 or 30 mAs. Extremely obese patients (BMI > 50) were excluded. Each patient was scanned supine and prone on a multidetector CT scanner. Postprocessing CTC visualization was performed on a dedicated workstation. Three independent observers assessed 3D image quality using a four-point scale. Image noise was measured in both the abdomen and pelvis. The association between BMI and image noise was examined using random-effects linear regression models. Logistic regression was used to examine the relationship between BMI, mAs, and conspicuity scores.
Results
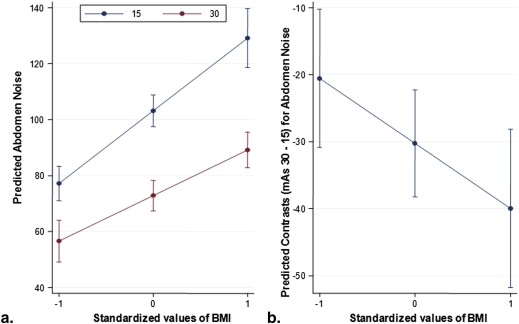
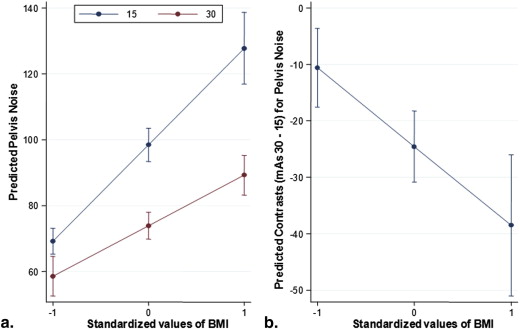
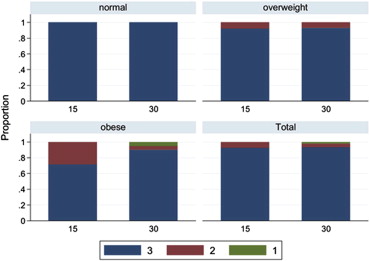
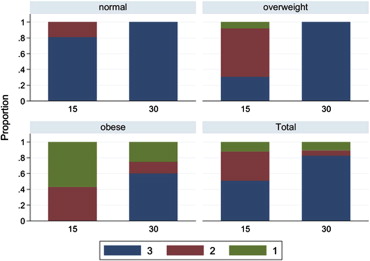
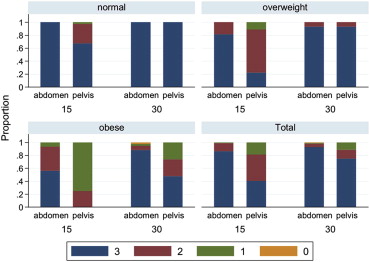
Statistically significant differences in image noise were observed between 15 and 30 mAs in both the abdomen and pelvis, and the difference was greater with increasing BMI. A positive relationship was detected between BMI and noise in the abdomen ( P < .001) and pelvis ( P < .001). Inverse correlation was identified between BMI and conspicuity scores in the abdomen ( P = .01) and pelvis ( P < .001). Overall conspicuity scores were reduced for both 15 and 30 mAs groups as BMI increased.
Conclusion
The radiation dose for CTC can be reduced by 40% and 70% below commonly employed doses for overweight and normal BMI patients, respectively, by using a BMI-adjusted dose reduction approach. Conspicuity scores dropped in obese patients with reduced dose suggesting that standard accepted doses should be utilized in that group.
Because computed tomography colonography (CTC) has gained acceptance as an appropriate method to screen for colorectal cancer , the risk of ionizing radiation exposure for patients 50 years of age or older has been evaluated, particularly if multiple follow-up exams are needed . Recently, the potential risks of CT radiation associated with CT heightened the concerns even in comparatively low-dose examinations such as CTC. It is important to realize that the risks of “low”-dose CT are controversial. The Health Physics Society position statement updated in 2010 states that for low-dose exposure (50-100 mSv) the associated health risks are “either too small to be observed or are nonexistent” . In a recent survey of research institutions performing CTC, Liedenbaum et al reported a median effective dose of only 5.7 mSv (2.5-2.8 mSv per series) , or approximately half of the dose administered for a diagnostic single-phase CT examination of abdomen and pelvis.
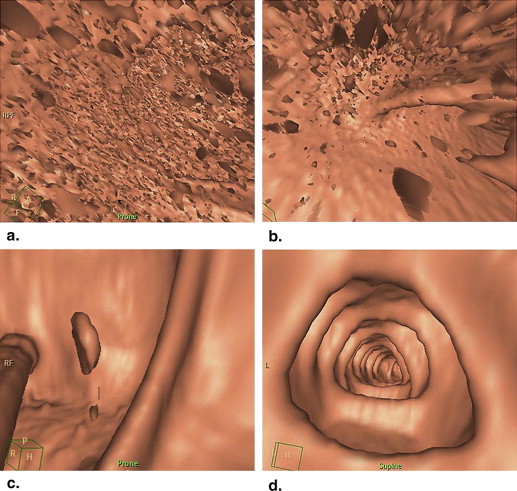
The radiation dose for CTC exams performed at our institution is much lower than the average dose in a survey reported by Liedenbaum et al , and is in the range of the lowest doses reported previously. The purpose of this study was to determine the potential of radiation dose reduction relative to the body mass index (BMI). After random assignment to one of two doses (15 mAs or 30 mAs), we evaluated three-dimensional (3D) image quality subjectively and image noise quantitatively. These findings were compared based on BMI to determine the best dose for patients with different body habitus. This information could serve as a guide for further reduction of patient radiation dose in CTC, using BMI as a parameter for individualized dose adjustment.
Materials and methods
Get Radiology Tree app to read full this article<
Get Radiology Tree app to read full this article<
Get Radiology Tree app to read full this article<
Get Radiology Tree app to read full this article<
Quantitative Assessment: Noise
Get Radiology Tree app to read full this article<
Qualitative Assessment: Conspicuity Score
Get Radiology Tree app to read full this article<
Get Radiology Tree app to read full this article<
Statistical Methods
Get Radiology Tree app to read full this article<
Results
Get Radiology Tree app to read full this article<
Get Radiology Tree app to read full this article<
Quantitative Assessment: Noise Analysis
Get Radiology Tree app to read full this article<
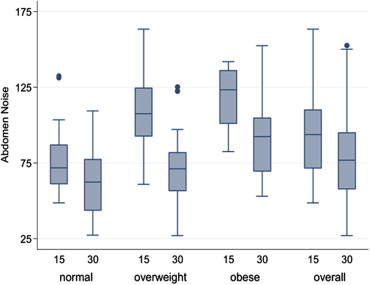
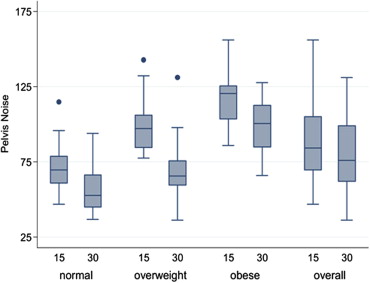
Table 1
Results from Random-Effects Linear Regression Models Fit to Image Noise
Variable Regression Coefficient 95% CI_P_ Value PELVIS BMI (per 1 SD increase) ∗ 29.3 (22.8, 35.7) <.001 mAs <.001 15 Referent 30 −24.6 (−30.8, −18.3) BMI × mAs interaction −13.9 (−21.9, −6.0) .001 Position Prone Referent Supine 6.5 (3.9, 9.0) <.001 Constant 95.2 (90.2, 100.3) <.001 ABDOMEN BMI (per 1 SD increase) ∗ 26.0 (19.5, 32.5) <.001 mAs <.001 15 Referent 30 −30.3 (−38.2, −22.3) BMI × mAs −9.7 (−17.4, −2.0) .01 Position <.001 Prone Referent Supine 9.6 (6.4, 12.8) Constant 98.3 (92.3, 104.4) <.001
CI, confidence interval.
Get Radiology Tree app to read full this article<
Get Radiology Tree app to read full this article<
Qualitative Assessment: Conspicuity Score Analysis
Per-Patient analysis (using maximum of supine and prone for each patient)
Get Radiology Tree app to read full this article<
Get Radiology Tree app to read full this article<
Per-CT scan analysis
Get Radiology Tree app to read full this article<
Get Radiology Tree app to read full this article<
Discussion
Get Radiology Tree app to read full this article<
Get Radiology Tree app to read full this article<
Get Radiology Tree app to read full this article<
Get Radiology Tree app to read full this article<
Get Radiology Tree app to read full this article<
Get Radiology Tree app to read full this article<
Get Radiology Tree app to read full this article<
Get Radiology Tree app to read full this article<
References
1. Levin B., Lieberman D.A., McFarland B., et. al.: Screening and surveillance for the early detection of colorectal cancer and adenomatous polyps, 2008: a joint guideline from the American Cancer Society, the US Multi-Society Task Force on Colorectal Cancer, and the American College of Radiology. Gastroenterology 2008; 134: pp. 1570-1595.
2. Seeff L., King J., Pollack L., et. al.: Increased use of colorectal cancer tests - United States, 2002 and 2004. MMWR Morb Mortal Wkly Rep 2006; 55: pp. 308-311.
3. American College of Radiology. ACR practice guideline for the performance of computed tomography (CT) colonography in adults. ACR Practice Guideline. 2009; http://www.acr.org/∼/media/A81531ACA92F45058A83B5281E8FE826.pdf .
4. Brenner D.J., Georgsson M.A.: Mass screening with CT colonography: should the radiation exposure be of concern?. Gastroenterogology 2005; 129: pp. 328-337.
5. Johnson C.D., Chen M.H., Toledano A.Y.: The national CT colonography trial: multicenter assessment of accuracy for detection of large adenomas and cancers. New Engl J Med 2008; 359: pp. 1207-1217.
6. Health Physics Society. Radiation risk in perspective: position statement of the Health Physics Society. Adopted January 1996, revised July 2010. http://hps.org/documents/risk_ps010-2.pdf .
7. Liedenbaum M.H., Venema H.W., Stoker J.: Radiation dose in CT colonography—trends in time and differences between daily practice and screening protocols. Eur Radiol 2008; 18: pp. 2222-2230.
8. Flicek K.T., Hara A.K., Silva A.C., et. al.: Reducing the radiation dose for CT colonography using adaptive statistical iterative reconstruction: a pilot study. AJR Am J Roentgenol 2010; 195: pp. 126-131.
9. Bankier A.A., Kressel H.Y.: Through the looking glass revisited: the need for more meaning and less drama in the reporting of dose and dose reduction in CT. Radiology 2012; 265: pp. 4-8.
10. American Association of Physicists in Medicine: Size-specific dose estimates (SSDE) in pediatric and adult body CT examinations. Task Group 204.2011.American Association of Physicists in MedicineCollege Park, MD http://www.aapm.org/pubs/reports/rpt_204.pdf
11. Christner J.A., Kofler J.M., McCollough C.H.: Estimating effective dose for CT using dose-length product compared with using organ doses: consequences of adopting International Commission on Radiological Protection publication 103 or dual-energy scanning. AJR Am J Roentgenol 2010; 194: pp. 881-889.
12. Hillier M.C., Lewis M.A., Dunn M.: Doses from computed tomography (CT) examinations in the UK: 2003 review.2005.National Radiological Protection BoardChilton, UK Report NRPB-W67
13. McFarland E.G., Fletcher J.G., Pickhardt P.P., et. al.: ACR colon cancer committee white paper: status of CT colonography 2009. J Am Coll Radiol 2009; 11: pp. 756-772.
14. McCollough C.H., Guimaraes L., Fletcher J.G.: In defense of body CT. AJR Am J Roentgenol 2009; 193: pp. 28-39.
15. Graser A., Wintersperger B.J., Suess C., et. al.: Dose reduction and image quality in MDCT colonography using tube current modulation. AJR Am J Roentgenol 2006; 187: pp. 695-701.
16. Fisichella V.A., Båth M., Allansdotter Johnsson A.: Evaluation of image quality and lesion perception by human readers on 3D CT colonography: comparison of standard and low radiation dose. Eur Radiol 2010; 20: pp. 630-639.
17. Schindera S.T., Diedrichsen L., Müller H.C., et. al.: Radiology. Iterative reconstruction algorithm for abdominal multidetector CT at different tube voltages: assessment of diagnostic accuracy, image quality, and radiation dose in a phantom study. Radiology 2011; 260: pp. 454-462.
18. Lubner M.G., Pickhardt P.J., Tang J., et. al.: Reduced image noise at low-dose multidetector CT of the abdomen with prior image constrained compressed sensing algorithm. Radiology 2011; 260: pp. 248-256.
19. Yoon M.A., Kim S.H., Lee J.M., et. al.: Adaptive statistical iterative reconstruction and Veo: assessment of image quality and diagnostic performance in CT colongraphy at various radiation doses. J Comput Assist Tomogr 2012; 36: pp. 596-601.
20. Prakash P., Kalra M.K., Kambadakone A.K., et. al.: Reducing abdominal CT radiation dose with adaptive statistical iterative reconstruction technique. Invest Radiol 2010; 45: pp. 202-210.
21. Silva A.C., Lawder H.J., Hara A., et. al.: Innovations in CT dose reduction strategy: application of the adaptive statistical iterative reconstruction algorithm. AJR Am J Roentgenol 2010; 194: pp. 191-199.