
Rationale and Objectives
To characterize the lipidic profile of bone marrow in the calcaneus and femoral neck of healthy, osteopenic, and osteoporotic women, by using magnetic resonance spectroscopy (MRS) at 3T. The final goal was to identify specific metabolites with the potential ability to discriminate between healthy, osteopenic, and osteoporotic subjects.
Materials and Methods
Sixty-two and thirty three postmenopausal women recruited to investigate calcaneus and femoral neck, respectively, underwent a bone mineral density (BMD) measurement to be classified as healthy subjects ( n = 22), osteopenic ( n = 45), or osteoporotic ( n = 28) patients.
MRS spectra were used to quantify and compare bone marrow fat resonances between the three BMD groups. Between-group differences were tested using a Welch analysis of variance. Multiple comparisons were made with the Games–Howell correction. Relationships between pairs of variables were assessed with linear correlation analysis. Reproducibility analysis was performed for all the lipid resonances in both sites.
Results
The reproducibility was satisfactory. In femoral neck, methylene (L13), glycerol (L41, L43), and total lipid resonances were significantly lower in healthy as compared to osteoporotic subjects. On the other hand, in calcaneus, L13/glycerol significantly discriminated between osteopenic and osteoporotic subjects whereas L13/(unsaturated lipid) discriminated between healthy and osteopenic group. However, the reproducibility of both unsaturated lipid and glycerol resonances were less optimal.
Conclusions
MRS of bone marrow lipid profiles from peripheral skeletal sites may be a promising tool for screening of large population to identify individuals with or at risk for developing osteoporosis. Moreover, it provides information about the metabolic changes occurring in bone marrow with the development of osteoporosis, which are skeletal site dependent.
Introduction
To date, several studies performed in different populations by using distinct measurement techniques have established that higher bone marrow fat is associated with lower bone mineral density (BMD) and prevalent vertebral fracture . This has led to a growing interest in the study of the interplay between marrow fat and bone mineral metabolism in connection to the development of osteoporosis.
Get Radiology Tree app to read full this article<
Get Radiology Tree app to read full this article<
Get Radiology Tree app to read full this article<
Get Radiology Tree app to read full this article<
Get Radiology Tree app to read full this article<
Get Radiology Tree app to read full this article<
Get Radiology Tree app to read full this article<
Get Radiology Tree app to read full this article<
Materials and Methods
Subjects
Get Radiology Tree app to read full this article<
Get Radiology Tree app to read full this article<
Get Radiology Tree app to read full this article<
Get Radiology Tree app to read full this article<
Get Radiology Tree app to read full this article<
Table 1
Participant Characteristics \*
Group Group I: Calcaneus Group II: Femoral Neck_N_ Mean Age (years) BMI (Kg/m 2 ) T-score \\ N Mean Age (years) T-score \\\* BMI (kg/m 2 ) Healthy 11 60.0 ± 4.1 25.80 ± 3.20 −1.2 ± 0.5 11 67.2 ± 9.2 −0.5 ± 0.3 26.80 ± 2.90 Osteopenic 33 62.0 ± 6.4 26.90 ± 4.80 −2.6 ± 0.4 12 68.8 ± 7.1 −1.8 ± 0.3 25.95 ± 3.60 Osteoporosis 18 63.6 ± 4.7 24.70 ± 4.10 −3.8 ± 0.5 10 72.5 ± 6.7 −3.1 ± 0.4 25.80 ± 3.10
BMI, body mass index.
Get Radiology Tree app to read full this article<
Get Radiology Tree app to read full this article<
Get Radiology Tree app to read full this article<
Get Radiology Tree app to read full this article<
MR Examination
Get Radiology Tree app to read full this article<
Calcaneus
Get Radiology Tree app to read full this article<
Get Radiology Tree app to read full this article<
Get Radiology Tree app to read full this article<
Get Radiology Tree app to read full this article<
Femoral Neck
Get Radiology Tree app to read full this article<
Get Radiology Tree app to read full this article<
Get Radiology Tree app to read full this article<
Data Analysis
Get Radiology Tree app to read full this article<
Get Radiology Tree app to read full this article<
Get Radiology Tree app to read full this article<
Get Radiology Tree app to read full this article<
Get Radiology Tree app to read full this article<
Get Radiology Tree app to read full this article<
Get Radiology Tree app to read full this article<
FC%=(ILipidI∑iLipidi+IW)∗100 F
C
%
=
(
I
Lipid
I
∑
i
Lipi
d
i
+
I
W
)
∗
100
where I∑iLipidi I
∑
i
Lipi
d
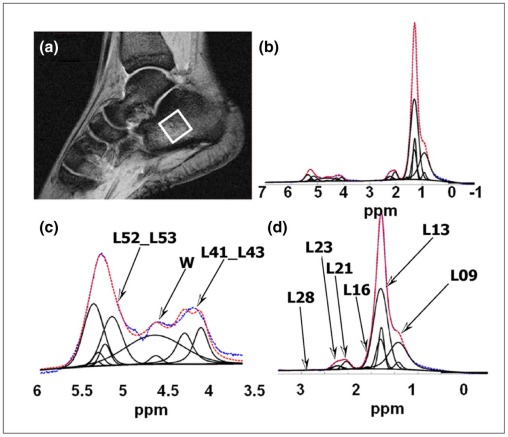
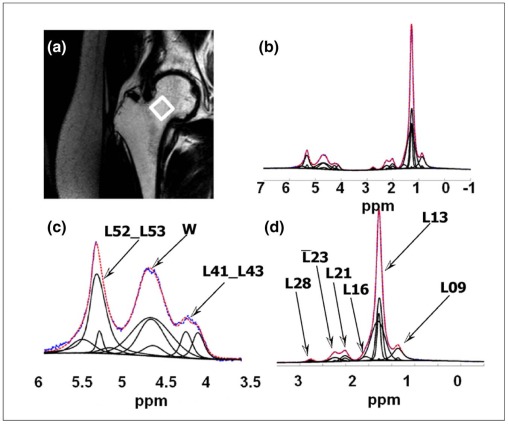
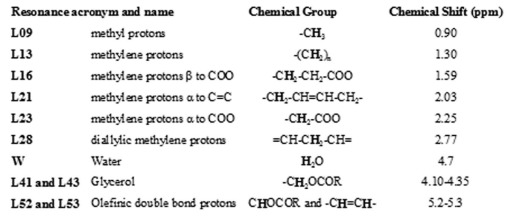
i is the sum of the area amplitudes of the resonances: L09, L13, L16, L21, L23, L28, L43, L41, and L52+L53, and I W is the area amplitude of water resonance.
Get Radiology Tree app to read full this article<
Get Radiology Tree app to read full this article<
UI=(IOlefinicIOlefinic+IMethylene+IMethyl) UI
=
(
I
Olefinic
I
Olefinic
+
I
Methylene
+
I
Methyl
)
where I Olefinic , I Methylene , I Methyl are the area amplitudes of the olefinic resonance (L53, L21, L28), methylene resonance (L13, L16, L21, L23, L43, and L41) and methyl resonance (L09), respectively .
Get Radiology Tree app to read full this article<
Get Radiology Tree app to read full this article<
TL=(I∑iLipidiI∑iLipidi+IWater)∗100 T
L
=
(
I
∑
i
Lipi
d
i
I
∑
i
Lipi
d
i
+
I
Water
)
∗
100
Get Radiology Tree app to read full this article<
Statistical Analysis
Get Radiology Tree app to read full this article<
Get Radiology Tree app to read full this article<
Get Radiology Tree app to read full this article<
Get Radiology Tree app to read full this article<
Reproducibility of Lipid Quantification
Get Radiology Tree app to read full this article<
Get Radiology Tree app to read full this article<
Results
Subjects
Get Radiology Tree app to read full this article<
FC, Age, and T-Score
Calcaneus
Get Radiology Tree app to read full this article<
Get Radiology Tree app to read full this article<
Table 2
The Short (CV s ) and Long-Time (CV l ) Reliability in Both Femoral and Calcaneus Site
Open full size image
 terms ranging from 0% to 5%.
 terms ranging from 5% to 10%.
Get Radiology Tree app to read full this article<
Get Radiology Tree app to read full this article<
Table 3
Person Correlation Coefficient between FC, L13/L41, L13/L43, L13/L51+L52, Age, T-Score in Femoral Neck and Calcaneus
Open full size image
 Significant correlation.
\\ P-value <0.01.
\* P-value <0.05.
FC, fat content.
Table 4
Bone Marrow FC in Calcaneus and Femoral Neck According to BMD Status to Show Differences between Groups (Healthy, Osteopenic, Osteoporotic)
Open full size image
 Statistically significant differences between FC of healthy and osteopenic subjects.
 Statistically significant differences between FC of osteopenic and osteoporotic subjects.
 Statistically significant differences between FC of healthy and osteoporotic subjects.
BMD, bone mineral content; FC, fat content; NS, No statistically significant differences.
Get Radiology Tree app to read full this article<
Get Radiology Tree app to read full this article<
Femoral Neck
Get Radiology Tree app to read full this article<
Get Radiology Tree app to read full this article<
Get Radiology Tree app to read full this article<
Get Radiology Tree app to read full this article<
Get Radiology Tree app to read full this article<
Get Radiology Tree app to read full this article<
Discussion
Get Radiology Tree app to read full this article<
Get Radiology Tree app to read full this article<
Get Radiology Tree app to read full this article<
Get Radiology Tree app to read full this article<
Get Radiology Tree app to read full this article<
Get Radiology Tree app to read full this article<
Get Radiology Tree app to read full this article<
Get Radiology Tree app to read full this article<
Get Radiology Tree app to read full this article<
Get Radiology Tree app to read full this article<
Get Radiology Tree app to read full this article<
Get Radiology Tree app to read full this article<
Get Radiology Tree app to read full this article<
Get Radiology Tree app to read full this article<
Get Radiology Tree app to read full this article<
Get Radiology Tree app to read full this article<
Get Radiology Tree app to read full this article<
Get Radiology Tree app to read full this article<
Acknowledgments
Get Radiology Tree app to read full this article<
References
1. Schwartz A.V.: Marrow fat and bone: review of clinical findings. Front Endocrinol (Lausanne) 2015; 6: pp. 40.
2. Rosen C.J., Bouxsein M.L.: Mechanisms of disease: is osteoporosis the obesity of bone?. Nat Clin Pract Rheumatol 2006; 2: pp. 35-43.
3. Bermeo S., Gunaratnam K., Duque G.: Fat and bone interactions. Curr Osteop Report 2014; 12: pp. 235-242.
4. Bredella M.A.: Perspective: the bone-fat connection. Skeletal Radiol 2010; 39: pp. 729-731.
5. Justesen J., Stenderup K., Ebbesen E.N., et. al.: Adipocyte tissue volume in bone marrow is increased with aging and in patients with osteoporosis. Biogerontology 2001; 2: pp. 165-171.
6. Devlin M.J.: Bone marrow composition, diabetes, and fracture risk: more bad news for saturated fat. J Bone Miner Res 2013; 28: pp. 1718-1720.
7. Lindon J.C., Holmes E., Nicholson J.K.: Metabonomics techniques and applications to pharmaceutical research & development. Pharm Res 2006; 23: pp. 1075-1088.
8. Craske J.D., Bannon C.D.: Gas liquid chromatography analysis of the fatty acid composition of fats and oils: a total system for high accuracy. J Am Oil Chem Soc 1987; 64: pp. 1413-1417.
9. Shi C., Wang X., Wu S., et. al.: HRMAS 1H-NMR measured changes of the metabolite profile as mesenchymal stem cells differentiate to targeted fat cells in vitro: implications for non-invasive monitoring of stem cell differentiation in vivo. J Tissue Eng Regen Med 2008; 2: pp. 482-490.
10. Katz-Brull R., Lavin P.T., Lenkinski R.E.: Clinical utility of proton magnetic resonance spectroscopy in characterizing breast lesions. J Natl Cancer Inst 2002; 94: pp. 1197-1203.
11. Soares D.P., Law M.: Magnetic resonance spectroscopy of the brain: review of metabolites and clinical applications. Clin Radiol 2009; 64: pp. 12-21.
12. Mehta S.R., Thomas E.L., Bell J.D., et. al.: Non-invasive means of measuring hepatic fat content. World J Gastroenterol 2008; 14: pp. 3476-3483.
13. Costello L.C., Franklin R.B., Narayan P.: Citrate in the diagnosis of prostate cancer. Prostate 1999; 38: pp. 237-245.
14. Schick F.: Bone marrow NMR in vivo. Prog Nucl Mag Res Spec 1996; 29: pp. 169-227.
15. Miyake Y., Yokomizo K., Matsuzaki N.: Determination of unsaturated fatty acid composition by high-resolution nuclear magnetic resonance spectroscopy. J Am Oil Chem Soc 1998; 75: pp. 1091-1094.
16. Yeung D.K.W., Lam S.L., Griffith J.F., et. al.: Analysis of bone marrow fatty acid composition using high-resolution proton NMR spectroscopy. Chem Phys Lipids 2008; 151: pp. 103-109.
17. Ren J., Dimitrov I., Sherry A.D., et. al.: Composition of adipose tissue and marrow fat in humans by 1H NMR at 7 tesla. J Lipid Res 2008; 49: pp. 2055-2062.
18. Griffith J.F., Yeung D.K.W., Antonio G.E., et. al.: Vertebral bone mineral density marrow perfusion and fat content in healthy men and men with osteoporosis: dynamic contrast-enhanced MR imaging and MR spectroscopy. Radiology 2005; 236: pp. 945-951.
19. Yeung D.K.W., Griffith J.F., Antonio G.E., et. al.: Osteoporosis is associated with increased marrow fat content and decreased marrow fat unsaturation: a proton MR spectroscopy study. J Magn Reson Imaging 2005; 22: pp. 279-285.
20. Griffith J.F., Yeung D.K.W., Antonio G.E., et. al.: Vertebral marrow fat content and diffusion and perfusion indexes in women with varying bone density: MR evaluation. Radiology 2006; 241: pp. 831-838.
21. Li X., Kuo D., Schafer A.L., et. al.: Quantification of vertebral bone marrow fat content using 3 tesla MR spectroscopy: reproducibility, vertebral variation, and applications in osteoporosis. J Magn Reson Imaging 2011; 33: pp. 974-979.
22. Cummings S.R., Melton L.J.: Osteoporosis I: epidemiology and outcomes of osteoporotic fractures. Lancet 2002; 359: pp. 1761-1767.
23. Wehrli F.W., Hilaire L., Fernández-seara M., et. al.: Quantitative magnetic resonance imaging in the calcaneus and femur of women with varying degrees of osteopenia and vertebral deformity status. J Bone Miner Res 2002; 17: pp. 2265-2273.
24. Link T.M., Bauer J., Kollstedt A., et. al.: Trabecular bone structure of the distal radius, the calcaneus, and the spine: which site predicts fracture status of the spine best?. Invest Radiol 2004; 39: pp. 487-497.
25. Patel P.V., Eckstein F., Carballido-Gamio J., et. al.: Fuzzy logic structure analysis of trabecular bone of the calcaneus to estimate proximal femur fracture load and discriminate subjects with and without vertebral fractures using high-resolution magnetic resonance imaging at 1.5T and 3T. Calcified Tissue Intl 2007; 81: pp. 294-304.
26. Blake G.M., Griffith J.F., Yeung D.K.W., et. al.: Effect of increasing vertebral marrow fat content on BMD measurement, T-Score status and fracture risk prediction by DXA. Bone 2009; 44: pp. 495-501.
27. WHO Scientific Group Report: Prevention and management of osteoporosis.World Health Organ Tech Rep. Ser. No. 9212000.
28. Engelke K., Adams J.E., Armbrecht G.: Clinical use of quantitative computed tomography and peripheral quantitative computed tomography in the management of osteoporosis in adults: the 2007 ISCD official positions. J Clin Densitom 2008; 11: pp. 123-162.
29. Bottomley P.A.: Spatial localization in NMR spectroscopy in vivo. Ann NY Acad Sci 1987; 508: pp. 333-348.
30. Provencher S.W.: Automatic quantitation of localized in vivo 1H spectra with LCModel. NMR Biomed 2001; 14: pp. 260-264.
31. Liney G.P., Bernard G.P., Manton D.J., et. al.: Age, gender, and skeletal variation in bone marrow composition: a preliminary study at 3.0 tesla. J Magn Reson Imaging 2007; 26: pp. 787-793.
32. Griffith J.F., Yeung D.K.W., Tsang P.H., et. al.: Compromised bone marrow perfusion in osteoporosis. J Bone Miner Res 2008; 23: pp. 1068-1075.
33. Wehrli F.W., Hopkins J.A., Hwang S.N., et. al.: Cross-sectional study of osteopenia with quantitative MRI imaging and bone densitometry. Radiology 2008; 217: pp. 527-538.
34. De Santis S., Rebuzzi M., Di Pietro G., et. al.: In vitro and in vivo MR evaluation of internal gradient to assess trabecular bone density. Phys Med Biol 2010; 55: pp. 5767-5785.
35. Manenti G., Capuani S., Fanucci E., et. al.: Diffusion tensor imaging and magnetic resonance spectroscopy assessment of cancellous bone quality in femoral neck of healthy, osteopenic and osteoporotic subjects at 3T: preliminary experience. Bone 2013; 55: pp. 7-15.
36. Capuani S.: Diffusion in cancellous bone. Microp Mesop Mater 2013; 178: pp. 34-38.
37. Rebuzzi M., Vinicola V., Taggi F., et. al.: Potential diagnostic role of the MRI-derived internal magnetic field gradient in calcaneus cancellous bone for evaluating postmenopausal osteoporosis at 3T. Bone 2013; 57: pp. 155-163.
38. Pansini V.M., Monnet A., Salleron J., et. al.: Reproducibility of 1 H MR spectroscopy of hip bone marrow at 3 tesla. J Magn Reson Imaging 2012; 36: pp. 1445-1449.
39. Griffith J.F., Yeung D.K., Chow S.K., et. al.: Reproducibility of MR perfusion and H spectroscopy of bone marrow. J Magn Reson Imaging 2009; 29: pp. 1438-1442.
40. Patsch J.M., Li X., Baum T., et. al.: Bone marrow fat composition as a novel imaging biomarker in postmenopausal women with prevalent fragility fractures. J Bone Mineral Res 2013; 28: pp. 1721-1728.
41. Hamilton G., Middleton S.M., Bydder M., et. al.: The effect of PRESS and STEAM sequences on magnetic resonance spectroscopic liver fat quantification. J Magn Reson Imaging 2009; 30: pp. 145-152.
42. Karampinos D.C., Melkus G., Baum T., et. al.: Bone marrow fat quantification in the presence of trabecular bone: initial comparison between water-fat imaging and single-voxel MRS. Magn Reson Med 2013; 71: pp. 1158-1165.
43. Wehrli F.W., Ford J.C., Attie M., et. al.: Trabecular structure: preliminary application of MR interferometry. Radiology 1991; 179: pp. 615-621.
44. Li Z.W., Piao C.D., Sun H.H., et. al.: Asiatic acid inhibits adipogenic differentiation of bone marrow stromal cells. Cell Biochem Biophys 2014; 68: pp. 437-442.
45. Chanprasertyothin S., Saetung S., Rajatanavin R., et. al.: Genetic variant in the aquaporin 9 gene is associated with bone mineral density in postmenopausal women. Endocrine 2010; 38: pp. 83-86.
46. Guggenheim M.A., McCabe E.R., Roig M., et. al.: Glycerol kinase deficiency with neuromuscular, skeletal, and adrenal abnormalities. Ann Neurol 1980; 7: pp. 441-449.
47. Lafontan M., Langin D.: Lipolysis and lipid mobilization in human adipose tissue. Prog Lipid Res 2009; 48: pp. 275-297.
48. Jackuliak P., Payer J.: Osteoporosis, fractures, and diabetes. Int J Endocrinol 2014; 2014: pp. 820615.
49. Orchard T.S., Cauley J.A., Frank G.C., et. al.: Fatty acid consumption and risk of fracture in the women’s health initiative. Am J Clin Nutr 2010; 92: pp. 1452-1460.
50. Bredella A.M., Fazeli P.K., Daley S.M., et. al.: Marrow fat composition in anorexia nervosa. Bone 2014; 66: pp. 199-204.