
Rationale and Objectives
The purpose of this work is to determine if the speed of sound value of a breast cyst can aid in the clinical management of breast masses. Breast macrocysts are defined as fluid-filled tissue masses >1 cm in diameter and are thought to be aberrations of normal development and involution, often associated with apocrine metaplasia. The benign natural history of breast cysts is well known, and it is important to obtain high specificity in breast imaging to avoid unnecessary biopsies in women who have benign diseases, particularly those with dense breast tissue. Transmission ultrasound is a tomographic imaging modality that generates high-resolution, 3D speed of sound maps that could be used to identify breast tissue types and act as a biomarker to differentiate lesions. We performed this study to investigate the microanatomy of macrocysts observed using transmission ultrasound, as well as assess the relationship of speed of sound to the physical and biochemical parameters of cyst fluids.
Materials and Methods
Cyst fluid samples were obtained from 37 patients as part of a case-collection study for ultrasound imaging of the breast. The speed of sound of each sample was measured using a quantitative transmission ultrasound scanner in vivo. Electrolytes, protein, cholesterol, viscosity, and specific gravity were also measured (in the aspirated cyst fluid) to assess their relationship to the speed of sound values obtained during breast imaging.
Results
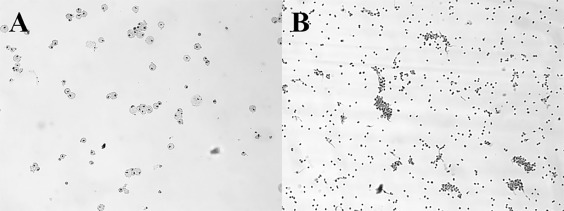
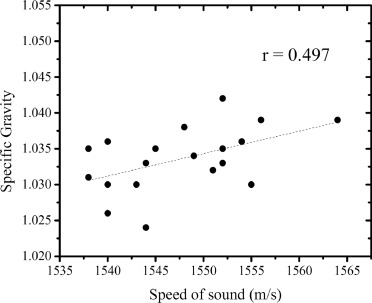
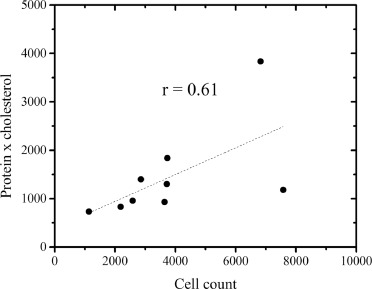
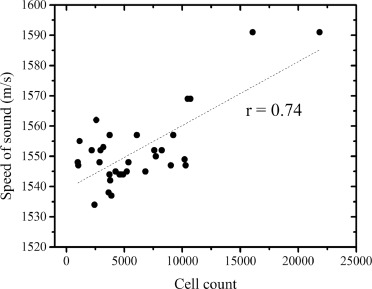
We found positive correlations between viscosity and cholesterol ( r = 0.71) and viscosity and total protein × cholesterol ( r = 0.78). Additionally, we performed direct cell counts on cyst fluids and confirmed a positive correlation of number of cells with speed of sound ( r = 0.74). The speed of sound of breast macrocysts, as observed using transmission ultrasound, correlated with the cytological features of intracystic cell clumps.
Conclusion
On the basis of our work with speed as a classifier, we propose a spectrum of breast macrocysts from fluid-filled to highly cellular. Our results suggest high-speed cysts are mature macrocysts with high cell counts and many cellular clumps that correlate with cyst microanatomy as seen by transmission ultrasound. Further studies are needed to confirm our findings and to assess the clinical value of speed of sound measurements in breast imaging using transmission ultrasound.
INTRODUCTION
Biology of Breast Cysts
The normal breast consists of segments (lobes) drained by collecting ducts. The segments consist of lobules composed of terminal ducts, acini and their supporting stroma ( ). Breast macrocysts are reviewed by Hughes and are defined as fluid-filled tissue masses >1 cm in diameter ( ). They were first described in 1829 and are thought to be aberrations of normal development and involution, often associated with apocrine metaplasia ( ). Macrocysts are seen in 21% of women at postmortem and in over 10,000 breast biopsies for benign disease of which 23% had macrocysts ( ). Cysts are manifestations of lobular involution and their origin from the breast lobule has been demonstrated using histochemical techniques ( ). They are usually lined by a single layer of epithelium which has proteins found only in apocrine epithelium ( ). Evidence that active secretion is responsible for cyst formation has come from analysis of cyst fluid ( ). The benign natural history of breast cysts is well known in these women with a low incidental risk for cancer ( ). Thus, it is important to have high specificity in breast imaging to avoid unnecessary biopsies in women who have benign diseases, particularly in those women with dense breast tissue ( ).
Transmission Ultrasound
Quantitative transmission (QT) ultrasound is an imaging modality based on tomographic techniques extended to ultrasound. In such a system, images are generated using both reflection and transmission techniques. While transmission ultrasound has been investigated as an adjunct to mammography for quite some time, recent developments in hardware and imaging algorithms have enabled marked improvements in spatial resolution and clinical utility ( ). Physically, a transmitter and receiver pair is colocated with multiple reflection transducers with various focal lengths in a U-shaped arrangement ( ). The transmitter emits a plane wave that is received by the receiver with multiple acquisitions at frequencies ranging from 300 kHz to 1.5 MHz as the U-channel is rotated 360° around the subject. Once acquired, the projection information is reconstructed using nonlinear inverse scattering in 3D ( ). The result of this reconstruction is a quantitative volume map of speed of sound (measured at 1.5 MHz), with units of meters per second (m/s). In reflection ultrasound imaging, each of the three reflection transducers (4 MHz center frequency) with different focal lengths are alternately fired between transmission measurements in a B-mode acquisition. The resulting images are compounded together and corrected for refraction using the speed map computed in the transmission phase. This compounding produces a nonquantitative image that is proportional to impedance mismatch, referred to simply as reflection units (RUs). The result of each scan is a 3D volume of speed and reflection. These image stacks are precisely coregistered since they are acquired at the same time, so they can be put together to form a 3D view of the object in the field of view. The imaging system can image human breast tissue anatomy with high spatial and contrast resolution, while the speed of sound information corresponds well with tissue specificity ( ).
Mass Visualization Using Transmission Ultrasound
Get Radiology Tree app to read full this article<
Cyst Fluid Analysis by Others
Get Radiology Tree app to read full this article<
METHODS
Samples
Get Radiology Tree app to read full this article<
Get Radiology Tree app to read full this article<
Chemical Analysis
Get Radiology Tree app to read full this article<
Get Radiology Tree app to read full this article<
Cytological Analysis
Get Radiology Tree app to read full this article<
Get Radiology Tree app to read full this article<
Get Radiology Tree app to read full this article<
Statistical and Correlation Analysis
Get Radiology Tree app to read full this article<
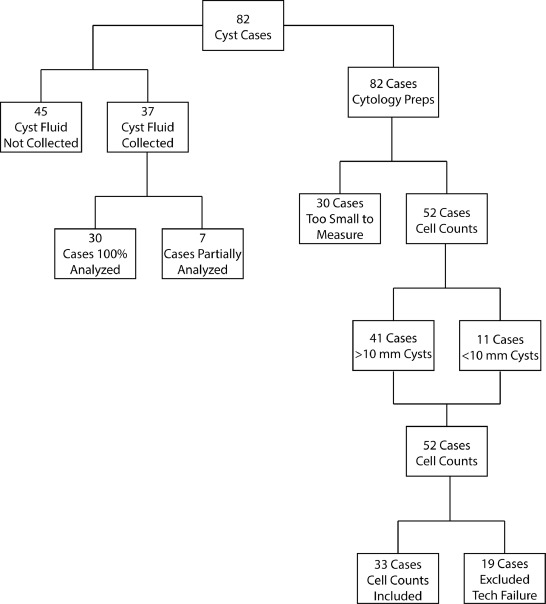
Case Selection and Exclusion
Get Radiology Tree app to read full this article<
Get Radiology Tree app to read full this article<
RESULTS
Chemical Correlations
Get Radiology Tree app to read full this article<
Table 1
Chemical analysis results from 30 patient samples
Cyst Sodium Potassium Na/K Ratio Total Protein Cholesterol Viscosity Sp. Gravity 1 139 4.3 32.8 3.3 691 1.71 1.033 2 22 99.6 0.2 2.8 342 1.36 1.039 3 44 86.2 0.5 2.8 656 1.6 1.039 4 136 4.4 31.2 2.8 1369 2.92 1.035 5 24 98 0.2 1.7 489 QNS 1.033 6 <20 140.2 <0.1 2.3 29 1.39 1.035 7 140 4 35 4.1 380 1.55 1.032 8 39 88.7 0.4 1.2 376 1.2 1.03 9 140 4.1 34.5 4.7 637 1.96 1.036 10 <18 110.2 <0.2 2.5 559 QNS 1.038 11 65 77 0.8 1.7 766 2.43 1.033 12 24 107.1 0.2 1.3 563 1.17 1.03 13 22 94.1 0.2 1.7 695 QNS 1.035 14 137 15.1 9.1 1.6 606 QNS 1.03 15 85 65.7 1.3 2.8 810 1.61 1.04 16 47 108.9 0.4 2.1 442 1.43 1.035 17 137 3.9 34.6 3.4 499 1.23 1.031 18 24 87.9 0.3 1.9 841 2.49 1.038 19 136 3.9 34.7 2 861 1.89 1.028 20 31 117 0.3 1.4 653 1.28 1.032 21 23 119.7 0.2 2.4 886 QNS 1.041 22 137 6 22.9 1.5 728 1.55 1.026 23 40 87.1 0.5 0.8 285 1.25 1.024 24 135 4.4 30.8 4.4 1369 7.97 1.042 25 106 38.1 2.8 1.9 744 1.37 1.03 26 94 >54.6 >1.7 2.1 968 3.12 1.036 27 83 63.9 1.3 2.4 665 2.52 1.033 28 49 91.3 0.5 2 805 3.64 1.034 29 <20 120.9 <0.2 2.1 820 3.8 1.035 30 140 14.8 9.4 1.4 883 2.62 1.03
Sodium/potassium = mmol/L; Protein = g/L; Cholesterol = mg/dL; Viscosity = centipoise; Specific Gravity = g per volume of cyst fluid/1 g per volume of water. QNS = the quantity provided was not sufficient to perform the analysis.
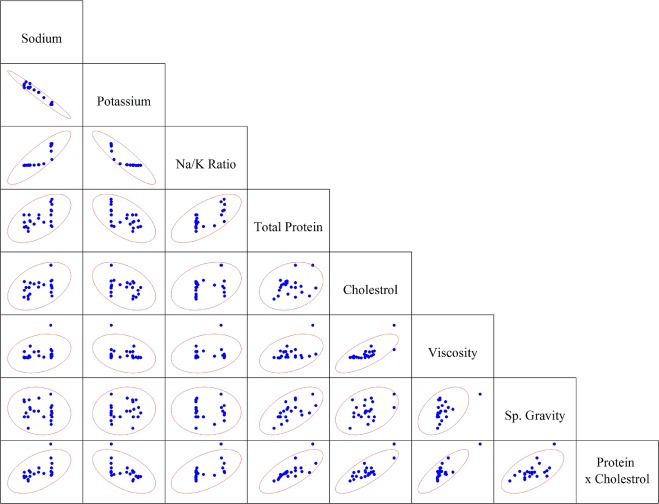
Table 2
Values of Pearson Product-Moment Correlation Coefficients (r) for Scatterplots Shown in Figure 3 and Data in Table 1 . An Additional Variable “Protein × Cholesterol” was Added, Which is the Product of Protein and Cholesterol
Sodium Potassium Na/K ratio Total Protein Cholesterol Viscosity Sp. Gravity Prot. × Chol. Sodium 1.00 − − − − − − − Potassium −0.98 1.00 − − − − − − Na/K ratio 0.83 −0.87 1.00 − − − − − Total protein 0.44 −0.45 0.63 1.00 − − − − Cholesterol 0.39 −0.39 0.32 0.22 1.00 − − − Viscosity 0.12 −0.13 0.18 0.36 0.71 1.00 − − Sp. gravity −0.26 0.26 −0.15 0.54 0.35 0.48 1.00 − Prot. × chol. 0.47 −0.48 0.55 0.71 0.79 0.78 0.54 1.00
Get Radiology Tree app to read full this article<
Get Radiology Tree app to read full this article<
Speed of Sound Correlations
Get Radiology Tree app to read full this article<
Get Radiology Tree app to read full this article<
Get Radiology Tree app to read full this article<
Get Radiology Tree app to read full this article<
Get Radiology Tree app to read full this article<
Cyst Classification
Get Radiology Tree app to read full this article<
Get Radiology Tree app to read full this article<
Get Radiology Tree app to read full this article<
Table 3
Classification Summary (Confusion Matrix) as Generated by Linear Discriminant Analysis Using Leave-One-Out Cross Validation Scheme
Predicted Group Large Cysts Small Cysts Accuracy Actual group Large cysts 36 5 88% Small cysts 3 8 73%
Get Radiology Tree app to read full this article<
Get Radiology Tree app to read full this article<
Discussion
Get Radiology Tree app to read full this article<
Get Radiology Tree app to read full this article<
Get Radiology Tree app to read full this article<
Get Radiology Tree app to read full this article<
Get Radiology Tree app to read full this article<
Get Radiology Tree app to read full this article<
Get Radiology Tree app to read full this article<

Get Radiology Tree app to read full this article<
Limitations of the Study
Get Radiology Tree app to read full this article<
CONCLUSIONS
Get Radiology Tree app to read full this article<
Get Radiology Tree app to read full this article<
ACKNOWLEDGMENTS
Get Radiology Tree app to read full this article<
Get Radiology Tree app to read full this article<
Get Radiology Tree app to read full this article<
References
1. Moinfar F: Essentials of diagnostic breast pathology: a practical approach. with … 6 tables2007.SpringerBerlin; Heidelberg
2. Hughes LE, Bundred NJ: Breast macrocysts. World J Surg 1989; 13: pp. 711-714.
3. Cooper AP: Illustrations of the diseases of the breast…In two parts. Pt. 1. pp. 89. pl. IX1829.Longman, Rees, Orme, Brown & GreenLondon
4. Hughes LE, Mansel RE, Webster DJ: Aberrations of normal development and involution (ANDI): a new perspective on pathogenesis and nomenclature of benign breast disorders. Lancet 1987; 2: pp. 1316-1319.
5. Davis HH, Simons M, Davis JB: Cystic disease of the breast: relationship to carcinoma. Cancer 1964; 17: pp. 957-978.
6. Dupont WD, Page DL: Risk factors for breast cancer in women with proliferative breast disease. N Engl J Med 1985; 312: pp. 146-151.
7. Azzopardi JG, Ahmed A, Millis RR: Problems in breast pathology. Major Prob Pathol 1979; pp. 11.
8. Bundred NJ, Miller WR, Walker RA: An immunohistochemical study of the tissue distribution of the breast cyst fluid protein, zinc alpha 2 glycoprotein. Histopathology 1987; 11: pp. 603-610.
9. Bradlow HL, Skidmore FD, Schwartz MK, et. al.: Cation levels in human breast cyst fluid. Clin Oncol 1981; 7: pp. 388-390.
10. Bhate RD, Chakravorty A, Ebbs SR: Management of breast cysts revisited. Int J Clin Pract 2007; 61: pp. 195-199.
11. Know Error: DNA Specimen Provenance Assay - DSPA Testing. [cited 2017 October 9] Available at: http://knowerror.com/system-details/dspa-testing/
12. Ong MS, Mandl KD: National expenditure for false-positive mammograms and breast cancer overdiagnoses estimated at $4 billion a year. Health Affairs 2015; 34: pp. 576-583.
13. Glover GH: Computerized time-of flight ultrasonic tomography for breast examination. Ultrasound Med Biol 1977; 3: pp. 117-127.
14. Greenleaf JF, Bahn RC: Clinical imaging with transmissive ultrasonic computerized tomography. IEEE Trans Biomed Eng 1981; 28: pp. 177-185.
15. Wiskin J, Borup D, Johnson S, et. al.: Three-dimensional nonlinear inverse scattering: quantitative transmission algorithms, refraction corrected reflection, scanner design and clinical results. Proc Meetings Acoust 2013; 19:
16. Andre M, Wiskin J, Borup D: Clinical results with ultrasound computed tomography of the breast.2013.SpringerNew York:pp. 395-432.
17. Andre M, Wiskin J, Borup D, et. al.: Quantitative volumetric breast imaging with 3D inverse scatter computed tomography. Conf Proc IEEE Eng Med Biol Soc 2012; 2012: pp. 1110-1113.
18. Wiskin J, Borup DT, Johnson SA, et. al.: Non-linear inverse scattering: high resolution quantitative breast tissue tomography. J Acoust Soc Am 2012; 131: pp. 3802-3813.
19. Lenox MW, Wiskin J, Lewis MA, et. al.: Imaging performance of quantitative transmission ultrasound. Int J Biomed Imaging 2015; 2015:
20. Klock JC, Iuanow E, Malik B, et. al.: Anatomy-correlated breast imaging and visual grading analysis using quantitative transmission ultrasound TM . Int J Biomed Imaging 2016; 2016: pp. 9.
21. Malik B, Klock J, Wiskin J, et. al.: Objective breast tissue image classification using quantitative transmission ultrasound tomography. Sci Rep 2016; 6: pp. 38857.
22. Iuanow E, Smith K, Obuchowski NA, et. al.: Accuracy of cyst versus solid diagnosis in the breast using quantitative transmission (QT) ultrasound. Acad Radiol 2017; 24: pp. 1148-1153.
23. Sartorius OW: The biochemistry of breast cyst fluids and duct secretions. Breast Cancer Res Treat 1995; 35: pp. 255-266.
24. Tsung JS, Wang TY, Wang SM, et. al.: Cytological and biochemical studies of breast cyst fluid. Breast 2005; 14: pp. 37-41.
25. Dixon JM, Miller WR, Scott WN, et. al.: The morphological basis of human breast cyst populations. Br J Surg 1983; 70: pp. 604-606.
26. Sánchez LM, Díez-Itza I, Vizoso F, et. al.: Cholesterol and apolipoprotein D in gross cystic disease of the breast. Clin Chem 1992; 38: pp. 695-698.
27. Dogliotti L, Orlandi F, Torta M, et. al.: Cations and dehydroepiandrosterone-sulfate in cyst fluid of pre- and menopausal patients with gross cystic disease of the breast. Evidence for the existence of subpopulations of cysts. Eur J Cancer Clin Oncol 1986; 22: pp. 1301-1307.
28. Cobas 8000 modular analyzer series [cited 2017 October 9] Available at: https://usdiagnostics.roche.com/en/core_laboratory/instrument/cobas-8000-analyzer-series.html .
29. Total Protein Gen. 2 [cited 2017 October 9] Available at: https://usdiagnostics.roche.com/products/03183734190/PARAM66/overlay.html .
30. In vitro test for the quantitative determination of cholesterol in human serum and plasma on Roche/Hitachi cobas c systems. [cited 2017 October 9] Available at: https://usdiagnostics.roche.com/products/03039773190/PARAM41/overlay.html .
31. Cooke BM, Stuart J: Automated measurement of plasma viscosity by capillary viscometer. J Clin Pathol 1988; 41: pp. 1213-1216.
32. ThinPrep Pap Test [cited 2017 October 9] Available at: https://healthdxs.com/en/thinprep/ .
33. Papanicolaou GN, Traut HF: Diagnosis of uterine cancer by the vaginal smear.1949.Commonwealth FundNew York
34. 510(k) Summary: Cobas 8000 ISE Module, Urine Sample Type [cited 2017 October 9] Available at: https://www.accessdata.fda.gov/cdrh_docs/pdf12/K123726.pdf .
35. Image Analysis DotCount v1.2 [cited 2017 October 9] Available at: http://reuter.mit.edu/software/dotcount/ .
36. Ishimaru A: Wave propagation and scattering in random media.2005.IEEE PressPiscataway, NJ
37. Ophir J, Jaeger P: A ternary solution for independent acoustic impedance and speed of sound matching to biological tissues. Ultrason Imaging 1982; 4: pp. 163-170.
38. Kalinicheva T, Frisch N, Giorgadze T, et. al.: Etiologic factors related to unsatisfactory ThinPrep® cervical cytology: evaluation and potential solutions to improve. CytoJournal 2015; 12: pp. 21.