
Rationale and Objectives
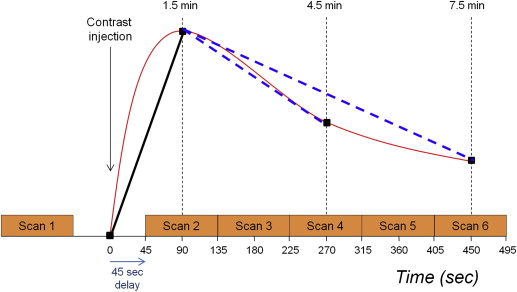
Breast dynamic contrast-enhanced magnetic resonance imaging (DCE-MRI) scanning protocols vary widely. The purpose of this study was to determine the effects of postcontrast timing on delayed-phase lesion kinetics assessment and ability to discriminate malignant from benign lesions.
Materials and Methods
Following institutional review board approval, we retrospectively reviewed all lesions assessed on magnetic resonance examinations from April 2005 to June 2006. DCE-MRI was performed with 90-second temporal resolution. Delayed-phase kinetic parameters including percentages of persistent, plateau, and washout, and categorizations of predominant and worst curve type were compared between 4.5 and 7.5 minutes postcontrast. Ability to discriminate benign and malignant lesions based on delayed-phase kinetic parameters was compared between postcontrast timings by receiver operating characteristic (ROC) analysis.
Results
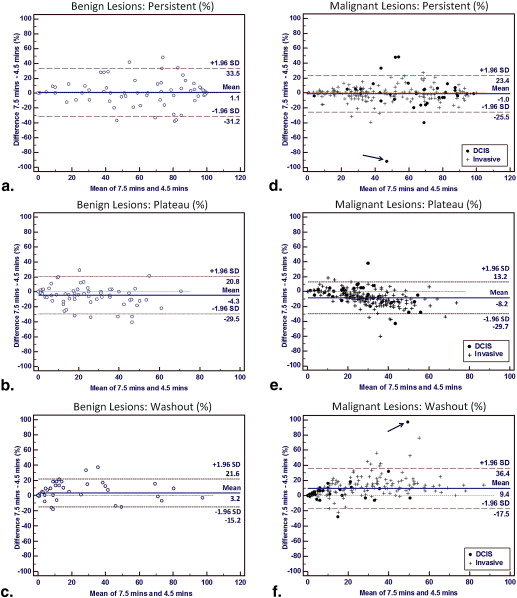
Two hundred eighty consecutive breast lesions (206 malignant and 74 benign) were evaluated in 228 women. Comparing kinetics assessments at 7.5 versus 4.5 minutes: volume percentage of washout increased in malignancies by a mean of 9.4% ( P < .0001) and increased slightly in benign lesions (mean 3.2%, P = .007); predominant curve type categorizations changed significantly only for malignancies ( P < .0001); and worst curve categorizations did not change significantly for either benign or malignant lesions ( P > .05). There were no significant differences between timings in area under ROC curves for delayed-phase kinetic parameters.
Conclusions
The choice of delayed postcontrast timing more strongly affects the kinetics assessments for malignancies than benign breast lesions, but our results suggest that a shortened breast DCE-MRI protocol may not significantly impact diagnostic accuracy. Furthermore, worst curve type classifications are least affected by postcontrast timing and may provide reliable assessment of delayed-phase kinetics across protocols.
Dynamic contrast-enhanced magnetic resonance imaging (DCE-MRI) is an important tool for screening high-risk women, evaluating extent of disease in patients with newly diagnosed breast cancer, and monitoring breast tumors during neoadjuvant treatment . DCE-MRI provides sensitive and moderately specific characterization of breast lesions when used in conjunction with the American College of Radiology (ACR) MRI Breast Imaging Reporting and Data System (BI-RADS) lexicon to assess lesion morphology and initial and delayed enhancement patterns . In addition to established diagnostic morphologic features such as margin and distribution , DCE-MRI enhancement kinetics has been reported to improve delineation between benign and malignant lesions in multiple studies .
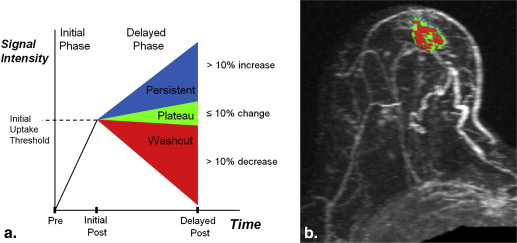
The shape of the time–signal intensity curve is an important measure in characterizing enhancing lesions , and computer-aided evaluation of enhancement kinetics improves diagnostic accuracy . For standardized reporting and as recommended by the ACR BI-RADS lexicon, enhancement of breast lesions is defined by initial-phase and delayed-phase enhancement. Initial-phase enhancement is classified as slow, medium, or rapid depending on the slope of the line from time zero (at the time of contrast injection) to the peak enhancement within the first 2 minutes. Delayed enhancement is classified as persistent (increasing), plateau (stable), or washout (decreasing) curve types . In general, a washout curve has been shown to be a strong independent predictor of malignancy in prior studies, with Kuhl et al. reporting cancer in 87% of lesions with any washout and Schnall et al. identifying malignancy in 76% of such lesions .
Get Radiology Tree app to read full this article<
Get Radiology Tree app to read full this article<
Materials and methods
Get Radiology Tree app to read full this article<
Patients and Lesions
Get Radiology Tree app to read full this article<
Breast MRI Technique
Get Radiology Tree app to read full this article<
Get Radiology Tree app to read full this article<
Initial Interpretation
Get Radiology Tree app to read full this article<
CAE and Kinetic Data
Get Radiology Tree app to read full this article<
Get Radiology Tree app to read full this article<
Get Radiology Tree app to read full this article<
Data Collection
Get Radiology Tree app to read full this article<
Statistical Analysis
Get Radiology Tree app to read full this article<
Results
Patients and Lesions
Get Radiology Tree app to read full this article<
Table 1
Patient and Lesion Characteristics
Characteristic_N_ (%) Age (N = 228 patients) <40 years 28 (12) 40–49 years 59 (26) 50–59 years 67 (29) 60–69 years 47 (21) >70 years 27 (12) Lesion characteristics ( N = 280 lesions) Lesion size <1 cm 78 (28) 1–2 cm 82 (29) 2.1–5 cm 80 (29) >5 cm 40 (14) Histopathology Benign 74 (26) DCIS 35 (13) Invasive Ductal Carcinoma 151 (54) Invasive Lobular Carcinoma 17 (6) Other malignancies ∗ 3 (1) Lesion type Focus 8 (3) Mass 189 (68) Non–mass enhancement 83 (30) ACR BI-RADS classification BI-RADS 3 33 (12) BI-RADS 4 72 (26) BI-RADS 5 7 (3) BI-RADS 6 168 (60)
ACR, American College of Radiology; BI-RADS, Breast Imaging Reporting and Data System; DCIS, ductal carcinoma in situ.
Get Radiology Tree app to read full this article<
Get Radiology Tree app to read full this article<
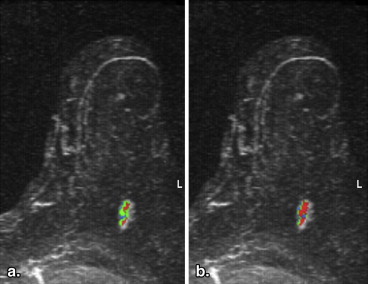
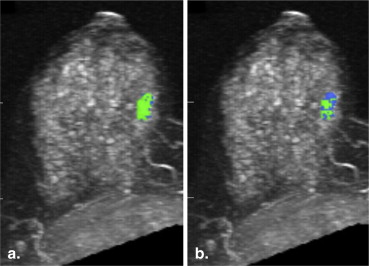
Lesion Delayed Enhancement Patterns
Get Radiology Tree app to read full this article<
Get Radiology Tree app to read full this article<
Get Radiology Tree app to read full this article<
Table 2
Lesion Volume Percentages of Persistent, Plateau, and Washout Curve Types Compared at 4.5 and 7.5 minutes Postcontrast
Curve Types_N_ 4.5 Minutes, Median (Range) 7.5 Minutes, Median (Range) Wilcoxon Signed Rank Test P Value Benign lesions 74 Persistent 70.5 (0–100) 69.0 (0–100) .48 Plateau 19.5 (0–72) 17.5 (0–71) .002 Washout 0.4 (0–99) 0.3 (0–96) .007 Malignant lesions 206 Persistent 45.5 (0–100) 45.0 (0–100) .12 Plateau 32.5 (0–85) 23.0 (0–66) <.0001 Washout 12.0 (0–80) 22.5 (0–98) <.0001 Invasive carcinoma 171 Persistent 40.0 (0–100) 36.0 (0–100) .10 Plateau 35.0 (0–85) 23.0 (0–66) <.0001 Washout 15.0 (0–80) 27.0 (0–94) <.0001 Ductal carcinoma in situ 35 Persistent 73.0 (6–99) 64.0 (1–98) .75 Plateau 23.0 (1–70) 24.0 (1–52) .03 Washout 2.0 (0–52) 8.0 (0–98) .003
Get Radiology Tree app to read full this article<
Predominant Curve Type
Get Radiology Tree app to read full this article<
Table 3
Predominant Curve Type Classifications Compared at 4.5 and 7.5 minutes Postcontrast
Predominant Curve Types_N_ 4.5 Minutes, N (%) 7.5 Minutes, N (%) Chi-squared P Value Benign lesions 74 .35 Persistent 54 (73.0) 55 (74.3) Plateau 12 (16.2) 7 (9.5) Washout 8 (10.8) 12 (16.2) Malignant lesions 206 <.0001 Persistent 109 (52.9) 111 (53.9) Plateau 64 (31.1) 27 (13.1) Washout 33 (16.0) 68 (33.0) Invasive lesions 171 <.0001 Persistent 83 (48.5) 83 (48.5) Plateau 56 (32.8) 24 (14.0) Washout 32 (18.7) 64 (37.4) Ductal carcinoma in situ lesions 35 .14 ∗ Persistent 26 (74.3) 28 (80.0) Plateau 8 (22.9) 3 (8.6) Washout 1 (2.9) 4 (11.4)
Get Radiology Tree app to read full this article<
Get Radiology Tree app to read full this article<
Worst Curve Type
Get Radiology Tree app to read full this article<
Table 4
Worst Curve Type Classifications Compared at 4.5 and 7.5 minutes Postcontrast
Worst Curve Types_N_ 4.5 Minutes, N (%) 7.5 Minutes, N (%) Chi-squared P -value Benign lesions 74 .97 Persistent 12 (16.2) 13 (17.6) Plateau 20 (27.0) 20 (27.0) Washout 42 (56.8) 41 (55.4) Malignant lesions 206 .23 ∗ Persistent 2 (1.0) 3 (1.5) Plateau 21 (10.2) 12 (5.8) Washout 183 (88.8) 191 (92.7) Invasive lesions 171 .51 ∗ Persistent 2 (1.2) 3 (1.8) Plateau 16 (9.4) 10 (5.9) Washout 153 (89.5) 158 (92.4) Ductal carcinoma in situ 35 † Persistent 0 (0) 0 (0) Plateau 5 (14.3) 2 (5.7) Washout 30 (85.7) 33 (94.3)
Get Radiology Tree app to read full this article<
Get Radiology Tree app to read full this article<
Get Radiology Tree app to read full this article<
Diagnostic Accuracy
Get Radiology Tree app to read full this article<
Table 5
Receiver Operating Characteristic (ROC) Curve Analysis
ROC Curve Comparison 4.5-Minute Protocol 7.5-Minute Protocol_P_ Value AUC 95% CI AUC 95% CI All lesions ( N = 280) ∗ Percentage washout 0.70 0.64–0.75 0.72 0.66–0.77 .27 Predominant curve 0.60 0.54–0.65 0.61 0.55–0.67 .65 Worst curve 0.67 0.61–0.72 0.69 0.63–0.74 .42 MRI-detected lesions ( N = 112) † Percentage washout 0.64 0.54–0.73 0.70 0.60–0.78 .08 Predominant curve 0.56 0.46–066 0.59 0.50–.068 .31 Worst curve 0.63 0.53–0.72 0.68 0.58–0.76 .13
AUC, area under the curve; BI-RADS, Breast Imaging Reporting and Data System.
Get Radiology Tree app to read full this article<
Get Radiology Tree app to read full this article<
![Figure 7, Receiver operating characteristic analysis for discriminating 280 breast lesions (206 malignant and 74 benign) based on delayed-phase kinetics. Percentage washout curve type produced area under the curve (AUC) of 0.70 (95% confidence interval [CI]: 0.64–0.75) and 0.72 (95% CI: 0.66–0.77) at 4.5 and 7.5 minutes, respectively (a) . Predominant curve type produced AUC of 0.60 (95% CI: 0.54–0.65) and 0.61 (95% CI: 0.55–0.67) at 4.5 and 7.5 minutes, respectively (b) . Worst curve type produced AUC of 0.67 (95% CI: 0.61–0.72) and 0.69 (95% CI: 0.63–0.74) at 4.5 and 7.5 minutes, respectively (c) . Differences in AUC between the 4.5 and 7.5 minutes assessments were not significant for any of the delayed-phase characteristics ( P > .05).](https://storage.googleapis.com/dl.dentistrykey.com/clinical/BreastDCEMRI/6_1s20S1076633214001615.jpg)
Get Radiology Tree app to read full this article<
Discussion
Get Radiology Tree app to read full this article<
Get Radiology Tree app to read full this article<
Get Radiology Tree app to read full this article<
Get Radiology Tree app to read full this article<
Get Radiology Tree app to read full this article<
Get Radiology Tree app to read full this article<
Get Radiology Tree app to read full this article<
References
1. DeMartini W., Lehman C., Partridge S.: Breast MRI for cancer detection and characterization: a review of evidence-based clinical applications. Acad Radiol 2008; 15: pp. 408-416.
2. Kuhl C.K.: Current status of breast MR imaging. Part 2. Clinical applications. Radiology 2007; 244: pp. 672-691.
3. Saslow D., Boetes C., Burke W., et. al.: American Cancer Society guidelines for breast screening with MRI as an adjunct to mammography. CA Cancer J Clin 2007; 57: pp. 75-89.
4. Morris E.A., Comstock C.E., Lee C.H., et. al.: ACR BI-RADS ® Magnetic Resonance Imaging. In: ACR BI-RADS ® Atlas, Breast Imaging Reporting and Data System. Reston, VA. American College of Radiology 2013;
5. Mahoney M.C., Gatsonis C., Hanna L., et. al.: Positive predictive value of BI-RADS MR imaging. Radiology 2012; 264: pp. 51-58.
6. Demartini W.B., Kurland B.F., Gutierrez R.L., et. al.: Probability of malignancy for lesions detected on breast MRI: a predictive model incorporating BI-RADS imaging features and patient characteristics. Eur Radiol 2011; 21: pp. 1609-1617.
7. Kuhl C.K., Mielcareck P., Klaschik S., et. al.: Dynamic breast MR imaging: are signal intensity time course data useful for differential diagnosis of enhancing lesions?. Radiology 1999; 211: pp. 101-110.
8. Schnall M.D., Blume J., Bluemke D.A., et. al.: Diagnostic architectural and dynamic features at breast MR imaging: multicenter study. Radiology 2006; 238: pp. 42-53.
9. Wang L.C., DeMartini W.B., Partridge S.C., et. al.: MRI-detected suspicious breast lesions: predictive values of kinetic features measured by computer-aided evaluation. AJR Am J Roentgenol 2009; 193: pp. 826-831.
10. Williams T.C., DeMartini W.B., Partridge S.C., et. al.: Breast MR imaging: computer-aided evaluation program for discriminating benign from malignant lesions. Radiology 2007; 244: pp. 94-103.
11. American College of Radiology Breast MRI Accreditation Program Requirements. Available at: http://www.acr.org/Quality-Safety/Accreditation/BreastMRI . Accessed June 4, 2014.
12. Weinreb J., Wilcox P.A., Hayden J., et. al.: ACR MRI accreditation: yesterday, today, and tomorrow. J Am Coll Radiol 2005; 2: pp. 494-503.
13. Mann R.M., Kuhl C.K., Kinkel K., et. al.: Breast MRI: guidelines from the European Society of Breast Imaging. Eur Radiol 2008; 18: pp. 1307-1318.
14. Hendrick R.E.: Breast MRI: fundamentals and technical aspects.2008.SpringerNew York, NY
15. DeLong E.R., DeLong D.M., Clarke-Pearson D.L.: Comparing the areas under two or more correlated receiver operating characteristic curves: a nonparametric approach. Biometrics 1988; 44: pp. 837-845.
16. El Khouli R.H., Macura K.J., Barker P.B., et. al.: Relationship of temporal resolution to diagnostic performance for dynamic contrast enhanced MRI of the breast. J Magn Reson Imaging 2009; 30: pp. 999-1004.
17. Kuhl C.: The current status of breast MR imaging. Part I. Choice of technique, image interpretation, diagnostic accuracy, and transfer to clinical practice. Radiology 2007; 244: pp. 356-378.
18. Moon M., Cornfeld D., Weinreb J.: Dynamic contrast-enhanced breast MR imaging. Magn Reson Imaging Clin N Am 2009; 17: pp. 351-362.
19. Gutierrez R.L., Strigel R.M., Partridge S.C., et. al.: Dynamic breast MRI: does lower temporal resolution negatively affect clinical kinetic analysis?. AJR Am J Roentgenol 2012; 199: pp. 703-708.
20. El Khouli R.H., Macura K.J., Jacobs M.A., et. al.: Dynamic contrast-enhanced MRI of the breast: quantitative method for kinetic curve type assessment. AJR Am J Roentgenol 2009; 193: pp. W295-W300.
21. Huang W., Tudorica L.A., Li X., et. al.: Discrimination of benign and malignant breast lesions by using shutter-speed dynamic contrast-enhanced MR imaging. Radiology 2011; 261: pp. 394-403.
22. Chen H, Olson ML, Partridge SC, Kerwin W. Reducing the scan time in quantitative dynamic contrast enhanced MRI of the breast using the extended graphical model. International Society of Magnetic Resonance in Medicine 21st Annual Meeting, April 22, 2013. Salt Lake City, UT. 3059.
23. Jansen S.A., Shimauchi A., Zak L., et. al.: Kinetic curves of malignant lesions are not consistent across MRI systems: need for improved standardization of breast dynamic contrast-enhanced MRI acquisition. AJR Am J Roentgenol 2009; 193: pp. 832-839.