
Rationale and Objectives
The purpose of this study was to compare the precision of mammographic breast density measurement using radiologist reader assessment, histogram threshold segmentation, fuzzy C-mean segmentation, and spectral material decomposition.
Materials and Methods
Spectral mammography images from a total of 92 consecutive asymptomatic women (aged 50–69 years) who presented for annual screening mammography were retrospectively analyzed for this study. Breast density was estimated using 10 radiologist reader assessment, standard histogram thresholding, fuzzy C-mean algorithm, and spectral material decomposition. The breast density correlation between left and right breasts was used to assess the precision of these techniques to measure breast composition relative to dual-energy material decomposition.
Results
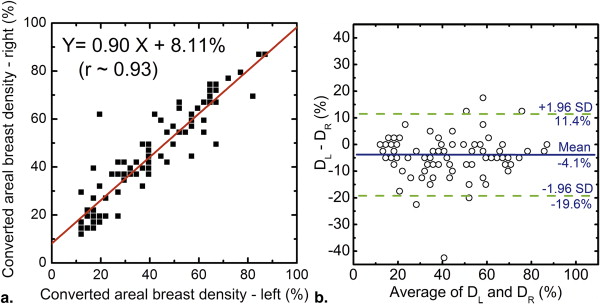
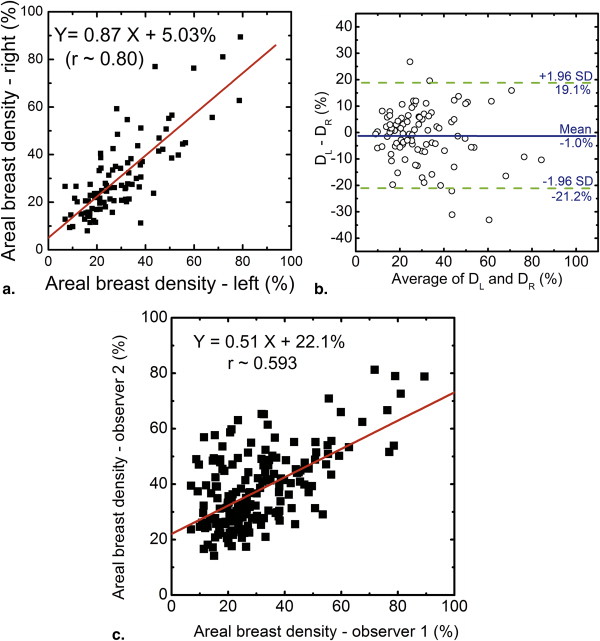
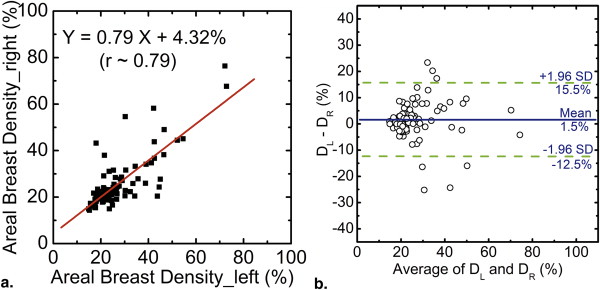
In comparison to the other techniques, the results of breast density measurements using dual-energy material decomposition showed the highest correlation. The relative standard error of estimate for breast density measurements from left and right breasts using radiologist reader assessment, standard histogram thresholding, fuzzy C-mean algorithm, and dual-energy material decomposition was calculated to be 1.95, 2.87, 2.07, and 1.00, respectively.
Conclusions
The results indicate that the precision of dual-energy material decomposition was approximately factor of two higher than the other techniques with regard to better correlation of breast density measurements from right and left breasts.
Mammographic breast density is an important risk factor in the development of breast cancer . Previous reports have shown that women with the highest mammographic density (75%–100%) have 4- to 5-fold increased risk of developing breast cancer compared to the lowest density (0%–25%) . Furthermore, it has been shown that the sensitivity of screening mammography is lower among women with dense breasts . Therefore, improved methods of measuring breast density could potentially be helpful in more accurately quantifying breast cancer risk and monitor changes in risk over time. This is especially important because breast density can change with external factors such as hormonal agents and diet. The importance of quantitative breast density assessment has been highlighted by a previous report indicating that for every 1% increase of mammographic breast density, there is a 2% increase of the relative risk for breast cancer .
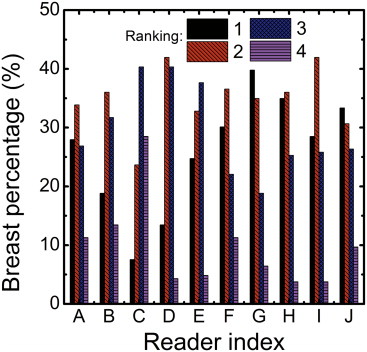
Qualitative classification of mammographic breast density is the current clinical standard. However, subjective classification of breast density is limited by its considerable intra reader and inter reader variability . Therefore, there have been previous reports of more automated methods using area-based and volume-based techniques to measure breast density . The area-based techniques essentially use a histogram of image gray levels for segmentation of fibroglandular and adipose tissues . These techniques are limited by the segmentation process and the fact that the three-dimensional nature of the breast is not taken into account. The current volume-based techniques use paddle position and a shape model for estimation of breast thickness, which is used in breast thickness calculation . However, these techniques are limited by the assumptions required in the breast shape model and the errors associated with the paddle position measurement, which can lead to a 2-to 3-fold increase in measurement error in volumetric breast density .
Get Radiology Tree app to read full this article<
Get Radiology Tree app to read full this article<
Materials and methods
Image Acquisition
Get Radiology Tree app to read full this article<
Breast Density Measurement
Radiologist Reader Assessment
Get Radiology Tree app to read full this article<
Histogram Threshold Segmentation
Get Radiology Tree app to read full this article<
Fuzzy C-Mean Segmentation
Get Radiology Tree app to read full this article<
Dual-Energy Material Decomposition
Get Radiology Tree app to read full this article<
Statistical Analysis
Get Radiology Tree app to read full this article<
Results
Get Radiology Tree app to read full this article<
Get Radiology Tree app to read full this article<
Get Radiology Tree app to read full this article<
Get Radiology Tree app to read full this article<
Get Radiology Tree app to read full this article<
Get Radiology Tree app to read full this article<
Get Radiology Tree app to read full this article<
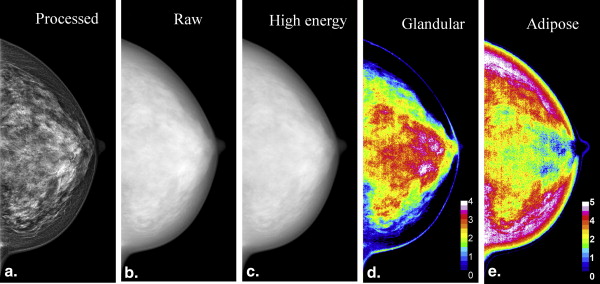
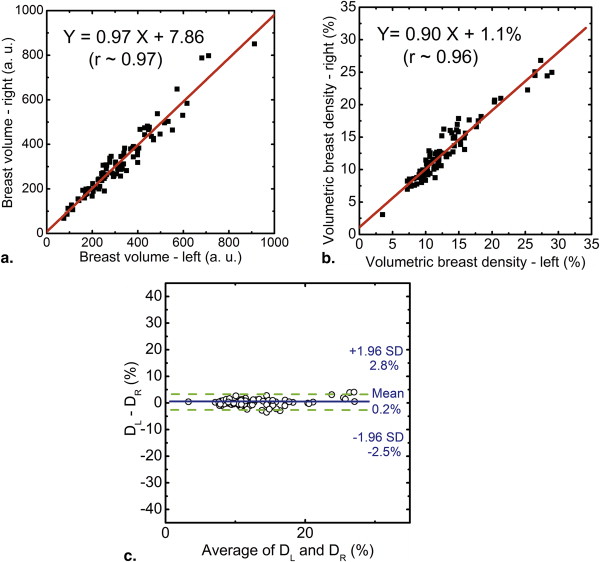
Table 1
Summary of the Linear Regression Analysis Between Left and Right Breast Density Measurements for Various Methods
Method Slope Intercept, % Pearson r Normalized Relative Variance Readers 0.90 8.1 0.93 1.95 Cumulus 0.87 5.0 0.80 2.87 Fuzzy C-mean 0.79 4.3 0.79 2.07 Spectral 0.90 1.1 0.96 1.00
Get Radiology Tree app to read full this article<
Discussion
Get Radiology Tree app to read full this article<
Get Radiology Tree app to read full this article<
Get Radiology Tree app to read full this article<
Get Radiology Tree app to read full this article<
Get Radiology Tree app to read full this article<
Get Radiology Tree app to read full this article<
Acknowledgments
Get Radiology Tree app to read full this article<
Get Radiology Tree app to read full this article<
References
1. Wolfe J.N.: Breast patterns as an index of risk for developing breast cancer. American Journal of Roentgenology 1976; 126: pp. 1130-1137.
2. McCormack V.A., dos Santos Silva I.: Breast density and parenchymal patterns as markers of breast cancer risk: a meta-analysis. Cancer Epidemiol Biomarkers Prev 2006; 15: pp. 1159-1169.
3. Saftlas A.F., Szklo M.: Mammographic parenchymal patterns and breast-cancer risk. Epidemiologic Reviews 1987; 9: pp. 146-174.
4. Warner E., Lockwood G., Math M., et. al.: The risk of breast-cancer associated with mammographic parenchymal patterns: a metaanalysis of the published literature to examine the effect of method of classification. Cancer Detection and Prevention 1992; 16: pp. 67-72.
5. Kopans D.B.: Basic physics and doubts about relationship between mammographically determined tissue density and breast cancer risk. Radiology 2008; 246: pp. 348-353.
6. Tice J.A., OMeara E.S., Weaver D.L., et. al.: Benign breast disease, mammographic breast density, and the risk of breast cancer. Jnci-Journal of the National Cancer Institute 2013; 105: pp. 1043-1049.
7. Harvey J.A., Yaffe M.J.: Density and breast cancer risk. Radiology 2013; 267: pp. 657-658.
8. Boyd N.F., Byng J.W., Jong R.A., et. al.: Quantitative classification of mammographic densities and breast-cancer risk–results from the Canadian National Breast Screening Study. Journal of the National Cancer Institute 1995; 87: pp. 670-675.
9. Boyd N.F., Guo H., Martin L.J., et. al.: Mammographic density and the risk and detection of breast cancer. N Engl J Med 2007; 356: pp. 227-236.
10. Boyd N.F., Martin L.J., Sun L.M., et. al.: Body size, mammographic density, and breast cancer risk. Cancer Epidemiology Biomarkers & Prevention 2006; 15: pp. 2086-2092.
11. Buist D.S., Porter P.L., Lehman C., et. al.: Factors contributing to mammography failure in women aged 40-49 years. J Natl Cancer Inst 2004; 96: pp. 1432-1440.
12. Byrne C., Schairer C., Wolfe J., et. al.: Mammographic features and breast-cancer risk–effects with time, age, and menopause status. Journal of the National Cancer Institute 1995; 87: pp. 1622-1629.
13. Carney P.A., Miglioretti D.L., Yankaskas B.C., et. al.: Individual and combined effects of age, breast density, and hormone replacement therapy use on the accuracy of screening mammography. Ann Intern Med 2003; 138: pp. 168-175.
14. D’Orsi C.J., Mendelson E.B., Ikeda D.M.: Breast imaging reporting and data system (BI-RADS).2004.American College of RadiologyReston, VA:
15. D’Orsi C.J., Getty D.J., Pickett R.M., et. al.: Stereoscopic digital mammography: improved specificity and reduced rate of recall in a prospective clinical trial. Radiology 2013; 266: pp. 81-88.
16. Jackson V.P., Hendrick R.E., Feig S.A., et. al.: Imaging of the radiographically dense breast. Radiology 1993; 188: pp. 297-301.
17. Kerlikowske K., Grady D., Barclay J., et. al.: Effect of age, breast density, and family history on the sensitivity of first screening mammography. JAMA 1996; 276: pp. 33-38.
18. Vacek P.M., Geller B.M.: A prospective study of breast cancer risk using routine mammographic breast density measurements. Cancer Epidemiol Biomarkers Prev 2004; 13: pp. 715-722.
19. Boyd N.F., Greenberg C., Lockwood G., et. al.: Effects at two years of a low-fat, high-carbohydrate diet on radiologic features of the breast: results from a randomized trial. Canadian Diet and Breast Cancer Prevention Study Group. J Natl Cancer Inst 1997; 89: pp. 488-496.
20. Berg W.A., Campassi C., Langenberg P., et. al.: Breast Imaging Reporting and Data System: inter- and intraobserver variability in feature analysis and final assessment. AJR Am J Roentgenol 2000; 174: pp. 1769-1777.
21. Ooms E.A., Zonderland H.M., Eijkemans M.J.C., et. al.: Mammography: interobserver variablility in breast density assessment. Breast 2007; 16: pp. 568-576.
22. Oza A.M., Boyd N.F.: Mammographic parenchymal patterns: a marker of breast-cancer risk. Epidemiologic Reviews 1993; 15: pp. 196-208.
23. Carton A.K., Li J.J., Chen S., et. al.: Optimization of contrast-enhanced digital breast tomosynthesis.Astley S.M.Brady M.Rose C. et. al.Digital Mammography, Proceedings.2006.pp. 183-189.
24. Highnam R., Jeffreys M., McCormack V., et. al.: Comparing measurements of breast density. Physics in Medicine and Biology 2007; 52: pp. 5881-5895.
25. Highnam R., Pan X., Warren R., et. al.: Breast composition measurements using retrospective standard mammogram form (SMF). Phys Med Biol 2006; 51: pp. 2695-2713.
26. Alonzo-Proulx O., Tyson A., Mawdsley G., et. al.: Effect of tissue thickness variation in volumetric breast density estimation.Krupinski E.Digital mammography.2008.SpringerBerlin/Heidelberg:pp. 659-666.
27. Ducote J.L., Molloi S.: Quantification of breast density with dual energy mammography: a simulation study. Medical Physics 2008; 35: pp. 5411-5418.
28. Ducote J.L., Molloi S.: Quantification of breast density with dual energy mammography: an experimental feasibility study. Medical Physics 2010; 37: pp. 793-801.
29. Molloi S., Ducote J.L., Ding H., et. al.: Postmortem validation of breast density using dual-energy mammography. Med Phys 2014; 41: pp. 081917.
30. Aslund M., Cederstrom B., Lundqvist M., et. al.: Physical characterization of a scanning photon counting digital mammography system based on Si-strip detectors. Medical Physics 2007; 34: pp. 1918-1925.
31. Bornefalk H., Lewin J.M., Danielsson M., et. al.: Single-shot dual-energy subtraction mammography with electronic spectrum splitting: feasibility. Eur J Radiol 2006; 60: pp. 275-278.
32. Fredenberg E., Hemmendorff M., Cederstrom B., et. al.: Contrast-enhanced spectral mammography with a photon-counting detector. Med Phys 2010; 37: pp. 2017-2029.
33. Fredenberg E., Lundqvist M., Cederstrom B., et. al.: Energy resolution of a photon-counting silicon strip detector. Nuclear Instruments & Methods in Physics Research Section a-Accelerators Spectrometers Detectors and Associated Equipment 2010; 613: pp. 156-162.
34. Ding H., Molloi S.: Quantification of breast density with spectral mammography based on a scanned multi-slit photon-counting detector: a feasibility study. Physics in Medicine and Biology 2012; 57: pp. 4719-4738.
35. Johnson T., Ding H., Le H.Q., et. al.: Breast density quantification with cone-beam CT: a post-mortem study. Phys Med Biol 2013; 58: pp. 8573-8591.
36. Byng J.W., Boyd N.F., Fishell E., et. al.: The quantitative-analysis of mammographic densities. Physics in Medicine and Biology 1994; 39: pp. 1629-1638.
37. Keller B.M., Nathan D.L., Wang Y., et. al.: Estimation of breast percent density in raw and processed full field digital mammography images via adaptive fuzzy c-means clustering and support vector machine segmentation. Med Phys 2012; 39: pp. 4903-4917.
38. Tagliafico A.S., Tagliafico G., Cavagnetto F., et. al.: Estimation of percentage breast tissue density: comparison between digital mammography (2D full field digital mammography) and digital breast tomosynthesis according to different BI-RADS categories. Br J Radiol 2013; 86: pp. 20130255.
39. Ducote J.L., Klopfer M.J., Molloi S.: Volumetric lean percentage measurement using dual energy mammography. Medical Physics 2011; 38: pp. 4498-4504.
40. Fleiss J.L.: Measuring nominal scale agreement among many raters. Psychological Bulletin 1971; 76: pp. 378-382.
41. Bland J.M., Altman D.G.: Statistical methods for assessing agreement between two methods of clinical measurement. Lancet 1986; 1: pp. 307-310.
42. Martin K.E., Helvie M.A., Zhou C., et. al.: Mammographic density measured with quantitative computer-aided method: comparison with radiologists’ estimates and BI-RADS categories. Radiology 2006; 240: pp. 656-665.
43. Chen J.H., Chan S., Liu Y.J., et. al.: Consistency of breast density measured from the same women in four different MR scanners. Med Phys 2012; 39: pp. 4886-4895.
44. Ding H., Johnson T., Lin M., et. al.: Breast density quantification using magnetic resonance imaging (MRI) with bias field correction: a postmortem study. Med Phys 2013; 40: pp. 122305.
45. Nelson T.R., Cervino L.I., Boone J.M., et. al.: Classification of breast computed tomography data. Med. Phys 2008; 35: pp. 1078-1086.
46. Yang X., Wu S., Sechopoulos I., et. al.: Cupping artifact correction and automated classification for high-resolution dedicated breast CT images. Med Phys 2012; 39: pp. 6397-6406.
47. Ding H., Ducote J.L., Molloi S.: Measurement of breast tissue composition with dual energy cone-beam computed tomography: a postmortem study. Medical Physics 2013; 40: pp. 061902.
48. Ding H., Klopfer M.J., Ducote J.L., et. al.: Breast tissue characterization with photon-counting spectral CT imaging: a postmortem breast study. Radiology 2014; pp. 132732.