
Rationale and Objectives
Women make up half of American medical school graduates, but remain underrepresented among radiologists. This study sought to determine whether workforce gender disparities exist in other countries, and to identify any country-specific indices associated with increased female representation.
Materials and Methods
In this cross-sectional study, 95 professional radiology organizations in 75 countries were contacted via email to provide membership statistics, including proportion of female members, female members aged 35 or under, and women in society leadership positions. Country-specific metrics collected included gross domestic product, Gini index, percent female medical school enrollment, and Gender Development Index for the purposes of univariate multiple regression analysis.
Results
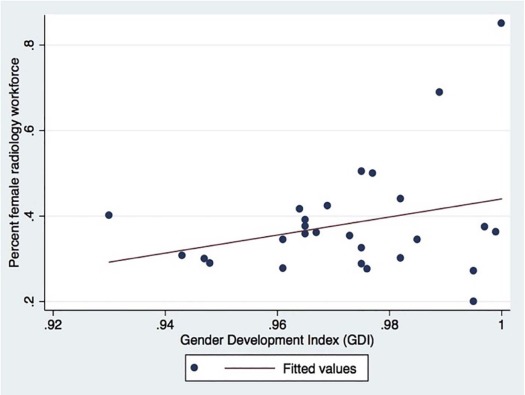
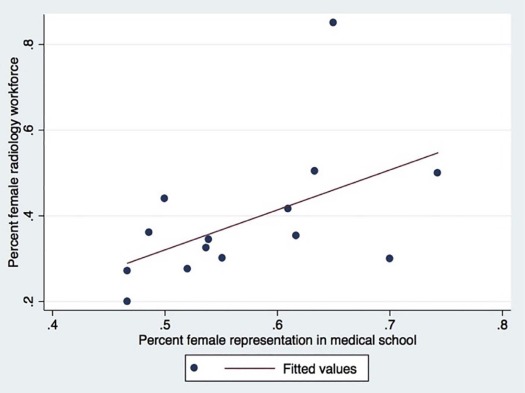
Twenty-nine organizations provided data on 184,888 radiologists, representing 26 countries from Europe ( n = 12), North America ( n = 2), Central/South America ( n = 6), Oceania ( n = 2), Asia ( n = 3), and Africa ( n = 1) for a response rate of 34.7% (26/75). Globally, 33.5% of radiologists are female. Women constitute a higher proportion of younger radiologists, with 48.5% of radiologists aged 35 or under being female. Female representation in radiology is lowest in the United States (27.2%), highest in Thailand (85.0%), and most variable in Europe (mean 40.1%, range 28.8%–68.9%). The proportion of female radiologists was positively associated with a country’s Gender Development Index ( P = .006), percent female medical student enrollment ( P = .001), and Gini index ( P = .002), and negatively associated with gross domestic product ( P = .03).
Conclusions
Women are underrepresented in radiology globally, most notably in the United States. Countries with greater representation of women had higher gender equality and percent female medical school enrollment, suggesting these factors may play a role in the gender gap.
Introduction
In recent decades, representation of women in medicine has increased dramatically, as evidenced by the fact that 48% of all American medical school graduates were female in 2014 . Women constitute 46% of all resident physicians, and they have achieved parity or are the gender majority in pediatrics, obstetrics and gynecology, pathology, family medicine, and psychiatry .
Despite such progress, gender gaps remain. Only 38% of faculty positions, 21% of full professorships, and 16% of deanships at American medical schools are held by women . Female physicians have lower mean unadjusted salaries than male physicians . Furthermore, female gender distribution among specialties is uneven, ranging from 60.4% in pediatrics to 4.6% in orthopedic surgery . Although female medical school graduates are increasingly entering specialties in which they were historically underrepresented, large gender disparities remain, most notably in the surgical subspecialties and diagnostic radiology. According to a 2016 report by the Association of American Medical Colleges, only 24.7% of active radiologists in the United States are female . This is in keeping with survey data from the American College of Radiology, finding that only 22% of the US radiology physician workforce was female in 2014 . Compared to all specialties, radiology has one of the lowest proportions of full-time female faculty at 28%, better only than orthopedic surgery (16%) and general surgery (22%) . Of note, in the case of general surgery, the percentage of female residents is substantially higher at 38% . A 2016 review of 51 major academic radiology faculty rosters in the United States reported that only 25% of vice chairs and section chiefs and 9% of department chairs were women .
Get Radiology Tree app to read full this article<
Materials and Methods
Get Radiology Tree app to read full this article<
Get Radiology Tree app to read full this article<
Get Radiology Tree app to read full this article<
Get Radiology Tree app to read full this article<
Get Radiology Tree app to read full this article<
Get Radiology Tree app to read full this article<
Results
Get Radiology Tree app to read full this article<

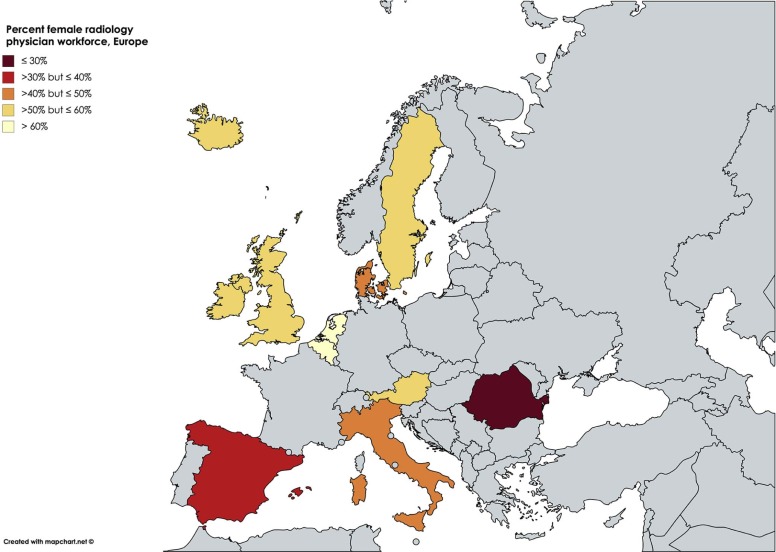
TABLE 1
Region and Country-specific Data on Percent Female Representation in the Radiology Physician Workforce
Region Country Organization \* All Members Female Members (%) Africa South Africa HPCSA 945 273 (28.9%) Asia Japan JCR 5,589 1546 (27.7%) Korea KSR 3,917 1570 (40.1%) Thailand RCRT 1,924 N/A (80%–90%) Europe Austria OERG 1,315 404 (30.7%) Belgium BSR 2,212 637 (28.8%) Denmark DRS 708 354 (50.0%) England NHS 4,223 1589 (37.6%) Europe ESR 63,603 23,393 (36.8%) Iceland RSI 40 13 (32.5%) Ireland RCSI 527 186 (35.3%) Italy SIRM 9,600 4000 (41.7%) Netherlands NVvR 1,070 320 (29.9%) Romania SRIM 515 355 (68.9%) Scotland NHS 463 181 (39.1%) Spain SERAM 5,446 2742 (50.4%) Sweden SFRB 1,495 542 (36.3%) North America Canada Multiple † 3,261 984 (30.2%) US RSNA 54,314 14,745 (27.2%) US AOCR N/A ‡ N/A (20%) Oceania Australia RANZCR 2,388 657 (27.5%) New Zealand RANZCR 499 172 (34.5%) Central/South America Argentina FAARDIT 1,397 615 (44.0%) Brazil CBR 13,201 4945 (37.5%) Brazil SPR 5,416 1963 (36.2%) Chile SOCHRADI 536 193 (36.0%) Costa Rica ACRIM 210 89 (42.4%) El Salvador ASRUID 42 15 (35.7%) Trinidad and Tobago RSTT 32 11 (34.4%)
Get Radiology Tree app to read full this article<
Get Radiology Tree app to read full this article<
Get Radiology Tree app to read full this article<
Get Radiology Tree app to read full this article<
Get Radiology Tree app to read full this article<
TABLE 2
Country-specific Data on Percent Female Representation in the Radiology Physician Workforce Among Members Aged 35 or Under
Region Country Organization \* All Members Aged 35 or Under Female Members Aged 35 or Under (%) Asia Japan JCR 1226 506 (41.3%) Europe Belgium BSR 382 170 (44.5%) Denmark DRS 81 46 (56.8%) England NHS 1103 463 (42.0%) Italy SIRM 2175 1,247 (57.3%) Netherlands NVvR 140 57 (40.7%) Scotland NHS 119 52 (43.7%) Spain SERAM 643 390 (60.7%) Sweden SFRB 231 100 (43.3%) North America US AOCR N/A † N/A † (25%) Oceania Australia and New Zealand RANZCR 597 223 (37.4%) Central/South America Brazil CBR 5282 2,360 (44.7%) Chile SOCHRADI 155 54 (34.8%) Costa Rica ACRIM 43 23 (53.5%) El Salvador ASRUID 2 2 (100%) Trinidad and Tobago RSTT 6 3 (50.0%)
Get Radiology Tree app to read full this article<
Get Radiology Tree app to read full this article<
Get Radiology Tree app to read full this article<
Get Radiology Tree app to read full this article<
TABLE 3
Country-specific Data on Percent Female Representation Among Organization Leadership
Region Country Organization \* All Board Members Female Board Members (%) Asia Japan JCR 27 3 (11.1%) Europe Denmark DRS 5 3 (60.0%) Ireland RCSI 11 2 (18.2%) Italy SIRM 26 4 (15.4%) Netherlands NVvR 7 3 (42.9%) Romania SRIM 38 14 (36.8%) Sweden SFRB 15 6 (40.0%) NorthAmerica US RSNA 8 3 (37.5%) US AOCR 13 3 (23.1%) Oceania Australia & New Zealand RANZCR 8 1 (12.5%) Central/South America Argentina FAARDIT 21 2 (9.5%) Brazil CBR 16 2 (12.5%) Chile SOCHRADI 12 2 (16.7%) Costa Rica ACRIM 7 1 (14.3%) El Salvador ASRUID 7 5 (71.4%) Trinidad and Tobago RSTT 5 2 (40.0%)
Get Radiology Tree app to read full this article<
Get Radiology Tree app to read full this article<
Get Radiology Tree app to read full this article<
TABLE 4
Linear Regression Results for Country-specific Factors Associated with Increased Female Representation in the Radiology Physician Workforce
Country-specific Factors Coefficient Std. Error_t_ \* P > | t † Gender development index 5.65 1.51 3.74 .006 Female medical school enrollment (%) 1.42 0.25 5.60 .001 Gross domestic product, in millions of dollars (2015) −1.12e−08 4.13e−09 −2.72 .03 Gini index 0.012 0.002 4.35 .002
R 2 = 0.91; R 2 is a statistical measure of how close the data are to the fitted regression line (explained variation/total variation).
Get Radiology Tree app to read full this article<
Get Radiology Tree app to read full this article<
Get Radiology Tree app to read full this article<
Get Radiology Tree app to read full this article<
Get Radiology Tree app to read full this article<
Discussion
Get Radiology Tree app to read full this article<
Get Radiology Tree app to read full this article<
Get Radiology Tree app to read full this article<
Get Radiology Tree app to read full this article<
Get Radiology Tree app to read full this article<
Get Radiology Tree app to read full this article<
Limitations
Get Radiology Tree app to read full this article<
Get Radiology Tree app to read full this article<
Get Radiology Tree app to read full this article<
Conclusions
Get Radiology Tree app to read full this article<
Acknowledgments
Get Radiology Tree app to read full this article<
Appendix
Subjective comments provided by countries on the issue of gender disparity in radiology
Get Radiology Tree app to read full this article<
Get Radiology Tree app to read full this article<
Get Radiology Tree app to read full this article<
Get Radiology Tree app to read full this article<
Get Radiology Tree app to read full this article<
Get Radiology Tree app to read full this article<
Get Radiology Tree app to read full this article<
Get Radiology Tree app to read full this article<
The situation is [worrisome] because the number of women is increasing, but positions of responsibility are still occupied by men. Men do not feel the need to provide nurseries to facilitate women’s family [relationships]. Although women are slowly occupying top positions in radiology, the proportion is still far from what it should be. The number of women in interventional radiology is also much smaller [than men]. We should not be naive and think that the solution will be solved just because the total number of women is high.
Get Radiology Tree app to read full this article<
Get Radiology Tree app to read full this article<
Get Radiology Tree app to read full this article<
Get Radiology Tree app to read full this article<
Get Radiology Tree app to read full this article<
References
1. Lautenberger D.M., Dandar V.M., Raezer C.L., et. al.: The state of women in academic medicine: the pipeline and pathways to leadership, 2013–2014.2014.Association of American Medical CollegesWashington, DC
2. Clese E.2014 Physician specialty data book, center for workforce studies.2014.Association of American Medical CollegesWashington, DC:
3. Mei L.Charting outcomes in the match. Characteristics of applicants who matched to their preferred specialty in the 2014 main residency match.2014.National Resident Matching ProgramWashington, DC:
4. Jena A.B., Olenski A.R., Blumenthal D.M.: Sex differences in physician salary in US public medical schools. JAMA Intern Med 2016; 176: pp. 1294-1304.
5. Association of American Medical Colleges : Center for workforce studies. 2016 Physician specialty data report. Updated; Available at https://www.aamc.org/data/workforce/reports/457712/2016-specialty-databook.html
6. Bluth E.I., Cox J., Bansal S., et. al.: The 2015 ACR commission on human resources workforce survey. J Am Coll Radiol 2015; 12: pp. 1137-1141.
7. Grimm L.J., Ngo J., Pisano E.D., et. al.: Men (and women) in academic radiology: how can we reduce the gender discrepancy?. AJR Am J Roentgenol 2016; 206: pp. 678-680.
8. Grimm L.J., Ngo J., Pisano E.D.: Reply to “Reducing gender discrepancies in academic radiology”. AJR Am J Roentgenol 2016; 207: pp. W105.
9. Zener R., Lee S.Y., Visscher K.L., et. al.: Women in radiology: exploring the gender disparity. J Am Coll Radiol 2016; 13: pp. 344-350. e1
10. Grimm L.J., Lowell D., Cater S.W., et. al.: Differential motivations for pursuing diagnostic radiology by gender: implications for residency recruitment. Acad Radiol 2017; 24: pp. 1312-1317.
11. Jagsi R., Griffith K.A., DeCastro R.A., et. al.: Sex, role models, and specialty choices among graduates of US medical schools in 2006–2008. J Am Coll Surg 2014; 218: pp. 345-352.
12. Deitch C.H., Sunshine J.H., Chan W.C., et. al.: Women in the radiology profession: data from a 1995 national survey. AJR Am J Roentgenol 1998; 170: pp. 263-270.
13. Radiological Society of North America Web site : Radiology organizations—RSNA. Updated; Available at https://www.rsna.org/Content.aspx?id=2694
14. International Society of Radiology Web site : Cooperating societies. Available at http://www.isradiology.org/2017/isr/about_03.php
15. Perez Y.V., Kesselman A., Abbey-Mensah G., et. al.: A glance at gender-specific preferences influencing interventional radiology selection. J Vasc Interv Radiol 2016; 27: pp. 142-143. e1
16. Chapman C.H., Hwang W.T., Both S., et. al.: Current status of diversity by race, Hispanic ethnicity, and sex in diagnostic radiology. Radiology 2014; 270: pp. 232-240.
17. The World Bank Web site : GDP (current US$). Updated; Available at http://data.worldbank.org/indicator/NY.GDP.MKTP.CD
18. The Central Intelligence Agency World Factbook Web site : Country comparison: distribution of family income—Gini index. Updated; Available at https://www.cia.gov/library/publications/the-world-factbook/rankorder/2172rank.html
19. United Nations Development Programme Human Development Reports Web site : Table 4: Gender development index (GDI). Updated; Available at http://hdr.undp.org/en/composite/GDI
20. Campbell J.C., Yoon S.C., Cater S.W., et. al.: Factors influencing the gender breakdown of academic radiology residency programs. J Am Coll Radiol 2017; 14: pp. 958-962. S1546-1440(17)30228-4 [pii]
21. Rhodes F.Women and the 1%: how extreme economic inequality and gender inequality must be tackled together.2016.Oxfam InternationalOxford, UK: Oxfam Briefing Paper
22. Gonzales C.Jain-Chandra S.Kochhar K. et. al.Catalyst for change: empowering women and tackling income inequality.2015.International Monetary FundWashington, DC:
23. Potterton V.K., Ruan S., Sunshine J.H., et. al.: Why don’t female medical students choose diagnostic radiology? A review of the current literature. J Am Coll Radiol 2004; 1: pp. 583-590. S1546-1440(04)00082-1 [pii]
24. Owen J.B., Chan W.C., Sunshine J.H., et. al.: The sex ratio of American radiologists: comparison and implications by age, subspecialty, and type of practice. AJR Am J Roentgenol 1995; 165: pp. 1337-1341.
25. Schroeder J.E., Zisk-Rony R.Y., Liebergall M., et. al.: Medical students’ and interns’ interest in orthopedic surgery: the gender factor. J Surg Educ 2014; 71: pp. 198-204.
26. Baker S.R., Barry M., Chaudhry H., et. al.: Women as radiologists: are there barriers to entry and advancement?. J Am Coll Radiol 2006; 3: pp. 131-134. S1546-1440(05)00306-6 [pii]
27. Jena A.B., Khullar D., Ho O., et. al.: Sex differences in academic rank in US medical schools in 2014. JAMA 2015; 314: pp. 1149-1158.