
Rationale and Objectives
Breast density is a significant breast cancer risk factor measured from mammograms. Evidence suggests that the spatial variation in mammograms may also be associated with risk. We investigated the variation in calibrated mammograms as a breast cancer risk factor and explored its relationship with other measures of breast density using full field digital mammography (FFDM).
Materials and Methods
A matched case-control analysis was used to assess a spatial variation breast density measure in calibrated FFDM images, normalized for the image acquisition technique variation. Three measures of breast density were compared between cases and controls: (a) the calibrated average measure, (b) the calibrated variation measure, and (c) the standard percentage of breast density (PD) measure derived from operator-assisted labeling. Linear correlation and statistical relationships between these three breast density measures were also investigated.
Results
Risk estimates associated with the lowest to highest quartiles for the calibrated variation measure were greater in magnitude (odds ratios: 1.0 [ref.], 3.5, 6.3, and 11.3) than the corresponding risk estimates for quartiles of the standard PD measure (odds ratios: 1.0 [ref.], 2.3, 5.6, and 6.5) and the calibrated average measure (odds ratios: 1.0 [ref.], 2.4, 2.3, and 4.4). The three breast density measures were highly correlated, showed an inverse relationship with breast area, and related by a mixed distribution relationship.
Conclusion
The three measures of breast density capture different attributes of the same data field. These preliminary findings indicate the variation measure is a viable automated method for assessing breast density. Insights gained by this work may be used to develop a standard for measuring breast density.
Breast density measured from mammograms is a significant breast cancer risk factor . The association between breast density and breast cancer has been explored for many years, spawned by the pioneering work of Wolfe . The earlier work in breast density used an observational four category rating of mammograms based on patterns of increasing risk developed by Wolfe. These earlier pattern measures of risk were virtually supplanted by the percentage of breast density (PD) measure developed by these researchers . More recently, the pattern analysis has gained attention using a different approach in comparison with the earlier observational methods. Rather than investigating the raw data directly, mammographic patterns (or projected breast structure) have been investigated with various texture-related measures. For the most part, these are summary measures that include fractal analysis, features generated from applying various filtering methods, and co-occurrence features, as both investigated and reviewed by these researchers . Some of these measures show associations with breast cancer similar to that of the standard PD measure.
There are various methods used to assess breast density as previously reviewed . The operator-assisted PD measure has demonstrated repeatedly to correlate well with breast cancer without considering the x-ray imaging acquisition influences . Another approach involves calibrating for the inter-image acquisition technique variation to produce normalized data representations. There is little published work showing the efficacy of calibrating mammograms for breast cancer risk assessments using breast cancer status as the end point comparison. Some work indicates that calibration measures do not produce stronger breast cancer associations than that of the standard operator-assisted PD measure . Other work indicates calibration may be useful for describing the information captured by the PD measure and for automating its measurement . If calibration can be optimized to improve the precision with which breast density is measured, a more accurate estimate of the magnitude of association between breast density and breast cancer may be obtained. It may be too early to assess whether these methods are viable because calibration represents a newer approach in breast density analysis that has not been studied in great depth.
Get Radiology Tree app to read full this article<
Materials and methods
Get Radiology Tree app to read full this article<
Study Population
Get Radiology Tree app to read full this article<
Get Radiology Tree app to read full this article<
Get Radiology Tree app to read full this article<
Imaging System
Get Radiology Tree app to read full this article<
Calibrated Breast Density Measures
Get Radiology Tree app to read full this article<
Get Radiology Tree app to read full this article<
Operator-assisted Breast Density Measurements
Get Radiology Tree app to read full this article<
Statistical Analysis
Get Radiology Tree app to read full this article<
Get Radiology Tree app to read full this article<
Breast Density Statistical Model
Get Radiology Tree app to read full this article<
A(x,y)=k(1.0−exp[−pg(x,y)ts]), A
(
x
,
y
)
=
k
(
1.0
−
exp
[
−
pg
(
x
,
y
)
t
s
]
),
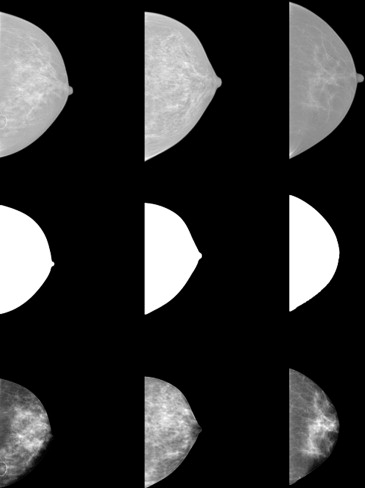
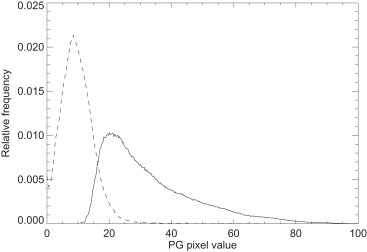
where t s is the system compressed breast thickness readout quantity expressed in cm for each image, and k =5000 is an arbitrary constant. Using A c = 3200 as a static threshold, pixel values within the eroded breast region meeting this condition A(x,y) ≥ A c were counted as glandular pixels (the d n count), whereas pixel values meeting this condition A(x,y) < A c were counted as adipose pixels (the a n count). For a given image, the PD-type measure is given by PD c = dnN d
n
N ×100% with N= d n + a n . We have shown previously that the PD c measure association with breast cancer is similar to that of the PD measure when analyzing the same dataset. For this work, we generated the PD c labeled images as an intermediate step to construct the component distributions. These binary labeled PD c images were then used as overlays for their respective PG representation images. For a given pair of PD c and PG images, regions (pixel values) in the PG image corresponding to the regions in the PD c image labeled as d n were assembled into an array. This process was carried out for every PG and PD c image pair in the extended dataset resulting in one array containing all PG pixel values corresponding to the d n labeling. The same process was carried out for the a n labeled regions resulting in another array. Normalizing each histogram of these arrays separately to unity gives an approximation for the respective ensemble probability distribution for each tissue type. These two component distributions were used to formulate a mixed distribution relationship for each mammogram. For a two-component mixture, the mixed distribution for a given image can be expressed as
p(z)=c×p1(z)+(1−c)×p2(z), p
(
z
)
=
c
×
p
1
(
z
)
+
(
1
−
c
)
×
p
2
(
z
)
,
where p i represents the component distributions (derived from the two arrays referenced above) with i =1 for the glandular component and i = 2 for the adipose component, c is the two-component mixing proportion, and z = PG (calibrated pixel values). For a given image, the mean can be expressed as
m=c×m1+(1−c)×m2, m
=
c
×
m
1
+
(
1
−
c
)
×
m
2
,
where m 1 and m 2 are the respective means determined from the component distributions. Likewise, the variance for a given image can be expressed as
σ2=c×(σ21+m21)+(1−c)×(σ22+m22)−m2, σ
2
=
c
×
(
σ
1
2
+
m
1
2
)
+
(
1
−
c
)
×
(
σ
2
2
+
m
2
2
)
−
m
2
,
where σ i represents the respective standard deviations calculated from the component distributions, and m was defined in Equation 3 . Equations 3 and 4 redefine the PG and PG sd breast density measures respectively and show the theoretical connection between the three breast density measures. The relationship with PD follows from Equation 3 . For a given image, c × 100% is an approximation of the PD measure. The mixing proportion, c, theoretically accounts for the fraction of pixels within the breast area that would be labeled as dense breast tissue by the standard PD measure. We calculated (m 1 , m 2 , σ 1 , σ 2 ) from the respective component distributions. These quantities were then used with Equations 3 and 4 to estimate the mixing coefficient breast density measure, c, for each image using the respective PG and PG sd measures as substitutes for m and σ. A brief analysis of the PD c and the mixing coefficient measures of breast density was provided to demonstrate the validity of (a) the methods used to generate the component distributions, and (b) the Equation 4 approximation.
Get Radiology Tree app to read full this article<
Results
Breast Density Measurement Comparisons
Get Radiology Tree app to read full this article<
Table 1
Patient Characteristics
Characteristic Case, n Case
Mean/SD or % Control, n Control
Mean/SD or % Age 123 59.4/9.7 123 59.2/9.6 HRT Never-used 62 50.4% 68 55.3% 1–5 years 24 (4) 19.5% 21 (4) 17.1% 6–10 years 15 (5) 12.2% 15 (5) 12.1% 11–15 years 9 (5) 7.3% 7 (4) 5.7% >15 years 13 (7) 10.6% 12 (8) 9.8% BMI (kg/m 2 ) 123 27.1/5.1 123 25.7/4.7 Breast area (pixel) 123 1,571,672/683,930 123 1,314,969/447,872
The number ( n ) of patients and percentages are provided for the breast cancer cases and controls stratified by hormone replacement therapy (HRT) usage and duration by years of usage. The parenthetical entries cite current HRT users as defined in the text. The mean body mass index (BMI), age, and breast area are given for each group. The associated standard deviations (SDs) for the BMI, age, and breast area distributions are also provided.
Table 2
Breast Density Measurements in Association with Breast Cancer
Breast Density Measure Cancer Side
OR (95% CI) Case Az ∗ Noncancer Side
OR (95% CI) Case Az PD BMI adjusted 0.623 0.647 1 1.00 (ref.) 23 1.00 (ref.) 17 2 2.16 (0.91‒5.15) 35 2.74 (1.18‒6.37) 35 3 3.25 (1.41‒7.53) 30 3.12 (1.20‒8.08) 33 4 2.85 (1.18‒6.91) 35 4.88 (1.66‒14.36) 36 BMI, area adjusted 0.693 0.676 1 1.00 (ref.) 23 1.00 (ref.) 17 2 2.33 (0.93‒5.84) 35 2.39 (0.99‒5.73) 35 3 5.55 (2.12‒14.49) 30 3.65 (1.35‒9.87) 33 4 6.52 (2.19‒19.39) 35 6.48 (2.09‒20.09) 36PG sd BMI adjusted 0.616 0.651 1 1.00 (ref.) 18 1.00 (ref.) 19 2 1.97 (0.93‒4.25) 33 3.41 (1.41‒8.24) 38 3 1.73 (0.76‒3.94) 29 2.56 (1.02‒6.43) 29 4 3.03 (1.30‒7.06) 43 4.78 (1.68‒13.59) 35 BMI, area adjusted 0.696 0.691 1 1.00 (ref.) 18 1.00 (ref.) 19 2 3.48 (1.40‒8.66) 33 4.75 (1.84‒12.26) 38 3 6.25 (2.04‒19.16) 29 4.32 (1.56‒11.97) 29 4 11.25 (3.54‒35.69) 43 8.25 (2.62‒25.92) 35PG BMI adjusted 0.589 1 1.00 (ref.) 23 2 1.99 (0.89‒4.44) 35 3 1.60 (0.71‒3.64) 31 4 2.22 (0.93‒5.29) 34 BMI, area adjusted 0.661 1 1.00 (ref.) 23 2 2.35 (0.99‒5.59) 35 3 2.30 (0.94‒5.61) 31 4 4.42 (1.62‒12.08) 34
This shows the association with breast cancer for the percentage of breast density (PD), the calibrated standard deviation (PG sd ), and the calibrated average (PG) measures of breast density. The odds ratios (OR), OR confidence intervals (CI), and area under the receiver operator characteristic curve (Az) values are shown. The findings for the cancer-sided (left column) and noncancer sided (right column) are shown separately.
Get Radiology Tree app to read full this article<
Get Radiology Tree app to read full this article<
Get Radiology Tree app to read full this article<
Get Radiology Tree app to read full this article<
Correlation Comparisons
Get Radiology Tree app to read full this article<
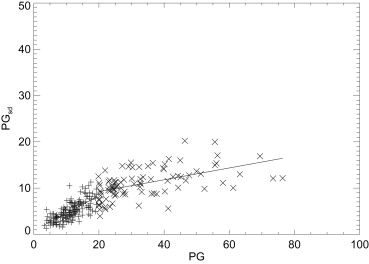
Table 3
Regression Parameters for Cases and Controls
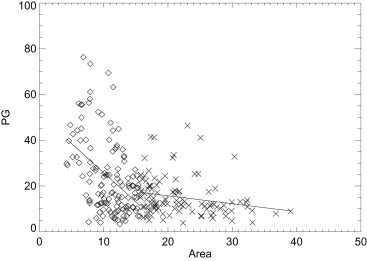
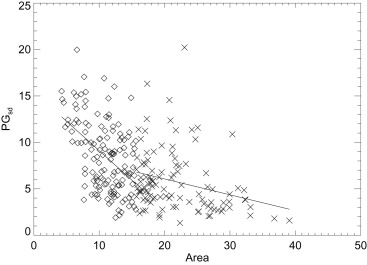
Below the Mean Above the Mean Comb. x-y M b R m b R R PG - PG sd Case 0.37 ± 0.03 0.81 0.71 0.13 ± 0.02 6.68 0.53 0.81 Control 0.37 ± 0.03 0.72 0.69 0.11 ± 0.02 6.37 0.48 0.77 Area - PG sd Case −0.63 ± 0.10 15.4 −0.48 −0.17 ± 0.06 9.48 −0.27 −0.48 Control −0.78 ± 0.12 15.7 −0.49 −0.29 ± 0.08 9.83 −0.34 −0.56 Area - PG Case −2.55 ± 0.43 51.3 −0.46 −0.35 ± 0.15 22.6 −0.22 −0.41 Control −2.26 ± 0.54 44.8 −0.35 −0.95 ± 0.28 29.8 −0.30 −0.43
This shows the two-part regression analysis summary fit to the form y = mx+b. The x-y pairs are shown in the first column. PG is the calibrated average measure, PG sd is the PG standard deviation measure, and area is the projected (not eroded) breast area. The distribution mean value of x was used as the breakpoint for each pair. The linear correlation coefficient (R) is shown for each line segment and the combination (comb.) correlation is cited in the last column, derived without the breakpoint. The PG distribution mean and standard deviation (mean, SD) for the cases and controls were: (19.8, 13.9) and (18.5, 13.7), respectively. Breast area was measured in 10 5 pixel units. The breast area summaries are provided Table 1 .
Get Radiology Tree app to read full this article<
Get Radiology Tree app to read full this article<
Get Radiology Tree app to read full this article<
Statistical Model Evaluation
Get Radiology Tree app to read full this article<
Get Radiology Tree app to read full this article<
Discussion
Get Radiology Tree app to read full this article<
Get Radiology Tree app to read full this article<
Get Radiology Tree app to read full this article<
Get Radiology Tree app to read full this article<
Get Radiology Tree app to read full this article<
Acknowledgments
Get Radiology Tree app to read full this article<
References
1. Boyd N.F., Rommens J.M., Vogt K., et. al.: Mammographic breast density as an intermediate phenotype for breast cancer. Lancet Oncol 2005; 6: pp. 798-808.
2. McCormack V.A., dos Santos Silva I.: Breast density and parenchymal patterns as markers of breast cancer risk: a meta-analysis. Cancer Epidemiol Biomarkers Prev 2006; 15: pp. 1159-1169.
3. Boyd N.F., Guo H., Martin L.J., et. al.: Mammographic density and the risk and detection of breast cancer. N Engl J Med 2007; 356: pp. 227-236.
4. Harvey J.A., Bovbjerg V.E.: Quantitative assessment of mammographic breast density: relationship with breast cancer risk. Radiology 2004; 230: pp. 29-41.
5. Wolfe J.N.: Risk for breast cancer development determined by mammographic parenchymal pattern. Cancer 1976; 37: pp. 2486-2492.
6. Wolfe J.N.: Breast patterns as an index of risk for developing breast cancer. AJR Am J Roentgenol 1976; 126: pp. 1130-1139.
7. Byng J.W., Boyd N.F., Fishell E., et. al.: The quantitative analysis of mammographic densities. Phys Med Biol. 1994; 39: pp. 1629-1638.
8. Boyd N.F., Byng J.W., Jong R.A., et. al.: Quantitative classification of mammographic densities and breast cancer risk: results from the Canadian National Breast Screening Study. J Natl Cancer Inst 1995; 87: pp. 670-675.
9. Manduca A., Carston M.J., Heine J.J., et. al.: Texture features from mammographic images and risk of breast cancer. Cancer Epidemiol Biomarkers Prev 2009; 18: pp. 837-845.
10. Yaffe M.J.: Mammographic density. Measurement of mammographic density. Breast Cancer Res 2008; 10: pp. 209.
11. Highnam R., Brady M.: Mammographic image analysis.1999.Kluwer Academic PublishersBoston, MA
12. Kaufhold J., Thomas J.A., Eberhard J.W., et. al.: A calibration approach to glandular tissue composition estimation in digital mammography. Med Phys 2002; 29: pp. 1867-1880.
13. Malkov S., Wang J., Kerlikowske K., et. al.: Single x-ray absorptiometry method for the quantitative mammographic measure of fibroglandular tissue volume. Med Phys 2009; 36: pp. 5525-5536.
14. Pawluczyk O., Augustine B.J., Yaffe M.J., et. al.: A volumetric method for estimation of breast density on digitized screen-film mammograms. Med Phys 2003; 30: pp. 352-364.
15. van Engeland S., Snoeren P.R., Huisman H., et. al.: Volumetric breast density estimation from full-field digital mammograms. IEEE Trans Med Imaging 2006; 25: pp. 273-282.
16. Boyd N., Martin L., Gunasekara A., et. al.: Mammographic density and breast cancer risk: evaluation of a novel method of measuring breast tissue volumes. Cancer Epidemiol Biomarkers Prev 2009; 18: pp. 1754-1762.
17. Ding J., Warren R., Warsi I., et. al.: Evaluating the effectiveness of using standard mammogram form to predict breast cancer risk: case-control study. Cancer Epidemiol Biomarkers Prev 2008; 17: pp. 1074-1081.
18. Heine JJ, Cao K, Rollison DE, et al. A quantitative description of the percentage of breast density measurement using full field digital mammography. Acad Radiol. In press.
19. Heine J.J., Behera M.: Effective x-ray attenuation measurements with full field digital mammography. Med Phys 2006; 33: pp. 4350-4366.
20. Heine J.J., Cao K., Beam C.: Cumulative sum quality control for calibrated breast density measurements. Med Phys 2009; 36: pp. 5380-5390.
21. Heine J.J., Cao K., Thomas J.A.: Effective radiation attenuation calibration representation in mammography: compression thickness influences and correction. BioMed Eng Online 2010; 9: pp. 73.
22. Heine J.J., Thomas J.A.: Effective x-ray attenuation coefficient measurements from two full field digital mammography systems for data calibration applications. Biomed Eng Online 2008; 7: pp. 13.
23. Vedantham S., Karellas A., Suryanarayanan S., et. al.: Full breast digital mammography with an amorphous silicon-based flat panel detector: physical characteristics of a clinical prototype. Med Phys 2000; 27: pp. 558-567.
24. Mahesh M.: AAPM/RSNA physics tutorial for residents: digital mammography: an overview. Radiographics 2004; 24: pp. 1747-1760.
25. Heine J.J., Deans S.R., Velthuizen R.P., et. al.: On the statistical nature of mammograms. Med Phys 1999; 26: pp. 2254-2265.
26. Heine J.J., Velthuizen R.P.: Spectral analysis of full field digital mammography data. Med Phys 2002; 29: pp. 647-661.
27. Vachon C.M., Brandt K.R., Ghosh K., et. al.: Mammographic breast density as a general marker of breast cancer risk. Cancer Epidemiol Biomarkers Prev 2007; 16: pp. 43-49.
28. Scutt D., Lancaster G.A., Manning J.T.: Breast asymmetry and predisposition to breast cancer. Breast Cancer Res 2006; 8: pp. R14.
29. Heine J.J., Malhotra P.: Mammographic tissue, breast cancer risk, serial image analysis, and digital mammography. Part 1. Tissue and related risk factors. Acad Radiol 2002; 9: pp. 298-316.