
Rationale and Objectives
Evaluation of contrast enhancement of pulmonary lesions with ground-glass attenuation (GGA) is difficult with conventional techniques but might be possible using contrast-mapping images (CMIs) obtained by dual-energy computed tomography. To address this issue, a phantom study was conducted, and this technique was then applied to clinical cases.
Materials and Methods
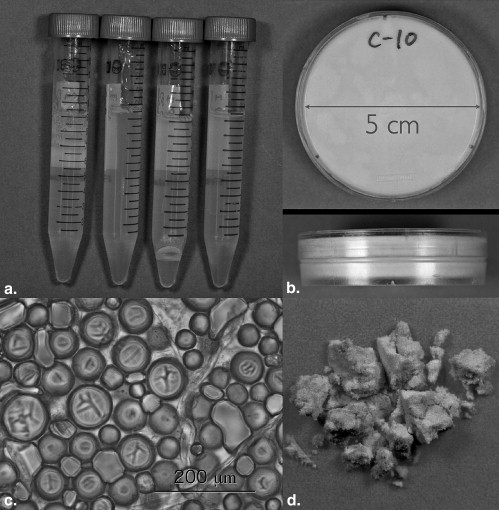
Phantoms made of agarose gel and those made of hollow resin clay, containing various concentrations of iodine or calcium, were used to simulate soft tissue and GGA, respectively. They were scanned using a dual-energy computed tomographic scanner, and the relationship between iodine concentration and calculated iodine value on CMIs was examined. The influence of calcium was also evaluated. In addition, contrast enhancement of 24 GGA lesions was evaluated on CMIs.
Results
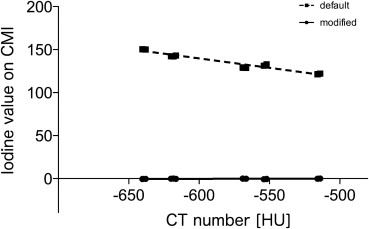
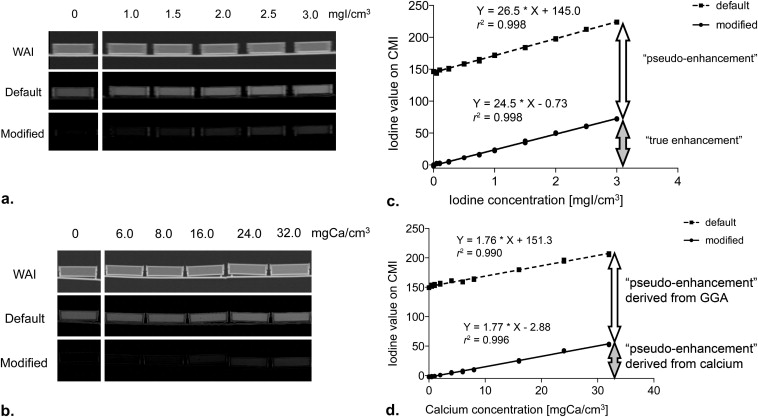
There was a good correlation between iodine value and iodine concentration in the soft-tissue models ( r 2 = 0.996). In the GGA models, the former tended to exceed the latter when default parameters for calculating CMIs were used, but this could be corrected by modifying the parameters ( r 2 = 0.998). The iodine value increased with calcium concentration in both models. On CMIs, contrast enhancement was visible in 22 adenocarcinomas but not in a pulmonary hemorrhage and an inflammatory change.
Conclusions
Dual-energy computed tomography can evaluate contrast enhancement of GGA lesions.
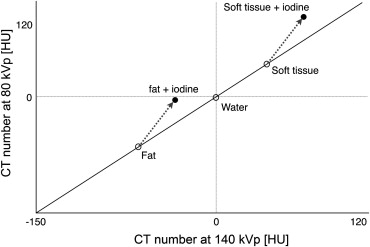
Dual-energy computed tomographic (DECT) imaging was first introduced in 2005 by Siemens Medical Solutions (Forchheim, Germany) with the brand name Somatom Definition. This scanner has two x-ray tubes providing 80-kVp and 140-kVp x-rays. Using two different x-ray energies (dual-energy technique), different materials can be distinguished according to their inherent x-ray attenuation coefficients . New imaging techniques, such as lung perfusion imaging , bone-removed computed tomographic (CT) angiography , qualitative diagnosis of urinary stones , and tendon imaging in musculoskeletal system , have been reported using DECT imaging.
Liver virtual noncontrast (VNC) is a new application of the Somatom Definition and is available on the workstation. Using this application, components of contrast material can be extracted from the data sets of postcontrast images obtained using the dual-energy technique, creating VNC and “iodine-mapping” images. Therefore, contrast enhancement can be evaluated without unenhanced images. Our previous study showed that contrast enhancement of the aorta, liver, and pectoris major muscle was correlated with the iodine value obtained with this technique .
Get Radiology Tree app to read full this article<
Get Radiology Tree app to read full this article<
Materials and methods
Get Radiology Tree app to read full this article<
Preparation of Phantoms
Get Radiology Tree app to read full this article<
Get Radiology Tree app to read full this article<
Get Radiology Tree app to read full this article<
Get Radiology Tree app to read full this article<
Patients
Get Radiology Tree app to read full this article<
CT Scanning
Get Radiology Tree app to read full this article<
Get Radiology Tree app to read full this article<
Material Decomposition on Contrast-mapping Images
Get Radiology Tree app to read full this article<
Get Radiology Tree app to read full this article<
Get Radiology Tree app to read full this article<
Image Evaluation
Get Radiology Tree app to read full this article<
Get Radiology Tree app to read full this article<
Statistical Analysis
Get Radiology Tree app to read full this article<
Results
Homogeneity of the GGA Models
Get Radiology Tree app to read full this article<
Evaluation of Soft Tissue Models
Get Radiology Tree app to read full this article<
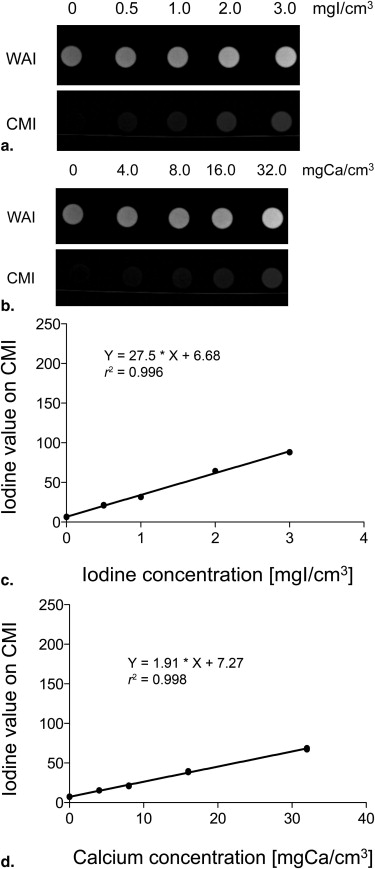
Get Radiology Tree app to read full this article<
Evaluation of GGA Models and Modification of Decomposition Parameters
Get Radiology Tree app to read full this article<
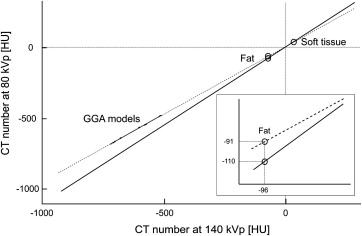
Table 1
Parameters for Material Decomposition (Excerpt)
Tube Voltage (kVp) Attenuation (Hounsfield Units) Default Modified Fat 80 −110 −91 140 −96 −96 Tissue 80 60 60 140 54 54 Minimum −300 −700 Maximum 3071 3071
Get Radiology Tree app to read full this article<
Get Radiology Tree app to read full this article<
Get Radiology Tree app to read full this article<
Get Radiology Tree app to read full this article<
Get Radiology Tree app to read full this article<
Evaluation of Clinical Cases
Get Radiology Tree app to read full this article<
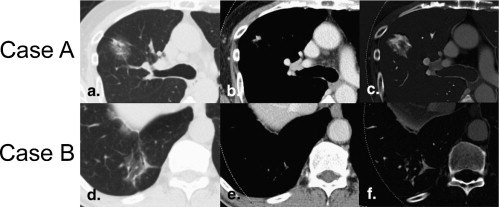
Table 2
Mean Visual Scores of Contrast Enhancement in Various Types of Ground-glass Attenuation Lesions
Pathological Diagnosis_n_ Score Reviewer 1 Reviewer 2 Reviewer 3 Total Adenocarcinoma ∗ 18 2.1 ± 0.7 1.9 ± 0.8 2.3 ± 0.8 2.1 ± 0.7 Bronchioloalveolar carcinoma ∗ 3 2.7 ± 0.6 2.0 ± 1.2 2.3 ± 1.2 2.3 ± 0.9 Atypical adenomatous hyperplasia 1 2 2 3 2.3 ± 0.6 Pulmonary hemorrhage ∗ 1 0 0 0 0 Inflammatory change ∗ 1 0 0 0 0
Data are expressed as mean ± standard deviation.
Get Radiology Tree app to read full this article<
Get Radiology Tree app to read full this article<
Discussion
Get Radiology Tree app to read full this article<
Get Radiology Tree app to read full this article<
Get Radiology Tree app to read full this article<
Get Radiology Tree app to read full this article<
Get Radiology Tree app to read full this article<
Conclusions
Get Radiology Tree app to read full this article<
Get Radiology Tree app to read full this article<
References
1. Johnson T.R., Krauss B., Sedlmair M., et. al.: Material differentiation by dual energy CT: initial experience. Eur Radiol 2007; 17: pp. 1510-1517.
2. Thieme S.F., Becker C.R., Hacker M., et. al.: Dual energy CT for the assessment of lung perfusion—correlation to scintigraphy. Eur J Radiol 2008; 68: pp. 369-374.
3. Thieme S.F., Johnson T.R., Lee C., et. al.: Dual-energy CT for the assessment of contrast material distribution in the pulmonary parenchyma. AJR Am J Roentgenol 2009; 193: pp. 144-149.
4. Ferda J., Ferdová E., Mírka H., et. al.: Pulmonary imaging using dual-energy CT, a role of the assessment of iodine and air distribution. Eur J Radiol 2011; 77: pp. 287-293.
5. Meyer B.C., Werncke T., Hopfenmüller W., et. al.: Dual energy CT of peripheral arteries: effect of automatic bone and plaque removal on image quality and grading of stenoses. Eur J Radiol 2008; 68: pp. 414-422.
6. Morhard D., Fink C., Graser A., et. al.: Cervical and cranial computed tomographic angiography with automated bone removal: dual energy computed tomography versus standard computed tomography. Invest Radiol 2009; 44: pp. 293-297.
7. Boll D.T., Patil N.A., Paulson E.K., et. al.: Renal stone assessment with dual-energy multidetector CT and advanced postprocessing techniques: improved characterization of renal stone composition—pilot study. Radiology 2009; 250: pp. 813-820.
8. Matlaga B.R., Kawamoto S., Fishman E.: Dual source computed tomography: a novel technique to determine stone composition. Urology 2008; 72: pp. 1164-1168.
9. Deng K., Sun C., Liu C., et. al.: Initial experience with visualizing hand and foot tendons by dual-energy computed tomography. Clin Imaging 2009; 33: pp. 384-389.
10. Kawai T, Hara M, Shibamoto Y, et al. The clinical potential of contrast-mapping images created using the dual-energy CT technique for diagnosing pulmonary lesions [abstract]. RSNA Sci Assem Annu Meeting Program 2008; 337.
11. Swensen S.J., Viggiano R.W., Midthun D.E., et. al.: Lung nodule enhancement at CT: multicenter study. Radiology 2008; 214: pp. 73-80.
12. Petkovska I., Shah S.K., McNitt-Gray M.F., et. al.: Pulmonary nodule characterization: a comparison of conventional with quantitative and visual semi-quantitative analyses using contrast enhancement maps. Eur J Radiol 2006; 59: pp. 244-252.
13. Chae E.J., Song J.W., Seo J.B., et. al.: Clinical utility of dual-energy CT in the evaluation of solitary pulmonary nodules: initial experience. Radiology 2008; 249: pp. 671-681.
14. Mirtcheva R.M., Vazquez M., Yankelevitz D.F., et. al.: Bronchioloalveolar carcinoma and adenocarcinoma with bronchioloalveolar features presenting as ground-glass opacities on CT. Clin Imaging 2002; 26: pp. 95-100.
15. Oda S., Awai K., Liu D., et. al.: Ground-glass opacities on thin-section helical CT: differentiation between bronchioloalveolar carcinoma and atypical adenomatous hyperplasia. AJR Am J Roentgenol 2008; 190: pp. 1363-1368.
16. Lee C.H., Goo J.M., Ye H.J., et. al.: Radiation dose modulation techniques in the multidetector CT era: from basics to practice. Radiographics 2008; 28: pp. 1451-1459.
17. Maass C., Baer M., Kachelriess M.: Image-based dual energy CT using optimized precorrection functions: a practical new approach of material decomposition in image domain. Med Phys 2009; 36: pp. 3818-3829.
18. Santamaria-Pang A, Dutta S, Makrogiannis S, et al. Automated liver lesion characterization using fast kVp switching dual energy computed tomography imaging. Available at: http://www.albertosantamaria.com/Alberto.Santamaria.SPIE.2010.pdf . Accessed October 4, 2010.
19. Swensen SJ, Yamashita K, McCollough CH, et al. Lung nodules: dual-kilovolt peak analysis with CT—multicenter study. Radiology 200; 214:81–85.
20. Guedj N., Couvelard A., Arcangeli G., et. al.: Angiogenesis and extracellular matrix remodelling in bronchioloalveolar carcinomas: distinctive patterns in mucinous and non-mucinous tumours. Histopathology 2004; 44: pp. 251-256.
21. Uehara T., Honda T., Sano K., et. al.: A three-dimensional analysis of blood vessels in bronchioloalveolar carcinoma. Lung 2004; 182: pp. 343-353.
22. Hara M., Oda K., Ogino H., et. al.: Focal fibrosis as a cause of localized ground glass attenuation (GGA)—CT and MR findings. Radiat Med 2002; 20: pp. 93-95.
23. Fujimoto K.: Usefulness of contrast-enhanced magnetic resonance imaging for evaluating solitary pulmonary nodules. Cancer Imaging 2008; 8: pp. 36-44.
24. Pontana F., Remy-Jardin M., Duhamel A., et. al.: Lung perfusion with dual-energy multi-detector row CT: can it help recognize ground glass opacities of vascular origin?. Acad Radiol 2010; 17: pp. 587-594.