
Rationale and Objectives
This study aimed to determine whether mammographic features assessed by radiologists and using computer algorithms are prognostic of occult invasive disease for patients showing ductal carcinoma in situ (DCIS) only in core biopsy.
Materials and Methods
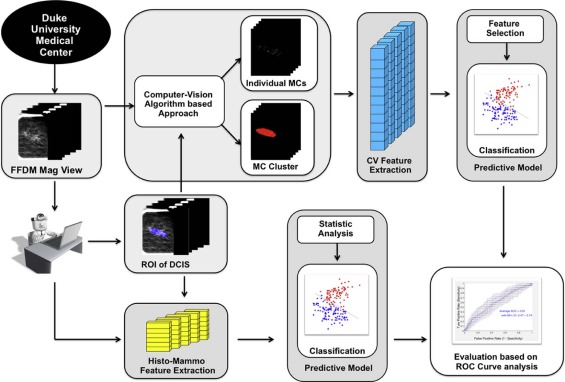
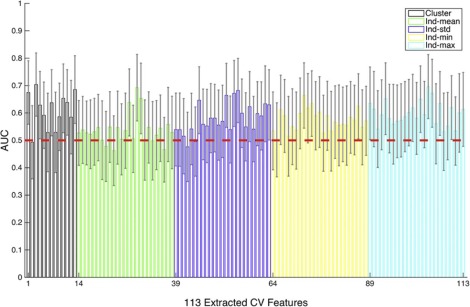
In this retrospective study, we analyzed data from 99 subjects with DCIS (74 pure DCIS, 25 DCIS with occult invasion). We developed a computer-vision algorithm capable of extracting 113 features from magnification views in mammograms and combining these features to predict whether a DCIS case will be upstaged to invasive cancer at the time of definitive surgery. In comparison, we also built predictive models based on physician-interpreted features, which included histologic features extracted from biopsy reports and Breast Imaging Reporting and Data System-related mammographic features assessed by two radiologists. The generalization performance was assessed using leave-one-out cross validation with the receiver operating characteristic curve analysis.
Results
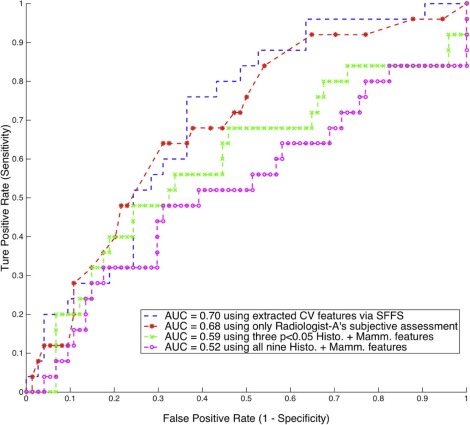
Using the computer-extracted mammographic features, the multivariate classifier was able to distinguish DCIS with occult invasion from pure DCIS, with an area under the curve for receiver operating characteristic equal to 0.70 (95% confidence interval: 0.59–0.81). The physician-interpreted features including histologic features and Breast Imaging Reporting and Data System-related mammographic features assessed by two radiologists showed mixed results, and only one radiologist’s subjective assessment was predictive, with an area under the curve for receiver operating characteristic equal to 0.68 (95% confidence interval: 0.57–0.81).
Conclusions
Predicting upstaging for DCIS based upon mammograms is challenging, and there exists significant interobserver variability among radiologists. However, the proposed computer-extracted mammographic features are promising for the prediction of occult invasion in DCIS.
Introduction
Ductal carcinoma in situ (DCIS) is a preinvasive tumor confined within the ducts of the mammary glands and lies along the breast cancer continuum between atypical ductal hyperplasia and invasive ductal carcinoma. The incidence of DCIS has increased substantially since the introduction of mammographic screening, with over 60,000 women in the United States diagnosed with DCIS every year, representing approximately 20% of all new breast neoplasm diagnoses . However, despite the increased incidence of DCIS, there has not been a concomitant decrease in invasive breast cancer . Since the risk of progression from DCIS to invasive cancer is unclear, with estimates ranging from 14% to 53% , there is a growing debate about overdiagnosis and consequent overtreatment of DCIS. Furthermore, among DCIS-only cases diagnosed at core biopsy, approximately 26% will be shown to contain invasive ductal carcinoma at surgical excision . This upstaging, specifically from DCIS diagnosed at core biopsy to invasive ductal carcinoma at excision, has important consequences for patient management.
Many studies have sought to predict the occult invasion in DCIS. Different factors or markers, including immunohistochemical biomarkers, histologic features, and mammographic or sonographic findings, have been described and associated with outcomes in DCIS . However, none of these factors have been accepted as a definitive predictor of this upstaging or are sufficiently reliable for clinical use. Overall, it still remains a difficult task and unmet need to accurately predict occult invasive disease in DCIS.
Get Radiology Tree app to read full this article<
Materials and Methods
Get Radiology Tree app to read full this article<
Get Radiology Tree app to read full this article<
Subject Selection
Get Radiology Tree app to read full this article<
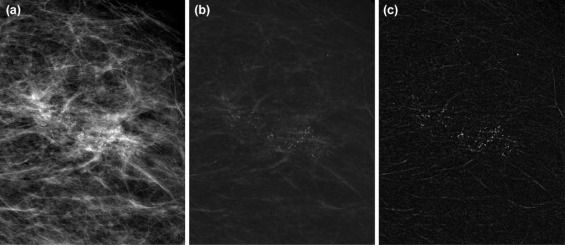
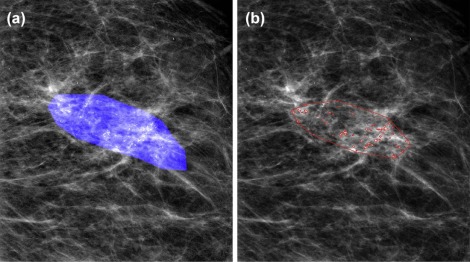
Detection of Individual MCs and Clusters
Get Radiology Tree app to read full this article<
Get Radiology Tree app to read full this article<
Get Radiology Tree app to read full this article<
Get Radiology Tree app to read full this article<
Get Radiology Tree app to read full this article<
Get Radiology Tree app to read full this article<
Get Radiology Tree app to read full this article<
Get Radiology Tree app to read full this article<
Get Radiology Tree app to read full this article<
Get Radiology Tree app to read full this article<
Feature Extraction
Computer-vision Features
Get Radiology Tree app to read full this article<
Table 1
Computer-vision features extracted from individual MCs and cluster
Category Feature Description Individual MCs Shape MC perimeter (p) Length of MC contour MC area (Amc) Number of pixels for an MC × pixel area (µm 2 ) MC circularity 4πAmc/ p 2 , a measure of “roundness” MC eccentricity Another measure of “roundness” MC major axis Length of the major axis of the MC region MC minor axis Length of the minor axis of the MC region MC Hu moments *7 Descriptive weighted averages of intensities Topology MC distance2centroid Distance to the cluster centroid MC distance2closest Distance to the nearest MC neighbor MC degree Number of edges incident to MC MC normalized degree Sum of normalized weights of the MC degree Texture MC background *2 Mean and SD of background pixel intensities MC foreground *2 Mean and SD of MC’s pixel intensities MC GLCM * 4 Measures computed from GLCMs Cluster Shape MCC area (Ac) Area of cluster MCC eccentricity Eccentricity of the cluster Topology MCC number (n) Number of MCs in the cluster MCC density 2 E / n ( n − 1): E is number of graph edges MCC coverage Sum(Amc/Ac) Texture Cluster background *2 Mean and SD of background pixel intensities in the cluster Cluster foreground *2 Mean and SD of MC’s pixel intensities in the cluster Cluster GLCM * 4 Measures computed from GLCMs for the whole cluster
GLCM, gray-level co-occurrence matrix; MC, microcalcification; MCC, microcalcification cluster; SD, standard deviation.
Get Radiology Tree app to read full this article<
Physician-interpreted Features
Get Radiology Tree app to read full this article<
Table 2
Comparison of histologic and mammographic features of the DCIS and invasive groups
Feature DCIS (74) Invasion (25)P Value Age 59.8 58.2P ≤ 0.5330 Histologic Nuclear grade (1–3) 2.51 2.58P ≤ 0.6044 1 6 3 2 27 6 3 41 16 Subtype of DCIS_P_ ≤ 0.5250 Comedo 36 14 Noncomedo 38 11 Mammographic Radiologist A Radiologist B Size of lesion Area (mm 2 ) 210.3 369.0P ≤ 0.2257 182.5 442.9P ≤ 0.0305 \* Major axis (mm) 16.7 24.8P ≤ 0.0496 \* 17.3 25.4P ≤ 0.0345 \* Morphology of calcifications_P_ ≤ 0.0704P ≤ 0.8690 Low risk (typically benign) 0 1 0 0 Medium risk (amorphous or coarse heterogeneous) 41 7 16 5 High risk (fine pleomorphic or fine linear) 33 17 58 20 Distribution of calcifications_P_ ≤ 0.6653P ≤ 0.2056 Regional 2 0 11 3 Segmental 5 3 3 4 Linear 2 1 15 7 Clustered 65 21 45 11 BI-RADS level of suspicion_P_ ≤ 0.0247 \* P ≤ 0.0321 \* 4a 40 7 1 1 4b 17 8 35 6 4c 14 8 23 7 5 3 2 15 11 Radiologist’s score of being invasive 14.5 21.0P ≤ 0.0052 \* 32.2 35.4P ≤ 0.4965
BI-RADS, Breast Imaging Reporting and Data System; DCIS, ductal carcinoma in situ .
Get Radiology Tree app to read full this article<
Get Radiology Tree app to read full this article<
Building and Evaluating Predictive Models
Get Radiology Tree app to read full this article<
Get Radiology Tree app to read full this article<
Get Radiology Tree app to read full this article<
Get Radiology Tree app to read full this article<
Results
Univariate Performance
Computer-vision Features
Get Radiology Tree app to read full this article<
Get Radiology Tree app to read full this article<
Physician-interpreted Features
Get Radiology Tree app to read full this article<
Multivariate Performance
Get Radiology Tree app to read full this article<
Get Radiology Tree app to read full this article<
Get Radiology Tree app to read full this article<
Get Radiology Tree app to read full this article<
Get Radiology Tree app to read full this article<
Discussion
Get Radiology Tree app to read full this article<
Get Radiology Tree app to read full this article<
Get Radiology Tree app to read full this article<
Get Radiology Tree app to read full this article<
Conclusions
Get Radiology Tree app to read full this article<
Get Radiology Tree app to read full this article<
References
1. Sue G.R., Lannin D.R., Killelea B., et. al.: Predictors of microinvasion and its prognostic role in ductal carcinoma in situ. Am J Surg 2013; 206: pp. 478-481.
2. American Cancer Society : Cancer facts & figures 2015.2015.American Atlanta
3. Ozanne E.M., Shieh Y., Barnes J., et. al.: Characterizing the impact of 25 years of DCIS treatment. Breast Cancer Res Treat 2011; 129: pp. 165-173.
4. Erbas B., Provenzano E., Armes J., et. al.: The natural history of ductal carcinoma in situ of the breast: a review. Breast Cancer Res Treat 2006; 97: pp. 135-144.
5. Brennan M.E., Turner R.M., Ciatto S., et. al.: Ductal carcinoma in situ at core-needle biopsy: meta-analysis of underestimation and predictors of invasive breast cancer. Radiology 2011; 260: pp. 119-128.
6. Dillon M.F., McDermott E.W., Quinn C.M., et. al.: Predictors of invasive disease in breast cancer when core biopsy demonstrates DCIS only. J Surg Oncol 2006; 93: pp. 559-563.
7. Kurniawan E.D., Rose A., Mou A., et. al.: Risk factors for invasive breast cancer when core needle biopsy shows ductal carcinoma in situ. Arch Surg 2010; 145: pp. 1098-1104.
8. Lee C.-W., Wu H.-K., Lai H.-W., et. al.: Preoperative clinicopathologic factors and breast magnetic resonance imaging features can predict ductal carcinoma in situ with invasive components. Eur J Radiol 2016; 85: pp. 780-789.
9. Park H.S., Kim H.Y., Park S., et. al.: A nomogram for predicting underestimation of invasiveness in ductal carcinoma in situ diagnosed by preoperative needle biopsy. Breast 2013; 22: pp. 869-873.
10. Park H.S., Park S., Cho J., et. al.: Risk predictors of underestimation and the need for sentinel node biopsy in patients diagnosed with ductal carcinoma in situ by preoperative needle biopsy. J Surg Oncol 2013; 107: pp. 388-392.
11. Renshaw A.A.: Predicting invasion in the excision specimen from breast core needle biopsy specimens with only ductal carcinoma in situ. Arch Pathol Lab Med 2002; 126: pp. 39-41.
12. Kopans D.B.: Breast imaging.2007.Lippincott Williams & Wilkins
13. Dershaw D., Abramson A., Kinne D.: Ductal carcinoma in situ: mammographic findings and clinical implications. Radiology 1989; 170: pp. 411-415.
14. Bria A., Karssemeijer N., Tortorella F.: Learning from unbalanced data: a cascade-based approach for detecting clustered microcalcifications. Med Image Anal 2014; 18: pp. 241-252.
15. El-Naqa I., Yang Y., Wernick M.N., et. al.: A support vector machine approach for detection of microcalcifications. IEEE Trans Med Imaging 2002; 21: pp. 1552-1563.
16. Gavrielides M.A., Lo J.Y., Floyd C.E.: Parameter optimization of a computer-aided diagnosis scheme for the segmentation of microcalcification clusters in mammograms. Med Phys 2002; 29: pp. 475-483.
17. Gavrielides M.A., Lo J.Y., Vargas-Voracek R., et. al.: Segmentation of suspicious clustered microcalcifications in mammograms. Med Phys 2000; 27: pp. 13-22.
18. Jing H., Yang Y., Nishikawa R.M.: Detection of clustered microcalcifications using spatial point process modeling. Phys Med Biol 2010; 56: pp. 1.
19. Wei L., Yang Y., Nishikawa R.M., et. al.: Relevance vector machine for automatic detection of clustered microcalcifications. IEEE Trans Med Imaging 2005; 24: pp. 1278-1285.
20. Zhang E., Wang F., Li Y., et. al.: Automatic detection of microcalcifications using mathematical morphology and a support vector machine. Biomed Mater Eng 2014; 24: pp. 53-59.
21. Pai V.R., Gregory N.E., Swinford A.E., et. al.: Ductal carcinoma in situ: computer-aided detection in screening mammography 1. Radiology 2006; 241: pp. 689-694.
22. Plant C., Ngo D., Retter F., et. al.: Computer-aided diagnosis of small lesions and non-masses in breast MRI.2012.
23. Srikantha A.: Symmetry-based detection and diagnosis of DCIS in breast MRI.Weickert J.Hein M.Schiele B.Pattern recognition: 35th German Conference, GCPR 2013, Saarbrücken, Germany, September 3–6, 2013. Proceedings.2013.Springer Berlin HeidelbergBerlin, Heidelberg:pp. 255-260.
24. Wang L., Harz M., Boehler T., et. al.: A robust and extendable framework towards fully automated diagnosis of nonmass lesions in breast DCE-MRI in 2014. IEEE 11th Int Symp Biomed Imaging 2014;
25. Bagnall M.J., Evans A.J., Wilson A.R.M., et. al.: Predicting invasion in mammographically detected microcalcification. Clin Radiol 2001; 56: pp. 828-832.
26. Dinkel H., Gassel A., Tschammler A.: Is the appearance of microcalcifications on mammography useful in predicting histological grade of malignancy in ductal cancer in situ?. Br J Radiol 2000; 73: pp. 938-944.
27. Lee C.H., Carter D., Philpotts L.E., et. al.: Ductal carcinoma in situ diagnosed with stereotactic core needle biopsy: can invasion be predicted? 1. Radiology 2000; 217: pp. 466-470.
28. O’Flynn E., Morel J., Gonzalez J., et. al.: Prediction of the presence of invasive disease from the measurement of extent of malignant microcalcification on mammography and ductal carcinoma in situ grade at core biopsy. Clin Radiol 2009; 64: pp. 178-183.
29. Sim Y., Litherland J., Lindsay E., et. al.: Upgrade of ductal carcinoma in situ on core biopsies to invasive disease at final surgery: a retrospective review across the Scottish Breast Screening Programme. Clin Radiol 2015; 70: pp. 502-506.
30. Baker J.A., Kornguth P.J., Lo J.Y., et. al.: Breast cancer: prediction with artificial neural network based on BI-RADS standardized lexicon. Radiology 1995; 196: pp. 817-822.
31. Pudil P., Ferri F., Novovicova J., et. al.: Floating search methods for feature selection with nonmonotonic criterion functions. In Proceedings of the Twelfth International Conference on Pattern Recognition, IAPR. Citeseer1994.
32. DeLong E.R., DeLong D.M., Clarke-Pearson D.L.: Comparing the areas under two or more correlated receiver operating characteristic curves: a nonparametric approach. Biometrics 1988; pp. 837-845.
33. Robin X., Turck N., Hainard A., et. al.: pROC: an open-source package for R and S+ to analyze and compare ROC curves. BMC Bioinformatics 2011; 12: pp. 1.
34. Mina L.M., Isa N.A.M.: A review of computer-aided detection and diagnosis of breast cancer in digital mammography. J Med Sci 2015; 15: pp. 110.
35. Giger M.L., Karssemeijer N., Schnabel J.A.: Breast image analysis for risk assessment, detection, diagnosis, and treatment of cancer. Annu Rev Biomed Eng 2013; 15: pp. 327-357.
36. Jalalian A., Mashohor S.B., Mahmud H.R., et. al.: Computer-aided detection/diagnosis of breast cancer in mammography and ultrasound: a review. Clin Imaging 2013; 37: pp. 420-426.
37. Dromain C., Boyer B., Ferre R., et. al.: Computer-aided diagnosis (CAD) in the detection of breast cancer. Eur J Radiol 2013; 82: pp. 417-423.
38. Petrick N., Sahiner B., Armato S.G., et. al.: Evaluation of computer-aided detection and diagnosis systems. Med Phys 2013; 40: pp. 087001.
39. Cowell C.F., Weigelt B., Sakr R.A., et. al.: Progression from ductal carcinoma in situ to invasive breast cancer: revisited. Mol Oncol 2013; 7: pp. 859-869.
40. Davis J., Goadrich M.: The relationship between Precision-Recall and ROC curves. In Proceedings of the 23rd International Conference on Machine Learning2006.ACM