
Rationale and Objectives
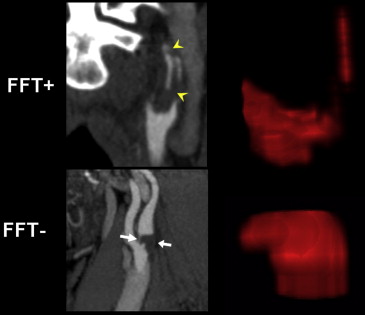
Patients presenting with transient ischemic attack or stroke may have symptom-related lesions on acute computed tomography angiography (CTA) such as free-floating intraluminal thrombus (FFT). It is difficult to distinguish FFT from carotid plaque, but the distinction is critical as management differs. By contouring the shape of these vascular lesions (“virtual endarterectomy”), advanced morphometric analysis can be performed. The objective of our study is to determine whether quantitative shape analysis can accurately differentiate FFT from atherosclerotic plaque.
Materials and Methods
We collected 23 consecutive cases of suspected carotid FFT seen on CTA (13 men, 65 ± 10 years; 10 women, 65.5 ± 8.8 years). True-positive FFT cases (FFT+) were defined as filling defects resolving with anticoagulant therapy versus false-positives (FFT−), which remained unchanged. Lesion volumes were extracted from CTA images and quantitative shape descriptors were computed. The five most discriminative features were used to construct receiver operator characteristic (ROC) curves and to generate three machine-learning classifiers. Average classification accuracy was determined by cross-validation.
Results
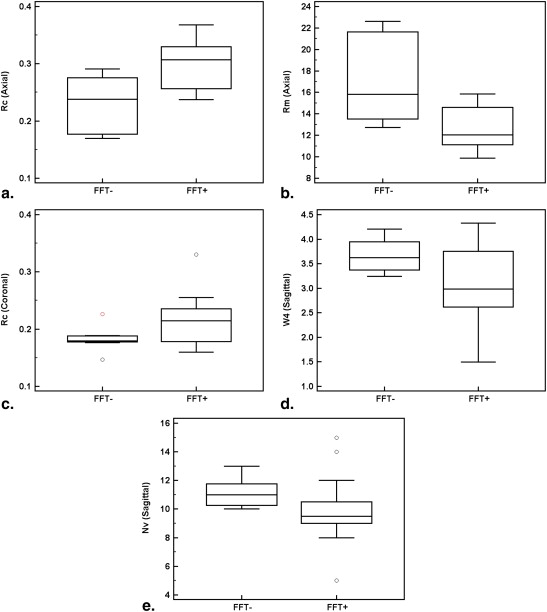
Follow-up imaging confirmed sixteen FFT+ and seven FFT− cases. Five shape descriptors delineated FFT+ from FFT− cases. The logistic regression model produced from combining all five shape features demonstrated a sensitivity of 87.5% and a specificity of 71.4% with an area under the ROC curve = 0.85 ± 0.09. Average accuracy for each classifier ranged from 65.2%–76.4%.
Conclusions
We identified five quantitative shape descriptors of carotid FFT. This shape “signature” shows potential for supplementing conventional lesion characterization in cases of suspected FFT.
Patients presenting with symptoms of a transient ischemic attack (TIA) or stroke with atherosclerotic plaque at the internal carotid artery (ICA) origin are at high risk for recurrent stroke . Current guidelines for imaging acute stroke and TIA have resulted in more frequent computed tomography angiography (CTA) and magnetic resonance angiography (MRA) . CTA imaging may demonstrate common or ICA plaque, but a fraction of patients imaged also had thrombus, also known as free-floating thrombus (FFT) , either alone or associated with underlying plaque. Most of the literature regarding FFT consists of case reports with a paucity of data from larger patient studies . Furthermore, conclusive data are lacking on how to best manage patients with FFT. Although some patients with complex plaque may benefit from acute endarterectomy, attempting surgery in some patients could potentially give rise to fragmentation and stroke. In patients with an inherited hypercoaguable state or evidence of dissection or superimposed thrombus, better outcomes may be achieved if initially treated with anticoagulation and antiplatelet agents . Clearly, accurate differentiation of FFT from atherosclerotic plaque is crucial for optimal management, and yet it can prove very challenging using visual assessment alone .
Given the limitations of subjective visual assessment, an alternative approach is to consider quantitative characterization of internal carotid lesion morphology. Such techniques have been successfully implemented in computer aided diagnosis algorithms for characterizing tumors. For example, the quantitative extent of margin spiculation and lobularity of breast tumors has been associated with the bioaggressiveness of the lesions . Shape analysis also reveals important insights into shoulder injuries by demonstrating that osseous impingement by the acromion is not a primary cause of shoulder impingement syndrome or rotator cuff tears . In neurologic diseases, shape analysis has been applied to characterize hippocampal morphology in patients with Alzheimer disease and seizure . However, its use in neurovascular diseases has been limited to carotid ultrasound . Although examination of carotid plaque morphology on cross-sectional imaging and angiography has been described , characterization of morphology in these articles was limited to reporting the presence or absence of ulceration based on an ordinal, pictorial scale. More advanced plaque analysis is possible using CTA and MRI as a refinement to risk stratification using only percent stenosis . Although FFT typically appears to be more elongated in the direction of flow compared to plaque, at least one series has reported cases where suspected FFT did not resolve with anticoagulation and were identified as plaque . The purpose of this study was to determine whether quantitative shape analysis of CTA could differentiate FFT from atherosclerotic plaque.
Materials and methods
Study Population
Get Radiology Tree app to read full this article<
Get Radiology Tree app to read full this article<
CT Angiography of the Neck and the Circle of Willis
Get Radiology Tree app to read full this article<
Image Analysis
Get Radiology Tree app to read full this article<
Shape Analysis
Get Radiology Tree app to read full this article<
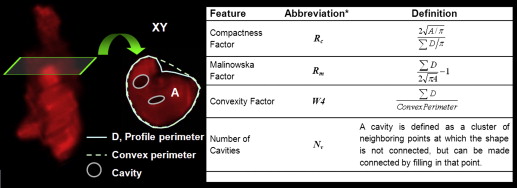
Get Radiology Tree app to read full this article<
Feature Selection, Statistical Analysis, and Pattern Classification
Get Radiology Tree app to read full this article<
Classification and Cross-validation
Get Radiology Tree app to read full this article<
Results
Get Radiology Tree app to read full this article<
Table 1
Patient Demographics
FFT Plaque_P_ Value_n_ 16 7 Sex male ( n ) 7 5 .16 Age (mean ± SD) 63.4 ± 14.3 64.5 ± 6.35 .86 Diabetes ( n ) 2 2 .29 Smoking ( n ) 9 3 1.00 Coagulopathy ( n ) 2 0 1.00 Platelets (med ± IQ range) 296 ± 85 217 ± 155 .09 Hemoglobin (mean ± SD) 133 ± 21.2 155 ± 12.4 .03
FFT, free-floating thrombus; SD, standard deviation.
Get Radiology Tree app to read full this article<
Get Radiology Tree app to read full this article<
Get Radiology Tree app to read full this article<
Get Radiology Tree app to read full this article<
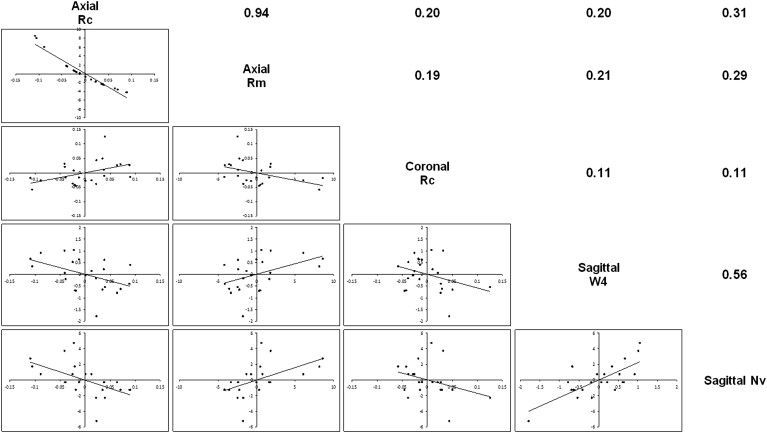
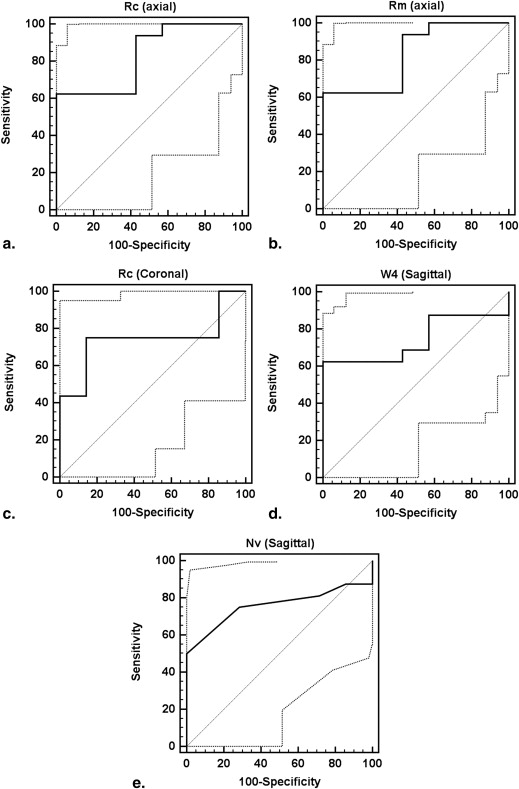
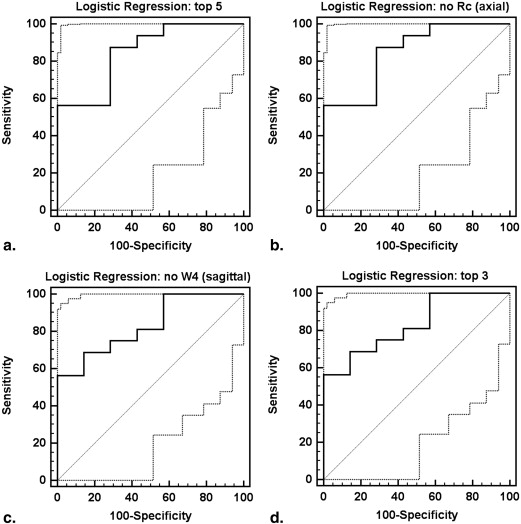
Table 2
Receiver Operating Characteristics
Feature (Plane) AUC SE (AUC)P Value Criterion Se (%) Sp (%) Individual features_Rc_ (axial): compactness 0.83 0.09 .0004 >0.29 62.5 100Rm (axial): inverse compactness 0.83 0.09 .0004 ≤12.33 62.5 100Rc (coronal): compactness 0.74 0.11 .0278 >0.19 75 85.7W4 (sagittal): convexity 0.74 0.11 .0217 ≤3.11 62.5 100Nv (sagittal): number of cavities 0.76 0.10 .0089 ≤9 50 100 Logistic regression All five features 0.85 0.09 .0001 >0.56 87.5 71.43 Top four features, no Rc (axial) 0.85 0.09 .0001 >0.58 87.5 71.43 Top four features, no W4 (sagittal) 0.83 0.09 .0002 >0.82 56.3 71.43 Top three features, no Rc (axial), no W4 (sagittal) 0.83 0.09 .0002 >0.82 56.3 100
AUC, area under ROC curve. SE (AUC), standard error of the AUC; Se (%), Sensitivity; Sp (%), Specificity.
Get Radiology Tree app to read full this article<
Get Radiology Tree app to read full this article<
Get Radiology Tree app to read full this article<
Get Radiology Tree app to read full this article<
Table 3
The Results of Each Cross-validation Procedure
Classification Cross-validation Accuracy (%) Se (%) Sp (%) Linear discriminant analysis (all features) Leave-one-out 65.2 68.8 57.1 Artificial neural network (all features) 10-fold 72.7 77.5 60 Support vector machine, four features (no Rc axial) Leave-one-out 69.6 87.5 28.6 Support vector machine, three features (no Rc axial or W4 sagittal) Leave-one-out 73.9 87.5 42.9 Support vector machine, three features (no Rc axial or W4 sagittal) 10-fold 76.4 96.3 23.3
Get Radiology Tree app to read full this article<
Discussion
Get Radiology Tree app to read full this article<
Get Radiology Tree app to read full this article<
Get Radiology Tree app to read full this article<
Get Radiology Tree app to read full this article<
Get Radiology Tree app to read full this article<
Get Radiology Tree app to read full this article<
Conclusion
Get Radiology Tree app to read full this article<
References
1. Eliasziw M., Kennedy J., Hill M.D., et. al., North American Symptomatic Carotid Endarterectomy Trial (NASCET) Group: Early risk of stroke after a transient ischemic attack in patients with internal carotid artery disease. CMAJ 2004; 170: pp. 1105-1109.
2. Coutts S.B., Modi J., Patel S.K., et. al., Calgary Stroke Program: CT/CT angiography and MRI findings predict recurrent stroke after transient ischemic attack and minor stroke: results of the prospective CATCH study. Stroke 2012; 43: pp. 1013-1017.
3. Latchaw R.E., Alberts M.J., Lev M.H., et. al.: Recommendations for imaging of acute ischemic stroke: a scientific statement from the American Heart Association. Stroke 2009; 40: pp. 3646-3678.
4. Menon B.K., Singh J., Al-Khataami A., et. al., Calgary CTA Study Group: The donut sign on CT angiography: an indicator of reversible intraluminal carotid thrombus?. Neuroradiology 2010; 52: pp. 1055-1056.
5. Jaberi A., Lum C., Stefanski P., et. al.: Computed tomography angiography evaluation of internal carotid artery free-floating thrombus–single-center diagnosis, false-positives, and follow-up. Emerg Radiol 2012; 19: pp. 359-362.
6. Biller J., Adams H.P., Boarini D., et. al.: Intraluminal clot of the carotid artery. A clinical-angiographic correlation of nine patients and literature review. Surg Neurol 1986; 25: pp. 467-477.
7. Arning C., Herrmann H.D.: Floating thrombus in the internal carotid artery disclosed by B-mode ultrasonography. J Neurol 1988; 235: pp. 425-427.
8. Bhatti A.F., Leon L.R., Labropoulos N., et. al.: Free-floating thrombus of the carotid artery: literature review and case reports. J Vasc Surg 2007; 45: pp. 199-205.
9. Ferrero E., Ferri M., Gaggiano A., et. al.: Free floating thrombus developed on a residual carotid intimal flap after carotid endarterectomy. Diagnosis and treatment. Ann Vasc Surg 2010; 24: pp. 573-574.
10. Ferrero E., Ferri M., Viazzo A., et. al.: Free-floating thrombus in the internal carotid artery: diagnosis and treatment of 16 cases in a single center. Ann Vasc Surg 2011; 25: pp. 805-812.
11. Caplan L.R.: Resolved: heparin may be useful in selected patients with brain ischemia. Stroke 2003; 34: pp. 230-231.
12. Hill S.L., Brozyna W.: Extensive mobile thrombus of the internal carotid artery: a case report, treatment options, and review of the literature. Am Surg 2005; 71: pp. 853-855.
13. Sallustio F., Di Legge S., Marziali S., et. al.: Floating carotid thrombus treated by intravenous heparin and endarterectomy. J Vasc Surg 2011; 53: pp. 489-491.
14. Tzacheva A.A., Najarian K., Brockway J.P.: Breast cancer detection in gadolinium-enhanced MR images by static region descriptors and neural networks. J Magn Reson Imaging 2003; 17: pp. 337-342.
15. Chang E.Y., Moses D.A., Babb J.S., et. al.: Shoulder impingement: objective 3D shape analysis of acromial morphologic features. Radiology 2006; 239: pp. 497-505.
16. Li S., Shi F., Pu F., et. al.: Hippocampal shape analysis of Alzheimer disease based on machine learning methods. AJNR Am J Neuroradiol 2007; 28: pp. 1339-1345.
17. Kaiboriboon K., Hogan R.E.: Hippocampal shape analysis in status epilepticus associated with acute encephalitis. AJNR Am J Neuroradiol 2002; 23: pp. 1003-1006.
18. Christodoulou C.I., Pattichis C.S., Pantziaris M., et. al.: Texture-based classification of atherosclerotic carotid plaques. IEEE Trans Med Imaging 2003; 22: pp. 902-912.
19. de Weert T.T., Cretier S., Groen H.C., et. al.: Atherosclerotic plaque surface morphology in the carotid bifurcation assessed with multidetector computed tomography angiography. Stroke 2009; 40: pp. 1334-1340.
20. de Weert T.T., Ouhlous M., Meijering E., et. al.: In vivo characterization and quantification of atherosclerotic carotid plaque components with multidetector computed tomography and histopathological correlation. Arterioscler Thromb Vasc Biol 2006; 26: pp. 2366-2372.
21. van ‘t Klooster R., Naggara O., Marsico R., et. al.: Automated versus manual in vivo segmentation of carotid plaque MRI. AJNR Am J Neuroradiol 2012; 33: pp. 1621-1627.
22. Szczypiński P.M., Strzelecki M., Materka A., et. al.: MaZda–a software package for image texture analysis. Comput Methods Programs Biomed 2009; 94: pp. 66-76.
23. Nowakowski K., Boniecki P., Dach J.: The identification of mechanical corn kernels damages basis on neural image analysis. International Conference on Digital Image Processing Proc IEEE Comp Soc 2009; pp. 412-415.
24. da Fontoura Costa L., Marcondes Cesar R.: Shape representation.Laplante P.A.Shape classification and analysis, theory and practice.2009.Taylor & Francis GroupBoca Raton, FL:pp. 319-401.
25. Pizer S.M., Fletcher P.T., Joshi S., et. al.: Deformable M-Reps for 3D medical image segmentation. Int J Comput Vis 2003; 55: pp. 85-106.
26. Mayerhoefer M.E., Breitenseher M.J., Kramer J., et. al.: Texture analysis for tissue discrimination on T1-weighted MR images of the knee joint in a multicenter study: Transferability of texture features and comparison of feature selection methods and classifiers. J Magn Reson Imaging 2005; 22: pp. 674-680.
27. DeLong E.R., DeLong D.M., Clarke-Pearson D.L.: Comparing the areas under two or more correlated receiver operating characteristic curves: a nonparametric approach. Biometrics 1988; 44: pp. 837-845.
28. Mao J., Jain A.: Artificial neural networks for feature extraction and multivariate data projection. IEEE Trans Neural Netw 1995; 6: pp. 296-317.
29. Hecht-Nielsen R.: Neurocomputing.3rd Ed.1990.Addison-Wesley Publishing CompanyReading, MA
30. Chang C.C., Lin C.J.: LIBSVM: a library for support vector machines. ACM Transactions on Intelligent Systems and Technology 2011; 2: pp. 27.
31. Witten I.H., Frank E.: Data mining-practical machine learning tools and techniques.2nd ed.2005.Morgan KaufmannSan Francisco
32. Barnett H.J., Taylor D.W., Eliasziw M., et. al., North American Symptomatic Carotid Endarterectomy Trial Collaborators: Benefit of carotid endarterectomy in patients with symptomatic moderate or severe stenosis. N Engl J Med 1998; 339: pp. 1415-1425.
33. Grønholdt M.L., Nordestgaard B.G., Schroeder T.V., et. al.: Ultrasonic echolucent carotid plaques predict future strokes. Circulation 2001; 104: pp. 68-73.
34. Bruschi G., Cabassi A., Orlandini G., et. al.: Use of Fourier shape descriptors to improve the reproducibility of echographic measurements of arterial intima-media thickness. J Hypertens 1997; 15: pp. 467-474.
35. Lovett J.K., Gallagher P.J., Hands L.J., et. al.: Histological correlates of carotid plaque surface morphology on lumen contrast imaging. Circulation 2004; 110: pp. 2190-2197.
36. Blaser T., Hofmann K., Buerger T., et. al.: Risk of stroke, transient ischemic attack, and vessel occlusion before endarterectomy in patients with symptomatic severe carotid stenosis. Stroke 2002; 33: pp. 1057-1062.
37. Wintermark M., Jawadi S.S., Rapp J.H., et. al.: High-resolution CT imaging of carotid artery atherosclerotic plaques. AJNR Am J Neuroradiol 2008; 29: pp. 875-882.
38. van Gils M.J., Homburg P.J., Rozie S., et. al.: Evolution of artherosclerotic carotid plaque morphology: do ulcerated plaques heal? A serial multidetector CT angiography study. Cerebrovasc Dis 2011; 31: pp. 263-270.
39. Sarunas J.R., Anil K.J.: Small sample size effects in statistical pattern recognition: recommendations for practitioners. IEEE Trans Pattern Anal Mach Intell 1991; 13: pp. 252-264.
40. Madycki G., Staszkiewicz W., Gabrusiewicz A.: Carotid plaque texture analysis can predict the incidence of silent brain infarcts among patients undergoing carotid endarterectomy. Eur J Vasc Endovasc Surg 2006; 31: pp. 373-380.
41. Kakkos S.K., Stevens J.M., Nicolaides A.N., et. al.: Texture analysis of ultrasonic images of symptomatic carotid plaques can identify those plaques associated with ipsilateral embolic brain infarction. Eur J Vasc Endovasc Surg 2007; 33: pp. 422-429.
42. Kakkos S.K., Nicolaides A.N., Kyriacou E., et. al.: Computerized texture analysis of carotid plaque ultrasonic images can identify unstable plaques associated with ipsilateral neurological symptoms. Angiology 2011; 62: pp. 317-328.