
Rationale and Objectives
To differentiate endometrial cancer (ECa) from benign lesions in endometrial or in submucosa (BLs-ESm), and investigate whether the signal-to-noise ratio (SNR) of choline-containing compounds (Cho) obtained from three-dimensional 1 H magnetic resonance spectroscopy (MRS) is associated with the aggressiveness of ECa.
Materials and Methods
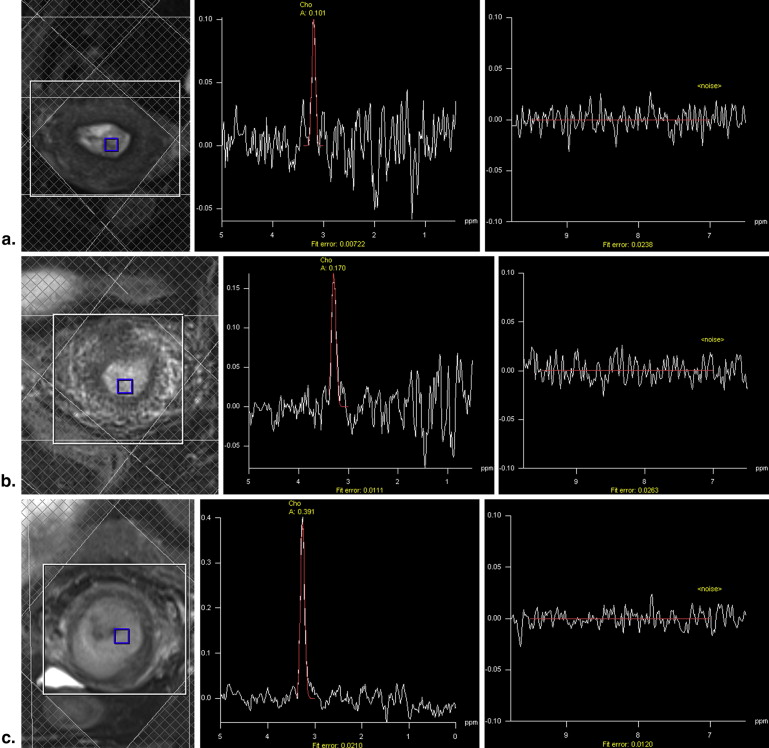
Thirty-three patients with ECa and 15 patients with BLs-ESm underwent preoperative multivoxel 1 H MRS at 3 T MR. The amplitude of Cho peak of each voxel was recorded, and the corresponding SNR of Cho peak (Cho SNR ) was calculated. The maximum Cho SNR (max Cho SNR ) for each lesion was identified. The max Cho SNR of ECa and BLs-ESm, as well as type I ECa and type II ECa, was compared. The relationship between max Cho SNR and pathologic characteristics of tumors, including tumor grade, stage, type, and tumor size, was analyzed.
Results
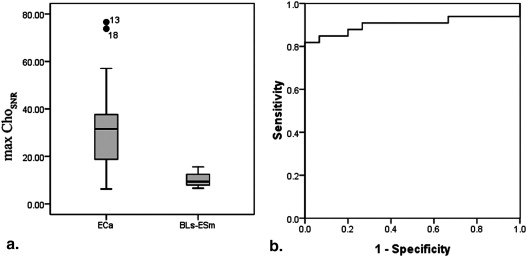
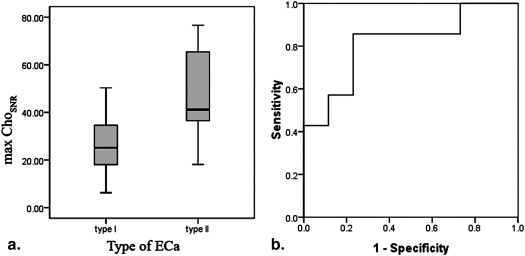
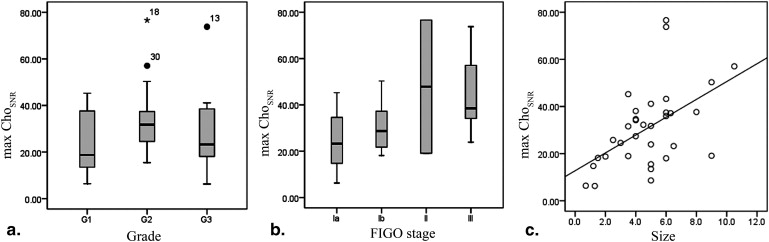
The mean max Cho SNR (±standard deviation [SD]) was 30.93 ± 16.89 for ECa and 10.40 ± 3.07 for BLs-ESm ( P < .001). The mean max Cho SNR for type II ECa (48.54 ± 21.46) was higher than that for type I ECa (26.19 ± 12.02, P = .001). There were no significant differences among different grades ( P = .449). The Spearman coefficient between max Cho SNR and stage was 0.423 ( P = .014); the difference existed only between Ia and III ECa ( P = .048). The Pearson coefficient between Cho SNR and tumor size was 0.515 ( P = .002).
Conclusions
The max Cho SNR obtained from MRS can differentiate ECa from BLs and type I ECa and type II ECa, but cannot differentiate between each grade ECa and each International Federation of Gynecology and Obstetrics stage ECa. However, max Cho SNR increased with the increase in International Federation of Gynecology and Obstetrics stage and size of ECa.
Endometrial cancer (ECa) is one of the three most common female genital tract malignancies in China. The incidence of ECa is rising worldwide in recent years. Correct diagnosis of ECa and benign lesions in endometrial or in submucosa (BLs-ESm) before surgery is very important to personalize treatment. The ECa type (type I, estrogen dependent; type II, estrogen independent), grade, stage, and tumor size were fundamental biological indicators of aggressiveness and prognosis of ECa . Type II ECa generally contains rare but aggressive subtypes of ECa, that is, squamous cell carcinoma, adenosquamous carcinoma, papillary serous carcinoma, and clear cell carcinoma, which closely related to lymph node metastasis and prognosis. The endometrial sampling is not sensitive enough to be used alone to exclude ECa. As a traditional method of diagnosis of ECa, the fractional dilatation and curettage cannot always exclude ECa when endometrial hyperplasia, especially atypical hyperplasia, was diagnosed because of limited samples . There were 16.7%–62.5% patients with atypical hyperplasia in dilatation and curettage having a diagnosis of ECa in the hysterectomy specimens .
Magnetic resonance (MR) imaging is considered as the optimal imaging modality in assessing the invasion of uterine cancers . The accuracy of staging ECa using MR imaging was high . MR imaging has also been used in determining the origin of uterine cancer and differentiation of malignant tumors from benign lesions of uterus . As a noninvasive examination, MR spectroscopy (MRS) can provide the tissue biochemical information. The clinical application of MRS has been steadily increasing in recent years. MRS contributes to the diagnosis, differentiation of malignant tumors from benign lesions, and assessing tumor aggressiveness in brain , breast , and prostate . Choline-containing compounds (Cho) increased in actively proliferating tumors . The differentiation of malignant tumors from benign lesions of uterus with single voxel MRS has been reported in a study by Takeuchi et al. . The size of single voxel was often large. The large volume of a voxel may result in the restriction of measurement of small tumor, although a signal-to-noise ratio (SNR) of single voxel MRS was relatively high. However, the differentiation of ECa from BLs-ESm and the assessment of ECa aggressiveness with multivoxel MRS have not been systematically investigated.
Get Radiology Tree app to read full this article<
Materials and methods
Patients
Get Radiology Tree app to read full this article<
MR Imaging
Get Radiology Tree app to read full this article<
Get Radiology Tree app to read full this article<
Table 1
Parameters of Magnetic Resonance Imaging Sequences
Sequences TR (ms) TE (ms) ST (mm) Average FOV (cm 2 ) Matrix Axial T2W 3110 101 3–4.5 2 20 × 20 320 × 256 Coronal T2W 3350 97 3–4 2 20 × 20 320 × 256 Sagittal T2W 2950 101 3–4 2 20 × 20 320 × 310 MRS ∗ 750 145 — 6 — — DWI † 6200 63 3–4.5 6 20 × 20 160 × 120 T1W-DCE (VIBE) 5.21 1.8 3–4 1 26 × 26 224 × 161
DCE, dynamic contrast–enhanced imaging; DWI, diffusion-weighted imaging; FOV, field of view; ST, slice thickness; T1W, T1-weighted; T2W, T2-weighted; TE, echo time; TR, repetition time; VIBE, volume interpolated body examination.
Get Radiology Tree app to read full this article<
Get Radiology Tree app to read full this article<
Get Radiology Tree app to read full this article<
MRS Data Analysis
Get Radiology Tree app to read full this article<
Root−mean−squareerror=(fittingerror)Cho(3.4−3.0)×1024/10−−−−−−−−−−−−√. Root
-
mean
-
square
error
=
(
fitting
error
)
Cho
(
3.4
−
3.0
)
×
1024
/
10
.
Get Radiology Tree app to read full this article<
Get Radiology Tree app to read full this article<
SDnoise=(fittingerror)noise(9.5−7)×1024/10−−−−−−−−−−−√. SD
noise
=
(
fitting
error
)
noise
(
9.5
−
7
)
×
1024
/
10
.
Get Radiology Tree app to read full this article<
Get Radiology Tree app to read full this article<
Histopathologic Analysis
Get Radiology Tree app to read full this article<
Table 2
The Number of Patients with Different Histopathologic Results
Lesions Value No. of lesions (no. of voxel) ECa 33 BLs-ESm 15 Type of ECa Type I (estrogen dependent) 26 Type II (estrogen independent) 7 Subtype of type II ECa Adenosquamous 2 Squamous cell 1 Endometrioid 2 Serous 1 Mixed endometrioid/clear cell 1 Histologic grade of ECa G1 9 G2 17 G3 7 FIGO stage of ECa Ia 17 Ib 8 II 2 III 6 No. of BL Polyp 4 Simple hyperplasia 3 Complex hyperplasia with or without atypia 5 Ploypoid adenomyoma 2 Leiomyomas 1
BLs-ESm, benign lesions in endometrial or in submucosa; ECa, endometrial cancer; FIGO, International Federation of Gynecology and Obstetrics.
Get Radiology Tree app to read full this article<
Statistical Analysis
Get Radiology Tree app to read full this article<
Get Radiology Tree app to read full this article<
Get Radiology Tree app to read full this article<
Results
Get Radiology Tree app to read full this article<
Get Radiology Tree app to read full this article<
Get Radiology Tree app to read full this article<
Get Radiology Tree app to read full this article<
Get Radiology Tree app to read full this article<
Get Radiology Tree app to read full this article<
Get Radiology Tree app to read full this article<
Discussion
Get Radiology Tree app to read full this article<
Get Radiology Tree app to read full this article<
Get Radiology Tree app to read full this article<
Get Radiology Tree app to read full this article<
Get Radiology Tree app to read full this article<
Get Radiology Tree app to read full this article<
Get Radiology Tree app to read full this article<
Conclusions
Get Radiology Tree app to read full this article<
Get Radiology Tree app to read full this article<
References
1. Nofech-Mozes S., Ghorab Z., Ismiil N., et. al.: Endometrial endometrioid adenocarcinoma: a pathologic analysis of 827 consecutive cases. Am J Clin Pathol 2008; 129: pp. 110-114.
2. Zhu H.L., Liang X.D., Wang J.L., et. al.: Hysteroscopy and directed biopsy in the diagnosis of endometrial carcinoma. Chin Med J 2010; 123: pp. 3524-3528.
3. Eddib A., Allaf B., Lee J., et. al.: Risk for advanced-stage endometrial cancer in surgical specimens from patients with complex endometrial hyperplasia with atypia. Gynecol Obstet Invest 2012; 73: pp. 38-42.
4. Karamursel B.S., Guven S., Tulunay G., et. al.: Which surgical procedure for patients with atypical endometrial hyperplasia?. Int J Gynecol Cancer 2005; 15: pp. 127-131.
5. Trimble C.L., Kauderer J., Zaino R., et. al.: Concurrent endometrial carcinoma in women with a biopsy diagnosis of atypical endometrial hyperplasia: a Gynecologic Oncology Group study. Cancer 2006; 106: pp. 812-819.
6. Harry V.N., Deans H., Ramage E., et. al.: Magnetic resonance imaging in gynecological oncology. Int J Gynecol Cancer 2009; 19: pp. 186-193.
7. Djurdjevic S., Zivaljevic M., Semnic R., et. al.: Diagnostic significance of ultrasound and magnetic resonance imaging scan in the presurgical determination of FIGO stage of endometrial cancer. J BUON 2010; 15: pp. 382-388.
8. Haldorsen I.S., Salvesen H.B.: Staging of endometrial carcinomas with MRI using traditional and novel MRI techniques. Clin Radiol 2012; 67: pp. 2-12.
9. Vargas H.A., Akin O., Zheng J., et. al.: The value of MR imaging when the site of uterine cancer origin is uncertain. Radiology 2011; 258: pp. 785-792.
10. Thomassin-Naggara I., Dechoux S., Bonneau C., et. al.: How to differentiate benign from malignant myometrial tumours using MR imaging. Eur Radiol 2013; 23: pp. 2306-2314.
11. Sibtain N.A., Howe F.A., Saunders D.E.: The clinical value of proton magnetic resonance spectroscopy in adult brain tumours. Clin Radiol 2007; 62: pp. 109-119.
12. Gao F., Edden R.A., Li M., et. al.: Edited magnetic resonance spectroscopy detects an age-related decline in brain GABA levels. Neuroimage 2013; 78: pp. 75-82.
13. Bartella L., Thakur S.B., Morris E.A., et. al.: Enhancing nonmass lesions in the breast: evaluation with proton (1H) MR spectroscopy. Radiology 2007; 245: pp. 80-87.
14. Kobus T., Vos P.C., Hambrock T., et. al.: Prostate cancer aggressiveness: in vivo assessment of MR spectroscopy and diffusion-weighted imaging at 3 T. Radiology 2012; 265: pp. 457-467.
15. Zhang J., Jing H., Han X., et. al.: Diffusion-weighted imaging of prostate cancer on 3T MR: relationship between apparent diffusion coefficient values and Ki-67 expression. Acad Radiol 2013; 20: pp. 1535-1541.
16. Payne G.S., Schmidt M., Morgan V.A., et. al.: Evaluation of magnetic resonance diffusion and spectroscopy measurements as predictive biomarkers in stage 1 cervical cancer. Gynecol Oncol 2010; 116: pp. 246-252.
17. Takeuchi M., Matsuzaki K., Harada M.: Differentiation of benign and malignant uterine corpus tumors by using proton MR spectroscopy at 3T: preliminary study. Eur Radiol 2011; 21: pp. 850-856.
18. Celik O., Hascalik S., Sarac K., et. al.: Magnetic resonance spectroscopy of premalignant and malignant endometrial disorders: a feasibility of in vivo study. Eur J Obstet Gynecol Reprod Biol 2005; 118: pp. 241-245.
19. Okada T., Harada M., Matsuzaki K., et. al.: Evaluation of female intrapelvic tumors by clinical proton MR spectroscopy. J Magn Reson Imaging 2001; 13: pp. 912-917.
20. Mahon M.M., Cox I.J., Dina R., et. al.: (1)H magnetic resonance spectroscopy of preinvasive and invasive cervical cancer: in vivo-ex vivo profiles and effect of tumor load. J Magn Reson Imaging 2004; 19: pp. 356-364.
21. Booth S.J., Pickles M.D., Turnbull L.W.: In vivo magnetic resonance spectroscopy of gynaecological tumours at 3.0 Tesla. BJOG 2009; 116: pp. 300-303.
22. Glunde K., Bhujwalla Z.M., Ronen S.M.: Choline metabolism in malignant transformation. Nat Rev Cancer 2011; 11: pp. 835-848.
23. Danishad K.K., Sharma U., Sah R.G., et. al.: Assessment of therapeutic response of locally advanced breast cancer (LABC) patients undergoing neoadjuvant chemotherapy (NACT) monitored using sequential magnetic resonance spectroscopic imaging (MRSI). NMR Biomed 2010; 23: pp. 233-241.
24. McLean M.A., Priest A.N., Joubert I., et. al.: Metabolic characterization of primary and metastatic ovarian cancer by 1H-MRS in vivo at 3T. Magn Reson Med 2009; 62: pp. 855-861.
25. Baik H.M., Su M.Y., Yu H., et. al.: Quantification of choline-containing compounds in malignant breast tumors by 1H MR spectroscopy using water as an internal reference at 1.5 T. Magma (New York, NY) 2006; 19: pp. 96-104.