
Rationale and Objectives
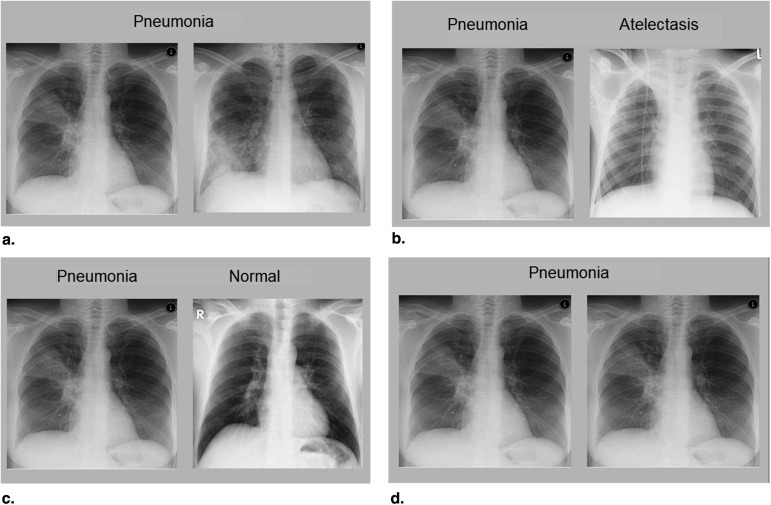
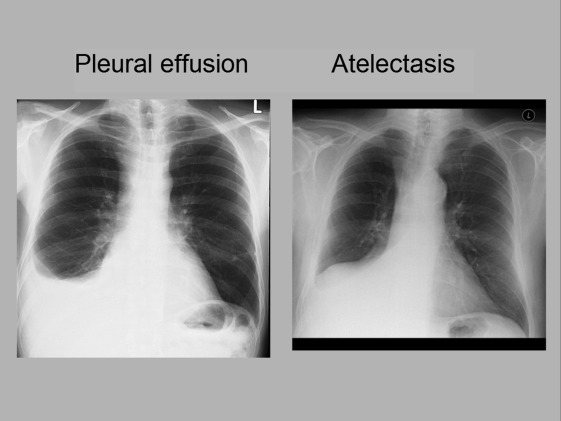
Radiologists commonly use comparison films to improve their differential diagnosis. Educational literature suggests that this technique might also be used to bolster the process of learning to interpret radiographs. We investigated the effectiveness of three comparison techniques in medical students, whom we invited to compare cases of the same disease (same-disease comparison), cases of different diseases (different-disease comparison), disease images with normal images (disease/normal comparison), and identical images (no comparison/control condition). Furthermore, we used eye-tracking technology to investigate which elements of the two cases were compared by the students.
Materials and Methods
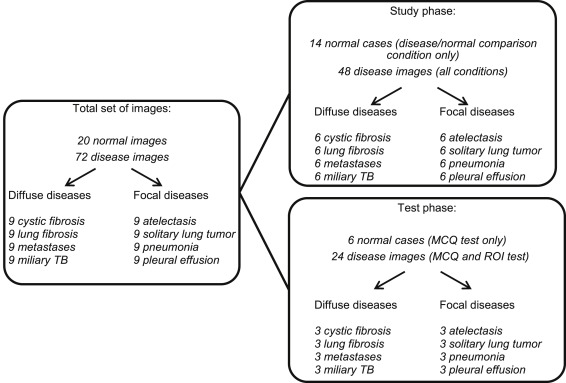
We randomly assigned 84 medical students to one of four conditions and had them study different diseases on chest radiographs, while their eye movements were being measured. Thereafter, participants took two tests that measured diagnostic performance and their ability to locate diseases, respectively.
Results
Students studied most efficiently in the same-disease and different-disease comparison conditions: test 1, F (3, 68) = 3.31, P = .025, η__p 2 = 0.128; test 2, F (3, 65) = 2.88, P = .043, η__p 2 = 0.117. We found that comparisons were effected in 91% of all trials (except for the control condition). Comparisons between normal anatomy were particularly common (45.8%) in all conditions.
Conclusions
Comparing cases can be an efficient way of learning to interpret radiographs, especially when the comparison technique used is specifically tailored to the learning goal. Eye tracking provided insight into the comparison process, by showing that few comparisons were made between abnormalities, for example.
It is common practice for radiologists to compare films of a particular patient over time. This practice is taught to radiologist in training . It was found that, especially in the case of junior radiology residents, abnormalities are more easily detected when a prior image with no abnormalities (normal image) is presented alongside the case to be diagnosed . Hence, comparison can help to differentiate abnormalities from normal anatomy .
In a context of radiology education, it is of paramount importance that students learn to recognize common abnormalities on radiographs . Educational literature suggests that the use of comparison can bolster this learning process . The web-based training program COMPARE (University of Erlangen-Nuremberg, Erlangen, Germany) , for example, uses a page format in which a normal image flanks a pathologic image, and students are prompted to compare these. As much as 91% of the students and 88% of the residents who used this program valued the technique as useful or very useful . In addition, it was found that students learned more effectively when comparing focal diseases (ie, lesions in one location) to normal images than when comparing two pathologic images .
Get Radiology Tree app to read full this article<
Get Radiology Tree app to read full this article<
Get Radiology Tree app to read full this article<
Get Radiology Tree app to read full this article<
Materials and methods
Procedure
Get Radiology Tree app to read full this article<
Get Radiology Tree app to read full this article<
Get Radiology Tree app to read full this article<
Get Radiology Tree app to read full this article<
Participants
Get Radiology Tree app to read full this article<
Cases
Get Radiology Tree app to read full this article<
Get Radiology Tree app to read full this article<
Get Radiology Tree app to read full this article<
Measures
Performance Test
Get Radiology Tree app to read full this article<
Get Radiology Tree app to read full this article<
Cognitive Load
Get Radiology Tree app to read full this article<
Apparatus
Get Radiology Tree app to read full this article<
Analyses
Get Radiology Tree app to read full this article<
Get Radiology Tree app to read full this article<
Get Radiology Tree app to read full this article<
Results
Test Scores
Get Radiology Tree app to read full this article<
Table 1
Average Scores and Standard Deviations for the Four Conditions on the MCQ Test (Disease and Normal Questions Separately), ROI Test, Extraneous Cognitive Load Scale, and Time Spent Learning
Condition MCQ Test (Disease Cases) MCQ Test (Normal Cases) ROI Test Extraneous Cognitive Load Time Spent Learning (min) M SD M SD M SD M SD M SD Disease/normal comparison 11.3 (49.1%) 3.4 2.8 (45.8%) 1.5 30.2% 11.4 0.5 0.7 9.0 3.0 Same-disease comparison 12.5 (54.3%) 2.6 1.3 (22.1%) 1.2 34.8% 6.8 1.0 1.3 7.8 2.7 Different-disease comparison 13.6 (59.1%) 2.7 2.1 (35.0%) 1.6 34.5% 12.3 0.7 0.8 8.5 2.5 No comparison 13.5 (58.7%) 2.7 2.0 (33.3%) 1.8 33.6% 10.5 1.0 1.2 11.5 4.3
M, mean; MCQ, multiple-choice questions; ROI, region of interest; SD, standard deviation.
The MCQ scores are expressed as number of cases correctly identified, with its related percentage in parentheses. The ROI test score is the percentage of overlap. The extraneous cognitive load is the average score (maximum score is 10).
Get Radiology Tree app to read full this article<
MCQ Test: Disease Cases
Get Radiology Tree app to read full this article<
MCQ Test: Normal Cases
Get Radiology Tree app to read full this article<
ROI Test
Get Radiology Tree app to read full this article<
Extraneous Cognitive Load
Get Radiology Tree app to read full this article<
Time Spent Studying
Get Radiology Tree app to read full this article<
Efficiency
Get Radiology Tree app to read full this article<
Get Radiology Tree app to read full this article<
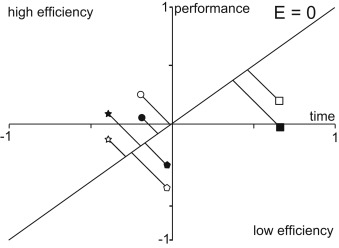
Table 2
Average Efficiency for the Four Conditions on the MCQ Test and ROI Test
Condition Efficiency MCQ Test Efficiency ROI Test M SD M SD Disease/normal comparison −0.36 0.71 −0.18 0.85 Same-disease comparison 0.18 0.76 0.33 0.61 Different-disease comparison 0.32 0.89 0.18 1.04 No comparison −0.32 0.81 −0.51 1.19
M, mean; SD, standard deviation.
Efficiency = (z-test score − z-study time)/√2.
Table 3
P -Values for Post Hoc Tests for Efficiency
Post-hoc comparisons Efficiency MCQ Test Efficiency ROI Test Mean Difference_P_ Value Cohen’s d Mean Difference_P_ Value Cohen’s d Disease/normal comparison Same-disease comparison −0.54 .047 0.75 −0.52 .119 0.74 Different-disease comparison −0.68 .017 0.86 −0.36 .289 0.39 No comparison −0.04 .895 0.05 0.33 .326 0.32 Same-disease comparison Different-disease comparison −0.14 .607 0.17 0.16 .619 0.19 No comparison 0.51 .052 0.66 0.84 .009 0.93 Different-disease comparison No comparison 0.64 .019 0.78 0.69 .036 0.63
Get Radiology Tree app to read full this article<
Eye Tracking
Get Radiology Tree app to read full this article<
Get Radiology Tree app to read full this article<
Get Radiology Tree app to read full this article<
Table 4
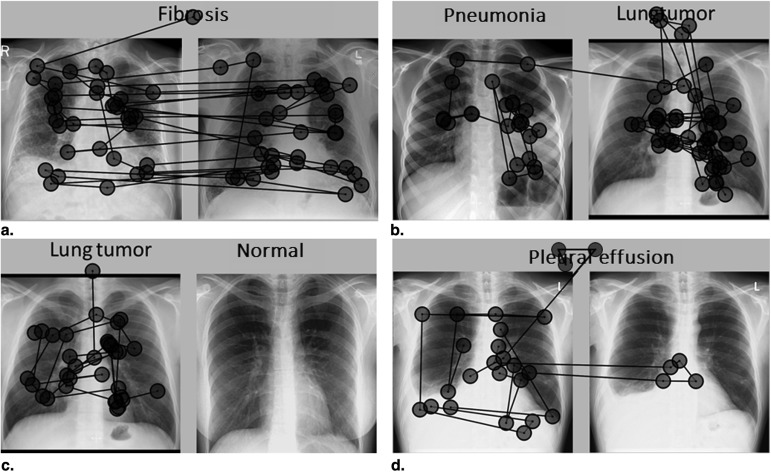
Classification of 639 Comparison Saccades From 120 Randomly Selected Trials, Showing Which Elements of the Cases Were Compared by the Students
Type of Comparison Study Condition Disease/Normal Condition Different-Disease Condition Same-Disease Condition Total Focal ( n = 20) Diffuse ( n = 20) Focal ( n = 20) Diffuse ( n = 20) Focal ( n = 20) Diffuse ( n = 20) ( n = 120) (1) Involves an abnormality 12 (9.8 %) 24 (27.0 %) 39 (31.2 %) 75 (11.7 %) (2) Comparison of the same organ 49 (39.8 %) 65 (63.1%) 36 (40.4 %) 46 (52.3 %) 40 (32.0 %) 57 (51.3 %) 293 (45.8 %) (3) Comparison of different organs 62 (50.4 %) 38 (36.9%) 29 (32.4 %) 42 (47.7 %) 46 (36.8 %) 54 (48.3 %) 271 (42.4 %) Total number of comparison saccades 123 (100 %) 103 (100 %) 89 (100 %) 88 (100 %) 125 (100 %) 111 (100 %) 639 (100 %)
A trial refers to the eye movements of one participant on one case pair. Forty trials from each condition (20 focal case pairs, 20 diffuse case pairs) were randomly selected. All comparison saccades in these trials (639 in total) were classified as (1) a comparison involving an abnormality, (2) a comparison of the same organ, or (3) a comparison of different organs. Comparisons in the control condition have not been analyzed. Numbers and percentages add up to 100% vertically, representing the total number of saccades affected in the 20 trials within a condition and type of image. For example, of all 123 saccades affected in the 20 focal trials from the disease/normal condition, 12 (9.8%) were comparisons involving an abnormality, 49 (39.8%) were comparisons of the same organ, and 62 (50.4%) were comparisons of different organs.
Get Radiology Tree app to read full this article<
Discussion
Get Radiology Tree app to read full this article<
Get Radiology Tree app to read full this article<
Get Radiology Tree app to read full this article<
Get Radiology Tree app to read full this article<
Get Radiology Tree app to read full this article<
Get Radiology Tree app to read full this article<
Get Radiology Tree app to read full this article<
Get Radiology Tree app to read full this article<
Get Radiology Tree app to read full this article<
Get Radiology Tree app to read full this article<
Get Radiology Tree app to read full this article<
Get Radiology Tree app to read full this article<
Get Radiology Tree app to read full this article<
Get Radiology Tree app to read full this article<
Conclusions
Get Radiology Tree app to read full this article<
Acknowledgments
Get Radiology Tree app to read full this article<
References
1. Carmody D.P., Kundel H.L., Toto L.C.: Comparison scans while reading chest images. Taught, but not practiced. Invest Radiol 1984; 19: pp. 462-466.
2. Berbaum K.S., Franken E.A., Smith T.J.: The effect of comparison films upon resident interpretation of pediatric chest radiographs. Invest Radiol 1985; 20: pp. 124-128.
3. Carmody D.P., Nodine C.F., Kundel H.L.: Finding lung nodules with and without comparative visual scanning. Percept Psychophys 1981; 29: pp. 594-598.
4. Kondo K.L., Swerdlow M.: Medical student radiology curriculum: what skills do residency program directors believe are essential for medical students to attain?. Acad Radiol 2013; 20: pp. 263-271.
5. Grunewald M., Heckemann R.A., Gebhard H., et. al.: COMPARE radiology: creating an interactive Web-based training program for radiology with multimedia authoring software. Acad Radiol 2003; 10: pp. 543-553.
6. Kok E.M., de Bruin A.B.H., Robben S.G.F., et. al.: Learning radiological appearances of diseases, does comparison help?. Learn Instr 2013; 23: pp. 90-97.
7. Wagner M., Heckemann R.A., Nomayr A., et. al.: COMPARE/radiology, an interactive Web-based radiology teaching program: evaluation of user response. Acad Radiol 2005; 12: pp. 752-760.
8. Hatala R.M., Brooks L.R., Norman G.R.: Practice makes perfect: the critical role of mixed practice in the acquisition of ECG interpretation skills. Adv Health Sci Educ Theory Pract 2003; 8: pp. 17-26.
9. van Merrienboer J.J.G., Sweller J.: Cognitive load theory in health professional education: design principles and strategies. Med Educ 2010; 44: pp. 85-93.
10. Holmqvist K., Nyström M., Andersson R., et. al.: Eye tracking: a comprehensive guide to methods and measures.2011.Oxford University PressOxford
11. Kok E.M., de Bruin A.B.H., Robben S.G.F., et. al.: Looking in the same manner but seeing it differently: Bottom-up and expertise effects in radiology. Appl Cognitive Psych 2012; 26: pp. 854-862.
12. Leppink J., Paas F., van Gog T., et. al.: Effects of pairs of problems and examples on task performance and different types of cognitive load. Learn Instruct 2014; 30: pp. 32-42.
13. Field A.P.: Discovering statistics using SPSS.2009.Sage PublicationsLondon
14. Cohen J.: Statistical power analysis for the behavioral sciences.1988.Lawrence Earlbaum AssociatesHillsdale, NJ
15. Van Gog T., Paas F.: Instructional efficiency: revisiting the original construct in educational research. Educ Psychol 2008; 43: pp. 16-26.
16. Paas F.G., Van Merriënboer J.J.: The efficiency of instructional conditions: an approach to combine mental effort and performance measures. Human Factors 1993; 35: pp. 737-743.
17. Hammer R., Diesendruck G., Weinshall D., et. al.: The development of category learning strategies: what makes the difference?. Cognition 2009; 112: pp. 105-119.
18. Alfieri L., Nokes-Malach T.J., Schunn C.D.: Learning through case comparisons: a meta-analytic review. Educ Psychol 2013; 48: pp. 87-113.
19. Reingold E.M., Sheridan H.: Eye movements and visual expertise in chess and medicine.Leversedge S.P.Gilchrist I.D.Everling S.Oxford handbook on eye movements.2011.Oxford University PressOxford:pp. 528-550.
20. Gunderman R., Williamson K., Fraley R., et. al.: Expertise: implications for radiological education. Acad Radiol 2001; 8: pp. 1252.