
Rationale and Objectives
At lower magnetic field strengths, regional differences of cerebral metabolite distributions have been described, but these data are controversial. Magnetic resonance spectroscopy at 7 T is expected to deliver high spectral resolution and good differentiation, but there are problems arising at high magnetic field strengths that may diminish spectral quality. Because there have been only a few studies in humans so far, there are no standard values for 7 T concerning regional metabolite distributions and concentrations.
Materials and Methods
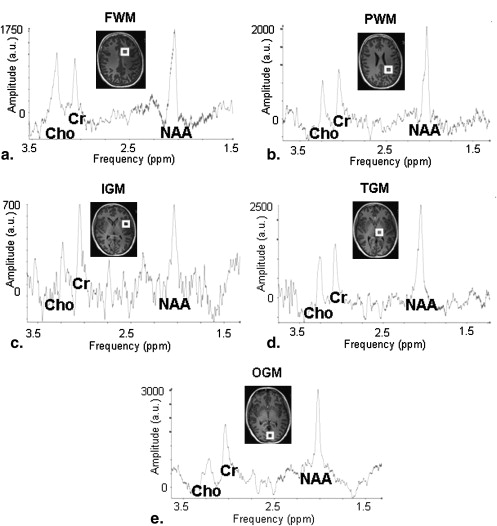
In the present study, the metabolites detectable with 1 H magnetic resonance spectroscopy, N-acetyl-aspartate, choline, and creatine (Cr), were evaluated with a single-voxel sequence. Five voxels were placed in the frontal and parietal white matter and the insular, thalamic, and occipital gray matter.
Results
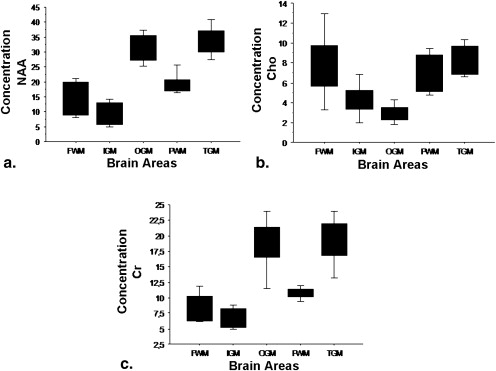
For N-acetyl-aspartate, the lowest values were found in frontal white matter and the highest in thalamic gray matter. Choline displayed the lowest values in frontal white matter and the highest in insular gray matter. Cr showed the lowest values in frontal white matter and the highest in thalamic gray matter. The highest ratio of choline to Cr was found in parietal white matter and the lowest in thalamic gray matter. The highest ratio of N-acetyl-aspartate to Cr was found in thalamic gray matter and the lowest in frontal white matter.
Conclusions
In the present study, regional cerebral metabolite differences were verified with high-field magnetic resonance spectroscopy. Quantitative values and metabolite ratios could be a basis for further clinical studies.
In prior studies at 1.5 and 3 T, regional differences of cerebral metabolite concentrations have been described, but these data are contradictory . At 7 T, cerebral regional metabolite distributions have not yet been evaluated. High-field magnetic resonance spectroscopy (MRS) has the potential to provide enhanced neurochemical information on the basis of increased sensitivity and higher spectral resolution . However, problems arising in high-field magnetic resonance imaging, such as more pronounced B 0 and B 1 inhomogeneities, may decrease spectral resolution and minimize quantitation accuracy. The present 7-T study was an attempt to clarify existing uncertainties concerning cerebral metabolite distributions with established preprocessing software and quantization algorithm .
For this purpose, the three most commonly used metabolites, N-acetyl-aspartate (NAA), choline (Cho) and creatine (Cr), were evaluated. NAA is a marker for neuronal density, integrity, and viability and resonates at a frequency of 2.02 ppm . Cho is a marker of membrane density and integrity; its resonance frequency is at 3.22 ppm. Cr, which resonates at 3.02 ppm, is a marker for energy metabolism and is assumed to be quite stable in healthy but also pathologic brain tissue .
Materials and methods
Get Radiology Tree app to read full this article<
Get Radiology Tree app to read full this article<
Get Radiology Tree app to read full this article<
Get Radiology Tree app to read full this article<
Results
Get Radiology Tree app to read full this article<
Table 1
Results in the 10 Volunteers for Metabolite Concentrations Quantified Using the Advanced Method for Accurate, Robust, and Efficient Spectral Fitting (Arbitrary Units)
Region NAA Cho Cr Cho/Cr NAA/Cr FWM 13.60 ± 5.45 7.51 ± 2.76 7.97 ± 2.44 0.97 ± 0.33 1.67 ± 0.26 PWM 19.10 ± 3.50 9.00 ± 7.48 10.32 ± 1.88 0.94 ± 0.91 1.88 ± 0.35 IGM 12.33 ± 5.45 8.87 ± 8.46 7.73 ± 2.36 1.04 ± 0.73 1.57 ± 0.46 TGM 38.27 ± 8.60 9.38 ± 6.27 20.79 ± 4.99 0.48 ± 0.31 1.86 ± 0.26 OGM 31.57 ± 6.00 3.68 ± 2.48 18.48 ± 3.76 0.20 ± 0.10 1.73 ± 0.27
Cho, choline; Cr, creatine; FWM, frontal white matter; IGM, insular gray matter; NAA, N-acetyl-aspartate; OGM, occipital gray matter; PWM, parietal white matter; TGM, thalamic gray matter.
Get Radiology Tree app to read full this article<
Get Radiology Tree app to read full this article<
Get Radiology Tree app to read full this article<
Get Radiology Tree app to read full this article<
Get Radiology Tree app to read full this article<
Get Radiology Tree app to read full this article<
Discussion
Get Radiology Tree app to read full this article<
Get Radiology Tree app to read full this article<
Get Radiology Tree app to read full this article<
Get Radiology Tree app to read full this article<
Get Radiology Tree app to read full this article<
Get Radiology Tree app to read full this article<
Conclusions
Get Radiology Tree app to read full this article<
References
1. Inglese M., Rusinek H., George I.C., et. al.: Global average gray and white matter N-acetylaspartate concentration in the human brain. Neuroimage 2008; 41: pp. 270-276.
2. Noworolski S.M., Nelson S.J., Henry R.G., et. al.: High spatial resolution 1H-MRSI and segmented MRI of cortical gray matter and subcortical white matter in three regions of the human brain. Magn Reson Med 1999; 41: pp. 21-29.
3. Pouwels P.J., Frahm J.: Regional metabolite concentrations in human brain as determined by quantitative localized proton MRS. Magn Reson Med 1998; 39: pp. 53-60.
4. Schuff N., Ezekiel F., Gamst A.C., et. al.: Region and tissue differences of metabolites in normally aged brain using multislice 1H magnetic resonance spectroscopic imaging. Magn Reson Med 2001; 45: pp. 899-907.
5. Tkac I., Andersen P., Adriany G., et. al.: In vivo 1H NMR spectroscopy of the human brain at 7 T. Magn Reson Med 2001; 46: pp. 451-456.
6. Mazzoni L.N., Belli G., Ginestroni A., et. al.: Computation of brain metabolite ratios in single-voxel proton MR spectroscopy: comparison between semiautomatic and automatic software. Radiol Med 2010; 115: pp. 125-132.
7. Torriani M., Thomas B.J., Halpern E.F., et. al.: Intramyocellular lipid quantification: repeatability with 1H MR spectroscopy. Radiology 2005; 236: pp. 609-614.
8. Vanhamme L., van den Boogaart A., Van Huffel S.: Improved method for accurate and efficient quantification of MRS data with use of prior knowledge. J Magn Reson 1997; 129: pp. 35-43.
9. Arnold D.L., de Stefano N., Matthews P.M., et. al.: N-acetylaspartate: usefulness as an indicator of viable neuronal tissue. Ann Neurol 2001; 50: pp. 823-825.
10. Soares D.P., Law M.: Magnetic resonance spectroscopy of the brain: review of metabolites and clinical applications. Clin Radiol 2009; 64: pp. 12-21.
11. Orzada S, Kraff O, Schäfer LC, et al. 8-channel transmit/receive head coil for 7 T human imaging using intrinsically decoupled strip line elements with meanders. Presented at: ISMRM 17th Scientific Meeting & Exhibition; Honolulu, HI; 2009.
12. Frahm J., Bruhn H., Gyngell M.L., et. al.: Localized proton NMR spectroscopy in different regions of the human brain in vivo. Relaxation times and concentrations of cerebral metabolites. Magn Reson Med 1989; 11: pp. 47-63.
13. Wang Y., Li S.J.: Differentiation of metabolic concentrations between gray matter and white matter of human brain by in vivo 1H magnetic resonance spectroscopy. Magn Reson Med 1998; 39: pp. 28-33.
14. Wiedermann D., Schuff N., Matson G.B., et. al.: Short echo time multislice proton magnetic resonance spectroscopic imaging in human brain: metabolite distributions and reliability. Magn Reson Imaging 2001; 19: pp. 1073-1080.
15. Hetherington H.P., Mason G.F., Pan J.W., et. al.: Evaluation of cerebral gray and white matter metabolite differences by spectroscopic imaging at 4.1T. Magn Reson Med 1994; 32: pp. 565-571.
16. Otazo R., Mueller B., Ugurbil K., et. al.: Signal-to-noise ratio and spectral linewidth improvements between 1.5 and 7 Tesla in proton echo-planar spectroscopic imaging. Magn Reson Med 2006; 56: pp. 1200-1210.
17. Barker P.B., Hearshen D.O., Boska M.D.: Single-voxel proton MRS of the human brain at 1.5T and 3.0T. Magn Reson Med 2001; 45: pp. 765-769.
18. Gonen O., Gruber S., Li B.S., et. al.: Multivoxel 3D proton spectroscopy in the brain at 1.5 versus 3.0 T: signal-to-noise ratio and resolution comparison. AJNR Am J Neuroradiol 2001; 22: pp. 1727-1731.
19. Vaughan J.T., Garwood M., Collins C.M., et. al.: 7T vs. 4T: RF power, homogeneity, and signal-to-noise comparison in head images. Magn Reson Med 2001; 46: pp. 24-30.
20. Gambarota G., Mekle R., Xin L., et. al.: In vivo measurement of glycine with short echo-time 1H MRS in human brain at 7 T. Magma 2009; 22: pp. 1-4.