
Rationale and Objectives
The aim of this study was to assess the relationship between immune state and cerebral signal intensity abnormalities (SIAs) on T2-weighted magnetic resonance images in subjects with human immunodeficiency virus type 1 infection and highly active antiretroviral therapy.
Materials and Methods
Thirty-two subjects underwent a total of 109 magnetic resonance studies. The presence of human immunodeficiency virus–associated neurocognitive disorder, categorized CD4 + T lymphocyte count, and plasma viral load were assessed for relationship with the severity and interval change of SIAs for different anatomic locations of the brain.
Results
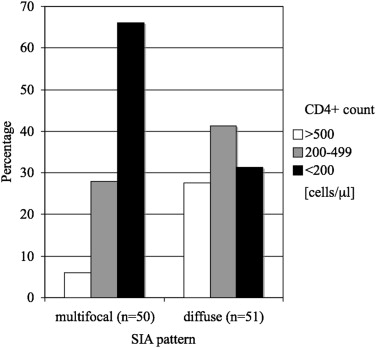
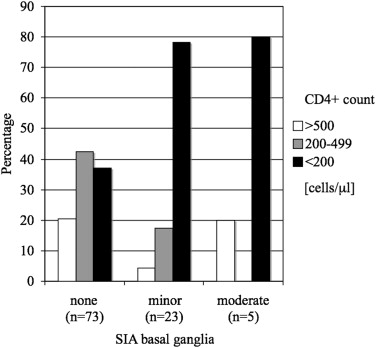
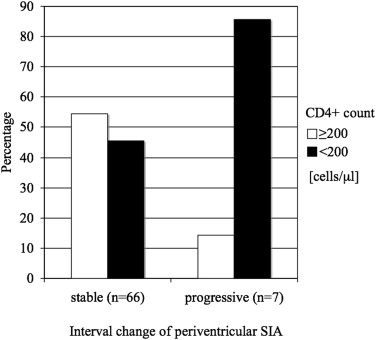
Subjects with multifocal patterns of SIAs had CD4 + cell counts < 200 cells/μL in 66.0%, whereas subjects with diffuse patterns of SIAs had CD4 + cell counts < 200 cells/μL in only 31.4% ( P < .001). Subjects without SIAs in the basal ganglia had CD4 + cell counts < 200 cells/μL in 37.0%, whereas subjects with minor and moderate SIAs in the basal ganglia had CD4 + cell counts < 200 cells/μL in 78.3% and 80.0%, respectively ( P < .005). The percentage of subjects with CD4 + cell counts < 200 cells/μL was 85.7% when there were progressive periventricular SIA changes and 45.5% when periventricular SIA changes were stable in follow-up ( P < .05).
Conclusions
The presence and progression of cerebral SIAs on T2-weighted magnetic resonance images reflecting cerebral infection with human immunodeficiency virus are significantly related to impaired immune state as measured by CD4 + cell count.
Central nervous system (CNS) involvement often occurs as part of human immunodeficiency virus (HIV) infection. This concerns not only the incidence of opportunistic CNS infections but in particular the direct CNS manifestation of HIV infection . Usually, in 10% of all HIV-infected and acquired immunodeficiency syndrome (AIDS) patients, neurologic complaints are the initial clinical manifestation, and an additional 30% to 60% of all patients will develop neurologic symptoms during the course of the infection . Cerebrospinal fluid analysis has demonstrated that HIV enters the CNS soon after exposure, even before antibodies are detectable in blood .
In the past, different patterns of changes in cerebral magnetic resonance (MR) imaging (MRI) in HIV infection have been described . MRI studies have provided in vivo evidence of white matter abnormalities on T2-weighted MR images in HIV type 1 , and reduced cerebral white matter volume has been reported in advanced disease stages . However, knowledge is limited about signal intensity abnormalities (SIAs) on T2-weighted MR images in subjects with HIV since the introduction of highly active antiretroviral therapy (HAART) in HIV treatment 15 years ago. In small study populations, MRI has been demonstrated to characterize cerebral changes during the course of HAART in patients with AIDS . Nevertheless, little information is available on the relationship of neuroclinical status and the distribution of white matter lesions in patients with HIV and AIDS receiving HAART.
Get Radiology Tree app to read full this article<
Materials and methods
Study Population
Get Radiology Tree app to read full this article<
Clinical Parameters
Get Radiology Tree app to read full this article<
Imaging Protocol
Get Radiology Tree app to read full this article<
Table 1
Scan Parameters of the MR Systems Used in the Study
Scanner TR (ms) TE (ms) FOV (mm) Matrix (mm) ST (mm) NSA Magnetom Impact 1.0 T ∗ 3000 85 230 × 230 250 × 256 5 2 Magnetom Expert 1.5 T ∗ 4000 90 230 × 230 252 × 256 5 2 Magnetom Vision 1.5 T ∗ 2700 90 230 × 230 192 × 256 5 2 Intera Gyroscan 1.5 T † 4500 100 230 × 230 299 × 512 6 2 Intera Gyroscan 3.0 T † 3000 80 230 × 230 319 × 512 4 1
FOV, field of view; MR, magnetic resonance; NSA, number of signal acquisitions; ST, slice thickness, TE, echo time; TR, repetition time.
Get Radiology Tree app to read full this article<
Get Radiology Tree app to read full this article<
Get Radiology Tree app to read full this article<
Image Analysis
Get Radiology Tree app to read full this article<
Table 2
Grading Scales of Image Analysis
Description Scale Pattern of signal intensity abnormalities None Multifocal Diffuse Severity of signal intensity abnormalities ∗ None Mild (<25%) Moderate (25%–75%) Severe (>75%)
Get Radiology Tree app to read full this article<
Get Radiology Tree app to read full this article<
Get Radiology Tree app to read full this article<
Statistical Analysis
Get Radiology Tree app to read full this article<
Get Radiology Tree app to read full this article<
Get Radiology Tree app to read full this article<
Get Radiology Tree app to read full this article<
Results
Study Population
Get Radiology Tree app to read full this article<
Descriptive Statistics
Get Radiology Tree app to read full this article<
Table 3
Descriptive Statistics
Severity of Signal Intensity Abnormalities HAND χ 2 P Value Yes No Pattern .340 None 0 (0.0%) 0 (0.0%) Multifocal 36 (35.6%) 18 (17.8%) Diffuse 27 (26.7%) 20 (19.8%) Periventricular white matter .119 None 10 (9.9%) 14 (13.9%) Mild 36 (35.6%) 17 (16.8%) Moderate 9 (8.9%) 4 (4.0%) Severe 8 (7.9%) 3 (3.0%) Basal ganglia .083 None 40 (39.6%) 32 (31.7%) Mild 19 (18.8%) 5 (5.0%) Moderate 4 (4.0%) 1 (1.0%) Severe 0 (0.0%) 0 (0.0%) Posterior fossa .220 None 38 (37.6%) 29 (28.7%) Mild 24 (23.8%) 9 (8.9%) Moderate 1 (1.0%) 0 (0.0%) Severe 0 (0.0%) 0 (0.0%)
HAND, human immunodeficiency virus–associated neurocognitive disorder.
Get Radiology Tree app to read full this article<
Correlation Statistics
Get Radiology Tree app to read full this article<
Get Radiology Tree app to read full this article<
Get Radiology Tree app to read full this article<
Get Radiology Tree app to read full this article<
Get Radiology Tree app to read full this article<
Discussion
Get Radiology Tree app to read full this article<
Relationship with Pattern and Location of SIAs
Get Radiology Tree app to read full this article<
Get Radiology Tree app to read full this article<
Get Radiology Tree app to read full this article<
Relationship with Changes of SIA Severity on Follow-up
Get Radiology Tree app to read full this article<
Limitations of This Study
Get Radiology Tree app to read full this article<
Conclusions
Get Radiology Tree app to read full this article<
Get Radiology Tree app to read full this article<
Appendix
Get Radiology Tree app to read full this article<
Get Radiology Tree app to read full this article<
Get Radiology Tree app to read full this article<
Get Radiology Tree app to read full this article<
Table A1
Relationship Between Categorized CD4 + Cell Count and Pattern of SIAs for Subgroup with Identical Magnetic Resonance Scanner ∗ ( n = 39)
CD4 + Cell Count (cells/μL) Pattern of SIAs ≥500 200–499 <200 Multifocal ( n = 24) 8.3% 16.7% 75.0% Diffuse ( n = 15) 40.0% 26.7% 33.3%
Two-sided χ 2 test P = .021.
SIA, signal intensity abnormality.
Get Radiology Tree app to read full this article<
Table A2
Relationship Between Categorized CD4 + Cell Count and the Severity of BG SIAs for Subgroup with Identical Magnetic Resonance Scanner ∗ ( n = 39)
CD4 + Cell Count (cells/μL) Severity of BG SIAs ≥500 200–499 <200 None ( n = 24) 29.2% 29.2% 41.6% Mild ( n = 10) 0.0% 10.0% 90.0% Moderate ( n = 5) 20.0% 0.0% 80.0% Severe ( n = 0) 0.0% 0.0% 0.0%
Two-sided χ 2 test P = .072.
BG, basal ganglia; SIA, signal intensity abnormality.
Get Radiology Tree app to read full this article<
Get Radiology Tree app to read full this article<
References
1. Smith A.B., Smirniotopoulos J.G., Rushing E.J.: From the archives of the AFIP: central nervous system infections associated with human immunodeficiency virus infection: radiologic-pathologic correlation. Radiographics 2008; 28: pp. 2033-2058.
2. Snider W.D., Simpson D.M., Nielsen S., et. al.: Neurological complications of acquired immune deficiency syndrome: analysis of 50 patients. Ann Neurol 1983; 14: pp. 403-418.
3. Davis L.E., Hjelle B.L., Miller V.E., et. al.: Early viral brain invasion in iatrogenic human immunodeficiency virus infection. Neurology 1992; 42: pp. 1736-1739.
4. Pomara N., Crandall D.T., Choi S.J., et. al.: White matter abnormalities in HIV-1 infection: a diffusion tensor imaging study. Psychiatry Res 2001; 106: pp. 15-24.
5. Thurnher M.M., Schindler E.G., Thurnher S.A., et. al.: Highly active antiretroviral therapy for patients with AIDS dementia complex: effect on MR imaging findings and clinical course. AJNR Am J Neuroradiol 2000; 21: pp. 670-678.
6. Meltzer C.C., Wells S.W., Becher M.W., et. al.: AIDS-related MR hyperintensity of the basal ganglia. AJNR Am J Neuroradiol 1998; 19: pp. 83-89.
7. Thurnher M.M., Thurnher S.A., Fleischmann D., et. al.: Comparison of T2-weighted and fluid-attenuated inversion-recovery fast spin-echo MR sequences in intracerebral AIDS-associated disease. AJNR Am J Neuroradiol 1997; 18: pp. 1601-1609.
8. Broderick D.F., Wippold F.J., Clifford D.B., et. al.: White matter lesions and cerebral atrophy on MR images in patients with and without AIDS dementia complex. AJR Am J Roentgenol 1993; 161: pp. 177-181.
9. Bornstein R.A., Chakeres D., Brogan M., et. al.: Magnetic resonance imaging of white matter lesions in HIV infection. J Neuropsychiatry Clin Neurosci 1992; 4: pp. 174-178.
10. McArthur J.C., Kumar A.J., Johnson D.W., et. al.: Incidental white matter hyperintensities on magnetic resonance imaging in HIV-1 infection. Multicenter AIDS Cohort Study. J Acquir Immune Defic Syndr 1990; 3: pp. 252-259.
11. Olsen W.L., Longo F.M., Mills C.M., et. al.: White matter disease in AIDS: findings at MR imaging. Radiology 1988; 169: pp. 445-448.
12. Jernigan T.L., Archibald S., Hesselink J.R., et. al., The HNRC Group: Magnetic resonance imaging morphometric analysis of cerebral volume loss in human immunodeficiency virus infection. Arch Neurol 1993; 50: pp. 250-255.
13. Schneider E., Whitmore S., Glynn K.M., et. al.: Revised surveillance case definitions for HIV infection among adults, adolescents, and children aged <18 months and for HIV infection and AIDS among children aged 18 months to <13 years—United States, 2008. MMWR Recomm Rep 2008; 57: pp. 1-12.
14. Appel J., Potter E., Bhatia N., et. al.: Association of white matter hyperintensity measurements on brain MR imaging with cognitive status, medial temporal atrophy, and cardiovascular risk factors. AJNR Am J Neuroradiol 2009; 30: pp. 1870-1876.
15. Paul R., Cohen R., Navia B., et. al.: Relationships between cognition and structural neuroimaging findings in adults with human immunodeficiency virus type-1. Neurosci Biobehav Rev 2002; 26: pp. 353-359.
16. Albright A.V., Soldan S.S., Gonzalez-Scarano F.: Pathogenesis of human immunodeficiency virus-induced neurological disease. J Neurovirol 2003; 9: pp. 222-227.
17. Brew B.J., Pemberton L., Cunningham P., et. al.: Levels of human immunodeficiency virus type 1 RNA in cerebrospinal fluid correlate with AIDS dementia stage. J Infect Dis 1997; 175: pp. 963-966.
18. Moses A.V., Nelson J.A.: HIV infection of human brain capillary endothelial cells—implications for AIDS dementia. Adv Neuroimmunol 1994; 4: pp. 239-247.
19. Louboutin J.P., Reyes B.A., Agrawal L., et. al.: Blood-brain barrier abnormalities caused by exposure to HIV-1 gp120—protection by gene delivery of antioxidant enzymes. Neurobiol Dis 2010; 38: pp. 313-325.
20. Berger J.R., Nath A., Greenberg R.N., et. al.: Cerebrovascular changes in the basal ganglia with HIV dementia. Neurology 2000; 54: pp. 921-926.
21. Glass J.D., Wesselingh S.L., Selnes O.A., et. al.: Clinical-neuropathologic correlation in HIV-associated dementia. Neurology 1993; 43: pp. 2230-2237.
22. Antinori A., Giancola M.L., Grisetti S., et. al.: Factors influencing virological response to antiretroviral drugs in cerebrospinal fluid of advanced HIV-1-infected patients. AIDS 2002; 16: pp. 1867-1876.
23. Canestri A., Lescure F.X., Jaureguiberry S., et. al.: Discordance between cerebral spinal fluid and plasma HIV replication in patients with neurological symptoms who are receiving suppressive antiretroviral therapy. Clin Infect Dis 2010; 50: pp. 773-778.
24. Eggers C., Hertogs K., Sturenburg H.J., et. al.: Delayed central nervous system virus suppression during highly active antiretroviral therapy is associated with HIV encephalopathy, but not with viral drug resistance or poor central nervous system drug penetration. AIDS 2003; 17: pp. 1897-1906.
25. Maubon A.J., Ferru J.M., Berger V., et. al.: Effect of field strength on MR images: comparison of the same subject at 0.5, 1.0, and 1.5 T. Radiographics 1999; 19: pp. 1057-1067.